3 Bull Patterns on BTC about to trigger a bullish domino effectPriceaction is now for the second time solidly back above the bull flag we had been consolidating inside for the past few months ever since hitting the newest ath. It has also gone up to complete the left shoulder of an inverse head and shoulders pattern that is also overlapping the bull flag. We have yet to take price action above that neckline but by the prices current bullish behavior and how its not being rejected that heavily I would expect that we can at least send a wick above the. Teal neckline of the invh&s pattern wishing the next few daily candles if not the current one. Often times price action will go above the neckline of an invh&S pattern and then back below it multiple times before the real breakout gets triggered however in this situation, if price can maintain support above the top trendline of the green bullflag it will likely breakout of the inv h&s with way less back and forth above and below the neckline. The bullflag breakout will bring the momentum necessary to also trigger the invh&s breakout and as priceaction heads to both measured move price targets it will also surpass the purple line and flip it to support s well which is the rimline of a massive cup and handle pattern. This all culminates into one big bullish domino effect and that confluence helps greatly increase the probability of all of thee patterns confirming their breakouts. Not to mention another big invh&s pattern we confirmed the break out from many months ago had a target of 82k and we still haven’t quite reached that yet and in doing so, we also would trigger all 3 of these patterns so it may actually be the most appropriate 1st domino of this domino effect(will link that chart pattern idea below). However these 3 dominoes are clustered all very nicely together so it should lead to a pretty explosive move upwards. The inv h&S’s target is around 86k the bullflag’s target around 101k and the cup and handle target is 133k respectively. One last thing to mention though is that I am basing the bullflag’s price target of 101 k off of the size of the flag pole we see here on the daily(as well as the weekly) chart. Once you flip the timeframe to the monthly chart, you actually can see the pole of the bullflag on that time frame is much bigger and brings the bullflag target up all the way to 117k. *not financial advice*
Inverse Head and Shoulders

Gold is Ready to Dump again!!!Gold started to increase from the Support zone($2,398-$2,376) with the help of the Inverse Head and Shoulders pattern and is moving now near the Resistance zone($2,451-$2,426) and inside the ascending channel .
I expect Gold to take a downward trend again in the coming hours and at least go down to the Targets I specified on the chart.
Gold Analyze ( XAUUSD ), 1-hour time frame ⏰.
Do not forget to put Stop loss for your positions (For every position you want to open).
Please follow your strategy; this is just my idea, and I will gladly see your ideas in this post.
Please do not forget the ✅' like '✅ button 🙏😊 & Share it with your friends; thanks, and Trade safe.

Small inverse H&S in many stocksThis is just for St James's Place, but you'll find inverse head and shoulder patterns in a lot of stocks on the FTSE 100. For me, that means a reversal on the pullback, and this week for example, STJ is confirming the reversal with a break about the neckline and 200 EMA acting as support.

DOGE - DON'T MISS out on ALTSEASON 2.0 !Yesterday we took a look at altcoins that are strong currently - and today I'm adding another, DOGEUSDT.
✅ From a technical indicator perspective, Doge is ready to reclaim a key trendline, as the price is consolidating right under it (bullish). "Extremely Oversold" is usually a good place to buy:
✅ From a Chart Pattern perspective, we observe an inverse Head and Shoulders pattern forming, which is also bullish and confirms a direction reversal. Furthermore, a total of -60% has been retraced and this is prime time for a new upwards wave:
✅ From a trendline analysis, we have successfully reclaimed the neckline after closing daily candles ABOVE the old peak:
I conclude to say that according to the trend and all other signs - the price is short term and long term bullish from here.
_________________________________
BINANCE:DOGEUSDT


I like this oneI know trading in the monthly timeframe is not fun, but is very reliable. I feel comfortable adding and adding every pullback on patterns of high timeframes. Here we have an inverse HS about to break out. I'll buy and buy until the breakout. Then I'll just let it rip. Strong support at 112, SL triggers if a weekly candles breaks it down and closes below it.

8 year inverse H&S for Nat WestAfter forming an 8 year inverse Head and Shoulder pattern is this the time Nat West breaks out?
Still needs to get ahead of resistance at 325 though.
DYOR and this is not a solicitation to take a trade.

FILATEX - Poised for a 15-30% UpmoveThe stock is in uptrend in Monthly.
It is poised to break out of an inverse head and shoulder pattern.
Entry - 51.15
Target 1 - 59
Target 2 - 64
Target 3 - 69.

Fourth attemptPrice is going for another try to break out the triangle and is doing an inverse HS in the monthly timeframe. If it pulls back I'll buy more. Risk reward is good in this one.

Did you know Carvana is up 15X?! OMG :)Look what we have here.
Incredible price action from this stock..
what should you do if you hold it...
or if you are feeling #FOMO
maybe this idea will help.
Inverse Head and shoulders there for all to see.

H D F C A M CHDFCAMC fut made inverse head & shoulder pattern on an hourly chart with increase in OI suggesting long build up.
Risk:-Reward = 1:3
Could be bought above breakout level of 4219 with mentioned stoploss 7 target.

Trump Media could be this years GamestopI am not kidding!
Political motivated investing could moon this thing
forget P/e's cashflow
This is memecoin style investing on the stock market
Its happened before it could happen again
particularly as we get into the election in November and inauguration in January
#MAGA

SPY Has Finally Now Neared Its Final Target Of 570!Traders,
It feels as though I have been discussing a SPY top at around 570 for years now and I can see from the history of my posts that this is actually true.
I first started with the premise that the U.S. stock market would experience a blow-off top of sorts. Elliot-Wave theory and technicals seemed to support this idea. Though admittedly, I am nowhere near an expert in this area, I went with it, following the technical guidance of those who were.
It was not too long thereafter I spotted something on the charts that I was very familiar with. This pattern supported and confirmed the idea that stocks would blow-off. What I spotted was a longer-term (2 year) inverse head and shoulders pattern. This inverse h&s played out and gave me my target of 570.
2 years later, we are finally almost there.
Targets are not meant to be absolutely precise. Close enough is both good enough in hand grenades, horseshoes, and in calling market tops/bottoms. Therefore, not wanting to press my luck, I have decided to finally start taking some profit and moving to cash. Though, my target definitely could be exceeded, it is also possible that it may not be reached. I don't think the latter will be the case but I have been wrong before and could be wrong again. If I had to guess rn, I'd say this blow-off top could extend to a time frame just before election shenanigans begin. We are already seeing some of the nonsense here in the U.S. and thus, I know time is running thin. Before all hell breaks loose, SPY could touch 650.
And then? Anyone's guess.
Best,
Stew

EURUSD - Secret pattern no one talks about! (big crash coming)In my previous EURUSD post, I analyzed the historical chart (1971 - 2024). You know that EURO is heading for a big crash. If you haven't seen this very important post, please check out the related section down below. You have to see it if you are a real EURUSD trader.
Today, let's take a look at the actual 2023/2024 price action to see what is going on here. We have a secret head and shoulders pattern, that no one knows about. In general, the head and shoulders pattern is a reversal pattern and usually occurs at the top of the trend. These patterns are pretty much never perfect, so it's not always easy to spot them. This one is really hard to see, but I made it easy for you. We have 2 shoulders, and each shoulder is composed of a parallel channel. Neckline / HEAD is in the middle. This is of course an important level and strong support/resistance. Right now, it's a support, but once we break it, it turns into a resistance. Of course, I expect a breakdown on this bearish pattern, so make sure you are prepared for what is coming!
Is it good to short EURO now? Yes. Where to take profit? It depends on how long you want to wait. I have market 3 strong levels on the way down. The first is the neckline of the HaS pattern. The second is the POC (Point of Control) of the previous market structure. The third is the previous major swing low.
From the Elliott Wave perspective, I see a bearish Elliott Nest, that is composed of waves (1-2-1-2). This is an extremely strong fractal because once wave 3 starts, a steep downtrend begins. Usually, wave 3 is the strongest of all waves.
Let me know what you think about my analysis in the comment section, and please hit boost and follow for more ideas. Trading is not hard if you have a good coach! Thank you, and I wish you successful trades.

Will try againThe Dollar index is hitting a major resistance and losing the battle. This pair is forming an inverse HS and will try for third time in tow weeks to break out the upper vertex. I'm not sure if is goin to do it this time but price is sitting om 0.61 support zone. SL triggers if a weekly candle closes below the support.

BTC Possible scenarioBTC is making inverse Head and Shoulder Pattern. if it plays we can see some bullish movement here

BTC Possible scenarioBTC is making inverse Head and Shoulder Pattern. if it plays we can see some bullish movement here

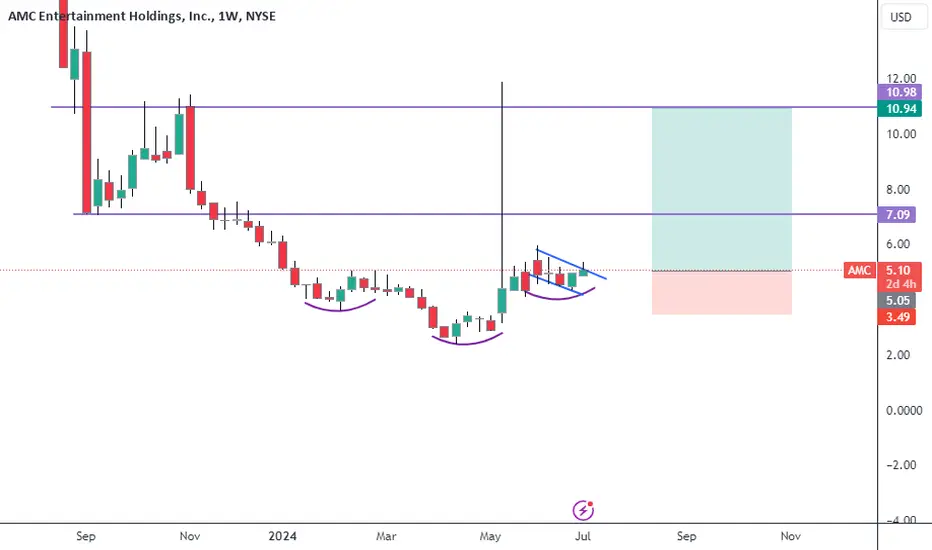
Meme stock alertInverse HS and bullish flag forming. It has already tried to break the 10-11 zone. I think is going to try again. I opened a small long position, not planning to risk much here bc is a meme stock. Just for fun. Also it could find some resistance at 7. Take some profit there.
AUTOLINE, cmp 1331. Inv Head and Shoulders breakout
2. Twice the price target and more.
3. Do your research.

WIF/USDT BREAKOUT DONE! READY FOR A 40% PUMP!!Hey everyone! If you enjoy this content, please consider giving it a thumbs up and following for more analysis.
WIF/USDT breaks out from the inverse head&shoulder pattern in 4hr time frame. After this breakout we can expect a good 35-40% rally from here. Long some here and add more in the dip.
Entry range:- $2.16-$2.28
Targets:- $2.46/$2.72/$3.06
SL:- $2.06
Lev:- Use low leverage (Max 5x)


Breakout in Electronics Mart from Inverse H&S EMIL has had a breakout and successful retest from an inverse H&S pattern on above avg volume day. The Relative strength is also showing an uptick.

Simple Inverse Head Shoulders PatternBull Targets:
- TP 1 87.8k
- TP 2 97.3k
Pre-reqs:
Getting back above 67k and then breaking 71.7k and holding above
Bear Targets:
- 49.1k
- 44.4k
Pre-reqs:
Lose 60k
Good luck!
