NASDAQ- TINA?Sure, low yield rate alone doesn’t justify the extremely high valuation of NASDAQ, but many investors may have overlooked other factors that may have contributed to NDX's rise.
Quick recap of recent macro events-
THE BAD
Corporate profits in the United States dropped 11.8 percent to USD 1,569.2 billion in the second half of 2020, following a downwardly revised 11 percent fall in the previous period, a preliminary estimate showed. It was the sharpest decline in corporate profits since the last quarter of 2008, amid the coronavirus crisis.
According to association of corporate growth, 81% of middle-sized business failed to get a loan through the Fed’s Main Street lending program. Of course, survey might contain the selection bias.
According to S&P Global Market Intelligence, U.S. bankruptcies are on pace to hit their worst levels in 10 years , with experts expecting even more companies to suffer as the coronavirus pandemic stifles economic activity.
A total of 424 companies have gone bankrupt this year as of Aug. 9. Over 100 consumer-focused companies have gone bankrupt this year already. Industrials and energy combined account for nearly 100 bankruptcies. Overall, 35 companies that filed for bankruptcies year-to-date reported more than $1 billion in liabilities.
THE GOOD
Out of the 35 companies that filed for bankruptcies year-to-date and reported more than $1 billion in liabilities, none came from IT.
Overall, only 17 out of 424 companies that have gone bankrupt this year came from information technology.
Most came from large retail, energy, and transportation. Of course, when a big portion of sectors becomes highly unprofitable, investor's money would appropriately reward ones that remain profitable.
According to the Mortgage Bankers Association, The forbearance rate for mortgages backed by Fannie Mae and Freddie Mac dropped to 4.94% in the first week
of August, the first time it’s been below 5% since April.
Almost all housing indicators are up except mortgage origination rate.
THE INEVITABLE
In my opinion, the potential acceleration of industry consolidation is a bigger concern than dislocation. J&J and Apple, for example, are able to get 40yr loan at 3-4 percent interest rate. Low interest rate encourages big firms to refinance and borrow so they can more easily build up large cash cushion for M&A pursuit which ultimately might hurt consumers.
According to American association of individual investors’s July asset allocation survey, individual investors’ exposure to fixed-income assets declined to its lowest level in 15 months. Again, no one likes low yield rate and I would guess most money go into the equity market especially profitable sectors such as tech.
Some investors are still hoping for the dip back to the March lvl.
According to research note from Bank of America securities, since 1928, the 30% market drawdown happens once every decade and the average time for the market to bounce back after a drawdown of 20% or more is 4.4 years.
The two most similar situations in terms of magnitude of drawdown happened in 1987 & 1968 and it took them 101 days and 543 days respectively before the bottom was reached. Many of us thought this time would be the same especially since rarely has the bottom been reached at the onset of recession.
Well, guess what? Many of us have been fooled into believing that this time would be no different without realizing the underlying condition has changed... There was no QE back then.
Past doesn’t always predict the future especially if the underlying condition no longer applies.
Despite of the string of bad macro signals I listed above, market remains unfazed and marches on.
No party can last forever though. I believe that such a meteoric rise in tech stocks will come at the expense of long-term return as high valuation today leads to weak return tomorrow. Inevitably, valuation mean will one day revert lower to stay in line with historical trends.
However, none of us knows exactly when it will happen.
Therefore, waiting on the sideline, incurring the opportunity cost and missing out on all the gain is not the way to go either.
Time like this is why risk management and asset allocation matter.
Longterminvesting


ASX:CSL- Consolidating nicely around 200MA ( Accumulation)
CLS is underperforming the XJO for some time.
CLS Underperformance to XJO was last seen around 2009.
CLS nicely consolidated around 200 MA
I am invested for long term portfolio.
Great buy around 270$
Negative - 17th June - change in leadership CFO Mr David Lamont resigned.
Company is in acquisition spree making the best use of the opportunity.
Australia highest market cap company - good opportunity to keep adding in this retracement.

Gas-LONGCompany just made some major moves and technicals looking promising. If you believe in LNG shipping this ship is on serious discount
* I would suggest you do your own research and have a deep look on balance sheet

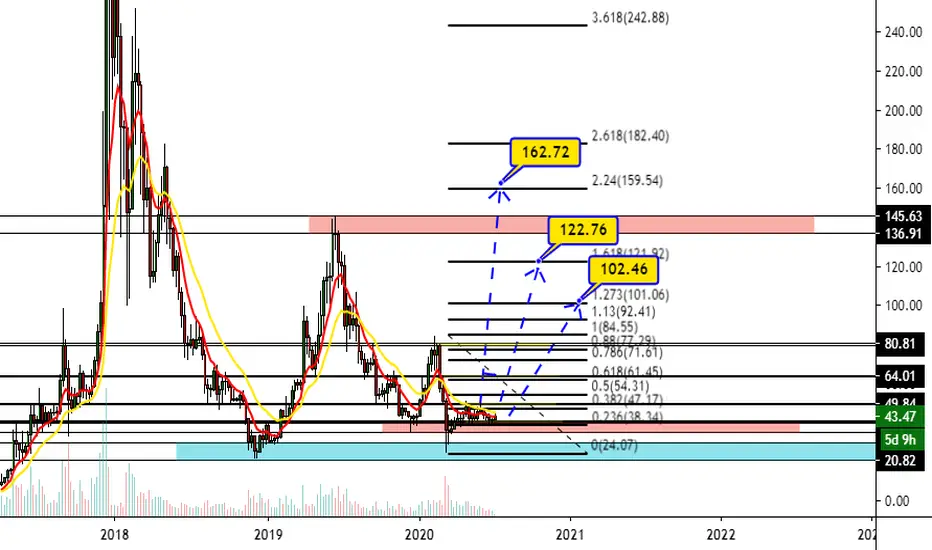
Litecoin show a possible bull run of Altseaso soon!!!Hello guys, in this technical analysis, Litecoin it's seem that have in the accumulation zone!!! So, these are the targets to reaching out in the future, because if you see, Litecoin it's seem that have a formation of armonic pattern if you noticed it. Because I use Fibonacci and mark the 3 possibles target profit to reach in the future, I believe that Litecoin is one of the best investment!!!
And also, this is my screenshoot of my technical analysis that I am in long from Litecoin until the $52 USD as my target to reach, because Litecoin is in this Bullish gartley, so, sleep up now, Litecoin is sleep and it's a good moment to buy Litecoin if you consider the Weekly timeframe of Litecoin, Litecoin could be a nice profits in the future.
Swing Trade Alert. Long over 10.80. Still some downside riskBenefitfocus, Inc. engages in the provision of cloud-based benefits management platform for consumers, employers, insurance carriers, and brokers
BuildGroup Management reports 14.3% active stake in BNFT

YOLO so YOLOHorrible ticker, get over it.
YOLO is a privately managed fund with 100% cannabis industry stocks.
The market cap of this industry has many moons over to before it peaks. We are just starting....
Long term buy which pays dividends. Enjoy.

APPL - Long term Key levelsHey Guys and Community,
Check my long term analysis and key levels on APPLE. AAPL is right now in a very strong SR zone. I am going to look for short and long setup. You can also see my swing long level.
Have a nice day!

Asian Paints bucks the downtrendNSE:ASIANPAINT A Good LONG TERM pick. I know the support trendline is nowhere perfect but according to my second opinion as it is piercing through the candles it is well acting as a good support as well as resistance trend line in itself.

LONG CRUDE WHEN EVERYONE IS BEARISHGood Day Traders!
Here's the trade idea and do let me know if you have any questions! 💰💰💰
Simply following us and we will get you guys our latest updates FOR FREE! Go to the link below & hit the " FOLLOW " button right now !
👉 www.tradingview.com
👉 www.tradingview.com
👉 www.tradingview.com
Our CRUDE setup
Rules:
1. LONG ONLY when price touched the white box. (Checked)
2. LONG ONLY when bullish candlestick formed in 4H/1D chart.
3. DO NOTHING when above #1 & #2 are not met.
TP 1 : level near 28.00
TP 2 : level near 36.00
CL : closed below 15.00
RR > 5
Follow us Rule_no1 and get latest FREE updates !
"All winning professionals know the enormous importance of psychology. Most losing amateurs ignore it."
DISCLAIMER: There is a very high degree of risk involved in trading. Past results are not indicative of future returns. Trade at your own risk.

➕ Long-term trading ➖😍Hello, again😍
👌🏻Today we are completing trading methods!!! 👌🏻
👉🏻The last method, that traders are actively using is long-term trading.👈🏻
So, let's go ...💪🏻
📌“Buy and Hold” - this principle is most suitable for the logic of a long-term investor.
😏 There is even a curious joke:
A daughter👧🏻 comes to her dad👨🏻, a long-term investor, and asks for money🤑:
👧🏻 - Dad, give me $ 100, I want to go to the disco with my friends.
👨🏻 - No, sorry, sweetheart. Now all my money’s in stocks.
👧🏻 - When you’ll sell them?
👨🏻 – Never!
👍🏻 Advantages of long – time trading:
➕Less stress: no need to constantly monitor the stock market.
➕Save time: you can devote the time saved from constantly following the market to other productive activities
➕Less hassle: you don’t need to learn different trading strategies or platforms.
➕Long-term trade helps to save on taxes. It is possible that while short-term traders can pay about 20% -30% of capital gains tax, long-term capital gains will be taxed at only 5% -15%.
👎🏻 Disadvantages of long – term trading:
➖Investments: long-term trading requires you to have free capital. And it should be free for many years. You must be prepared that a certain part of your capital will be blocked in one share, and you cann't use it to receive benefits from short-term trade.
➖Deep knowledge. Long-term trading requires an understanding of the assets you are investing in. You cannot just make decisions based on certain news, advice or rumors. It is also not enough to rely only on charts or indicator signals for buying or selling. You need to be a specialist in fundamental analysis - both of a single company and of the global economy.
➖Long-term trading requires a lot of patience. Failure to remain calm will create problems for the investor in the long run.
➖Age limits. You must have a life horizon in order to take advantage of the investment.
👉🏻Guys, especially beginners, I really hope, that with the help of my posts, you have definitely chosen the trading method for yourself or just learn something new.🙏🏻
🌟I tried to describe the main trading methods as clearly as possible.🌟
👍🏻Support me with like, I’ll prepare for you many more interesting training posts soon!💋
💙Stay with me💛
YOUR Rocket Bomb🚀💣
👇🏻👇🏻👇🏻PS Below I’ll leave links to all posts, that relate to trading methods👇🏻👇🏻👇🏻

Daily Bullish Divergence (ETHEREUM)Really loving this look right now.. Big bullish divergence on the daily time frame.. I truly believe in the technology that Ethereum has brought into the world..
However..
I do not like how we are approaching a long-term support and resistance zone..
I also do not feel comfortable with the volume..
I have a long-term holding position in Ethereum however if we have another drop I will certainly be putting more capital to work.. But maybe I already missed the opportunity.. Let's see..
--
MNLZ

BULLISH MARKET ABOUT TO SKY ROCKET Good evening boys and girls. Today there is a cup with handle or ascending triangle market pattern both resulting from a bullish last couple weeks today there is two pieces of evidence relating to the price of BTC set to skyrocket within the next 12 hours !

longterm btc logarithmic chart on M time farme Moving(ema) 99 is currently priced at $ 2820
If a logarithmic fibo (23.6% level) is broken
2260 is next support And with the loss of this level
Support line in 1305
these are important support of btc price in the bearish trend side
like and comment your ideas
take care put stop ;)

SPY, Which support will stand a chance against new black swan?Hi, traders.
My name is Lukas and I am a beginner in trading, respectively, I only trade 6 months. But that means I have to do the necessary analyzes without it I can't trade. I want to show you how I work on myself and document my beginnings. I use Vix and my strategy is built on to return to average. I highlight the important support levels and resistances that flow from the volume profile, all drawn on graph. These zones determine the ability to respond in some way to the market from 1 to 3, with 1 being the largest.
Short description of analysis:
We are experiencing negative records that have never been here before. Let us be grateful that we are experiencing something like this, because we will gain experience about markets that they do not even describe in 1000 books and movies. Back to analysis. We can see strong support zones that confirm that markets have already responded to these zones in the past. But we are in a very pessimistic period of time, where markets can fall 10% per day. Focus on long periods, even one year. We are looking for the bottom now, but we will rise soon.Of course, my analysis does not serve like market forecasts and I am not responsible for your trades if you use my analysis for your own trades.

IT'S NOW OR NEVERHey everyone,
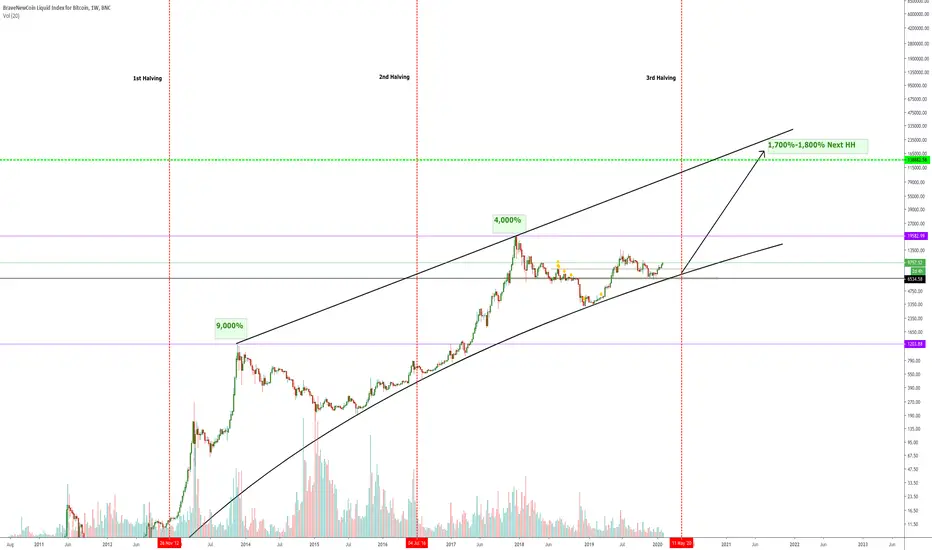
I just want to clarify that i'm not here to discuss the fundamental future of Bitcoin (like the regulated implementation of it in the real world), but instead, show you a very simple long term understanding of where the price might take us, especially after the 3rd consecutive block reward halving that will occur in May. You may have seen a similar type of analysis before, but I assure you, ignoring it will only leave you with regret in the following years to come!
First of, let's understand how the previous "halvings" affected the price of Bitcoin:
1st Halving - BTC goes up around 9,000% to create the new higher high.
2nd Halving - BTC goes up around 4,000% to create the new higher high.
9000/4000 gave us a 2.25 interval. Technically speaking, history within the markets tends to repeat itself. So, our estimation for next price increase (3rd halving), would have to be 4000/2.25 which would give 1,777! This is the number we should consider to determine the next bull run percentage increase from the day halving occurs.
In other words, a bull run is highly anticipated. Mining Bitcoin will become more difficult and there will be less Bitcoin available in supply, which ultimately makes it more scarce. Due to this fact, the demand will be much higher to acquire Bitcoin. The biggest changes in the crypto ecosystem this time, will be the higher public awareness around bitcoin and the interest of institutional investors (hedge funds, banks, pensions, etc.) taking part within the market. Increased public awareness could also lead to a wave of FOMO (fear of missing out) buying power, which could push the Bitcoins price higher and faster. When more financial institutions begin taking big positions, it could affect bitcoin in ways investors have never seen before.
Moving more into the technical side of the analysis, just pay attention to the curve line we see Bitcoin using as a respected support level. It has been respecting it from the very beginning of it's creation, and recently we bounced off the 6,500 price, which acted as the major and probably even the final level of support to acquire Bitcoin at. Looking at the chart today, we see that the curve line surpassed that level and is no longer expecting it to retest it, showing more buying pressure before halving!
We also have quite an important trend line to look out for, which formed itself within the lower high and the current higher high on the 1W time frame. It gives us a better clue as to where the next profit taking levels for Bitcoin would be.
So with all that being said, just note that at the moment we are exactly at the stages where you would be wanting to buy Bitcoin and hold it for a very long period of time, otherwise later would be too late. However, we are actually expecting a pullback to commence in the following weeks, which could ultimately send the price of Bitcoin to the 1st buying target at around 8,500, or the next target at 7,500, which will act as the key level of support to enter longs.
Hopefully this was useful guys. Please trade at your own risk and make sure to invest only as much as you're willing to lose!
Thanks.
IBM Analysis - great opportunity to buy in cheap priceThis is my first idea, this means I have made a mistake, and therefore I apologise to those involved.
NYSE:IBM
Try to open positions under 130 $
(you have got opportunity until that bearish market didn't turn reverse)
Risk: Small
- - - - - - - -
- the IBM has got a very strong Weekly Support at 126.85
#NAME?
- When this Virus situation calms down, the market "get one's ducks in a row"
(in the past: usually 3-6 month)
---------------------------------------------------------------------------------------------------------------------------------------
- If the price however fall below strongly the Weekly Support (126.85) MY ADVICE: SELL to minimize the loss.
---------------------------------------------------------------------------------------------------------------------------------------
RSI:
CCI:
Data from: finviz.com / gurufocus.com
Leading idea: Bullishcharts

XBTUSDChart I made back in August 2019, it played well and the 0.618 fib did act as major support. This led to a bullish move that we are now witnessing. Following the idea of this chart Bitcoin will revisit the 11550 zone from wich we could be rejected again but a bounce from this fib usually lead to higher highs. Breaking this resistance zone should lead us to all time high's

Breaking out strong growthcBrain is a software company listed on NASDAQ OMX Nordic .
cBrain F2, a revolutionary and highly effective tool for digital transformation of knowledge work
cBrain offers the integrated F2 software suite: a highly effective tool and a fast track to digitize all workflows, knowledge processing, records management and communication, including social media, while supporting PCs as well as mobile/tablets.
The Danish State Administration reduced service costs for citizens by over 50%.
It's what citizens have come to expect in Denmark, a country ranked 1st for the last 5 years in the European Digital Economy and Society Index (DESI).
Ministries in Denmark have reduced case processing time by 30%.
96% of users say transparency has improved.
- CBrain is well underway into the German market, where it has succeeded in becoming supplier to a large board of the central administration and has so far won 6 orders.
- The University of Bristol has signed an agreement with cBrain to provide F2 case and document management in the cloud as their new digital platform > May 2018.
- 13 out of 19 Danish Ministries are now using F2 Platform.
- On April 16 2019 cBrain informed that it had concluded its first agreement in the United Arabic Emirates (UAE) The agreement concerns delivery of a F2 based solution for a federal ministry, which supports a national task guide manager.

Still long GOLD, since 2009 [DETAILED]Gold is still a preferred long term asset for wealthy individuals & governments. I've been long since I got into financial markets back in 2008. A wealthy client of mine (whom I did sports recovery on from a Pro Baseball career) suggested I buy gold back then. I had no idea about it, I just bought it & held on. I sold it around 2011 to start another business & have continued to be an investor/trader since.
Currently awaiting to continue buying pullbacks to the (long term) green line. This is a wealth play that I expect to simply hold long term. I BUY PHYSICAL GOLD & track the price value with the chart. You must understand market economics & the historical valuation of GOLD to understand why I approach it this way. GOLD IS NOT A "SAVE THE DAY" ASSET. It is simply a part of a long term asset building strategy to add to a balanced portfolio.

EURUSD 2014 selloff DETAILED ANALYSISEURUSD to continue sell off. Red lines indicate resistance/supply levels. Purple lines indicate possible profit levels or reversal to retest the highs. Seeing how weak the pair was from the move between 2014-15, today's entry would be a continuation of that weakness. Price could retest the Purple lines & reverse to retest the most recent daily high of 1.25438. At which point, I'd be looking for yet another sell re-entry, expecting the trend to continue downward, ultimately making a new low & continuing further. This original impulse move could easily see itself doubled in the next year or 2. This is an easy entry play for profits in a long term portfolio approach.
I'll be approaching this trade in a with a position building technique, similar to a Warren Buffet style. Selling the highs, building the position ate every re-test of the high, as the long term chart has signaled continued weakness.
I don't like a lot of indicators on my charts. The least amount of lines, the better you can step back & see the bigger picture. Volume doesn't even move my decisions in the longer term picture. Large buyers gain the edge by hiding their volume, so why heavily consider it?...

Nifty on monthly charts- exhaustingWhile Nifty 50 on weekly charts still looks positive and we await signals on alternate time frames to see for signals, lets have a quick look what the monthly chart is suggesting
Observations :
1. We have seen (you can see my other post on Nifty Next 50) that the Next 50 stocks are not making new highs like the Nifty 50 (sign that not very broad based move, not very positive)
2. Monthly chart is showing that the momentum is slowing while we are still above the trend line, which price has been testing over the last few months. The real body of the candle has been becoming smaller but the volatility has been increasing , more on the downside, which means bears are trying to push the price down, however, bulls somehow managing to close higher.
3. There is also a bearish divergence between price and RSI, Price moving upwards over the months starting from Jan 2018 upto now, however RSI has been sloping downwards .
4. If you observe the candles from Jan 2018 till date, you will also find that while price has been ,making new highs, the retracements downwards have only slightly made higher lows, very close to previous lows on intra-month action basis, again signifying some kind of exhaustion in prevailing trend .
5. In June 2019, Price made its attempt to close at peaks of 12,124 after opening just below the crucial 12,000 mark, but the bears rejected this price closed near 11,154 levels. From May to July the rejuvenated bulls tried to beat the 12,000 mark but were thrown down stronger to test 10,250 levels
Look out for multi time frame analysis on this on my other posts.
If you like what you see, please share a thumbs up
Cheers

Bitcoin Reveshal Area - 6350$ - 5700$Very close to price action zone. For long term investment... BTC!!!
