Velocity Of Money Rolling Over Again!The Real Interpretation
This chart is telling one story:
Money supply growth has massively outpaced real output for decades.
It lines up perfectly with:
Falling real productivity
Stagnant wages
Declining borrower quality
Rising debt-to-GDP
Asset inflation decoupling from fundamentals
The economy shifting from productive borrowing → consumption and asset speculation
You don't fix this with “policy choices.”
You fix it with real wealth creation, which requires creditworthy borrowers — not printing.
Forward-Looking View
Unless:
Productivity rises
Real output accelerates
Borrowers gain real income strength
Capital flows into productive sectors instead of financial games…this ratio won’t materially rise.
That means:
Every new dollar is buying less GDP
Long-term growth potential is fading
More money chasing fewer productive opportunities
More fragility in the credit system
It’s a classic late-cycle fiat symptom.
Here are questions to ask:
If “money creation” creates growth, why is GDP-per-dollar collapsing?
Why did 40 years of money expansion not produce proportional GDP?
If borrowers create loans, where are the new productive borrowers?
Why did QE cause asset inflation but no sustainable GDP boost?
If the system is “fine,” why does each new dollar buy less real output?
Perma Bulls, MMTers, Politicians etc.. can’t answer those without admitting the private-sector engine is weakening.
The less productive output per $ while the markets keep rising & rising will only produce less and less profit per share over time. No matter how much lipstick they put on that pig. Eventually, the economy & markets will CRASH! They always correct themselves in the end.
Perma Bulls have no exit strategy and will go down with the boat!
MMTers will want Gov to borrow and spend EVEN MORE! despite the empirical self-evident fact that print and play doesn't work!
Politicians will borrow and spend even more, claiming they will "STIMULATE THE ECONOMY"
I got all that from just one chart? NO! The entire spectrum of data.
Here is one
THANK YOU for getting me to 5,000 followers! 🙏🔥
Let’s keep climbing.
If you enjoy the work:
👉 Drop a solid comment
Let’s push it to 6,000 and keep building a community grounded in truth, not hype.
M2

Macro Liquidity Model + Altcoin True Market Cap: CorrelationMacro Liquidity Model vs Altcoin Real Market Cap — CCI & MACD Confirmation
This model uses the formula:
FRED:M2SL / (CRYPTOCAP:TOTAL3 – CRYPTOCAP:USDT – CRYPTOCAP:USDC – CRYPTOCAP:DAI) × TVC:VIX
It shows the relationship between global liquidity (M2) market fear (VIX) and the true altcoin market capitalization (TOTAL3 excluding stablecoins).
This helps us understand which phase of the market we are currently in.
At the moment we are somewhere right near the bottom — if not already at the bottom. You can safely start accumulating any asset you prefer.
The CCI shows “overbought” conditions for M2, which actually means altcoins are oversold.
MACD hasn’t touched zero yet, which suggests there might still be a small dip left — which is also visible on the TOTAL3 – USDT – USDC – DAI chart.
If the next weekly candle closes bullish, there is a chance the market will continue rising until May, especially if the 2020 fractal repeats.
In general, May looks like the optimal time to start taking profits — and then we will see how the macro develops from there.
For additional clarity:
the upper chart represents global money (M2)
the lower chart represents altcoins
the higher the upper chart goes → the more money is OUT of the market
the lower it drops → the more money is FLOWING into the market

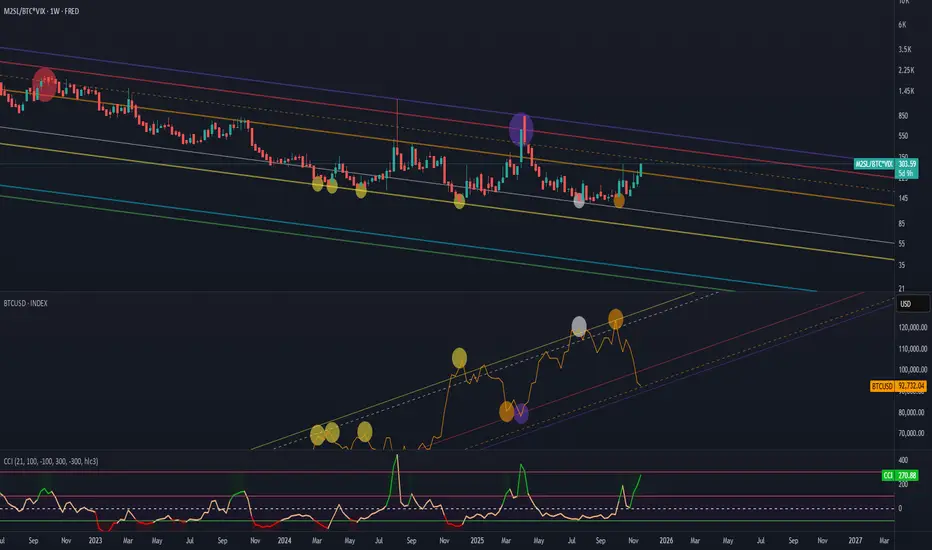
Liquidity (M2) to BTC.D, amplified by (VIX) FEARIt shows the ratio of global liquidity (M2) to Bitcoin’s market capitalization, amplified by market fear (VIX), relative to BTCUSD.
Thanks to this formula, we have an understanding of which phase of the market we are currently in.
In this case the CCI indicator shows:
overbought conditions — meaning money is outside the market and
oversold conditions — meaning there is too much money in the market and it’s time to sell
FRED:M2SL/CRYPTOCAP:BTC*TVC:VIX
For some reason the Bitcoin chart isn’t displaying with all the markings, so I’ll attach a screenshot below.
Argentina Money Supply Reduced Along With InflationWe once again see that MMT ("Modern" Monetary Theory) is 100% wrong. Milton Friedman wins again.
"Inflation is always and everywhere a monetary phenomenon."
Don't let modern economic hacks fool you.

BTC M2 LAG📊 Overview
This chart visualizes the Lapse Legacy Fund System, a composite model integrating global liquidity metrics, macro-technical conditions, and the Hedge Fund Statistical Aggregate Index.
Each component quantifies institutional bias, volatility compression, and rate-of-change dynamics to form an adaptive probabilistic signal engine.
The system currently shows a synchronized SELL/SHORT bias across all analytical layers but we see M2 in an uptrend:
Technical Layer: -1.00 → Structural weakness within intermediate trend fractals.
Higher-TF Technical: 0.00 → Neutral higher timeframe bias, suggesting consolidation rather than acceleration.
Macro-Economic: -1.00 → Liquidity contraction and cyclical drawdown in aggregate liquidity flows.
Overall Signal: -0.67 → Weighted net bearish tilt in global risk appetite.
🧩 Interpretation
Price Structure:
Bitcoin’s price remains elevated within a mid-term distribution range following a strong parabolic advance. While the broader structure has not yet broken down, the series of lower highs on the Statistical Aggregate Index indicates declining momentum efficiency.
Global Liquidity Correlation:
The cyan and green overlays represent global liquidity curves. Historically, these lead Bitcoin by several weeks. The recent flattening in liquidity expansion hints at a potential stall phase or short-term correction window before further trending action.
System Dashboard Readout:
The composite system dashboard below the chart registers synchronized red zones across technical and macroeconomic components. Such multi-layer agreement historically precedes retracement events or trend rotations of varying magnitude.
Equity Curve (Strategy Performance):
Despite short-term volatility, the system’s equity line remains positive with a Profit Factor of 5.47 and Omega Ratio of 1.57, supporting the reliability of the signal environment.
📈 Scenario-Based Outlook
Bearish Scenario (Primary Probability):
If the macro-statistical score remains negative and liquidity stagnates, BTC may revisit support around the $89K–$94K zone before re-establishing directional clarity. This would align with prior cyclical liquidity drawdowns.
Bullish Reversal Scenario:
A decisive re-expansion in liquidity (green curve continuation) combined with an Aggregate Index rebound above zero would signal renewed institutional inflows, potentially re-targeting the $120K–$130K region.
Neutral Range Case:
If the system signals stay near zero, expect sideways mean reversion between $95K–$110K, acting as a volatility compression stage before the next macro-impulse.
🧭 Strategic Insight
This model doesn’t forecast price directly—it quantifies systemic conditions driving capital flows. When the Aggregate Index, Technical, and Macro-Economic layers align, it often precedes sustained moves.
The next directional pivot will likely be defined by liquidity regime changes rather than short-term sentiment.
🧩 Summary
“The Hedge Fund Statistical Aggregate Index currently signals systemic tightening and weakening trend persistence.
A temporary liquidity stall could prompt corrective action before macro liquidity expansion resumes.”

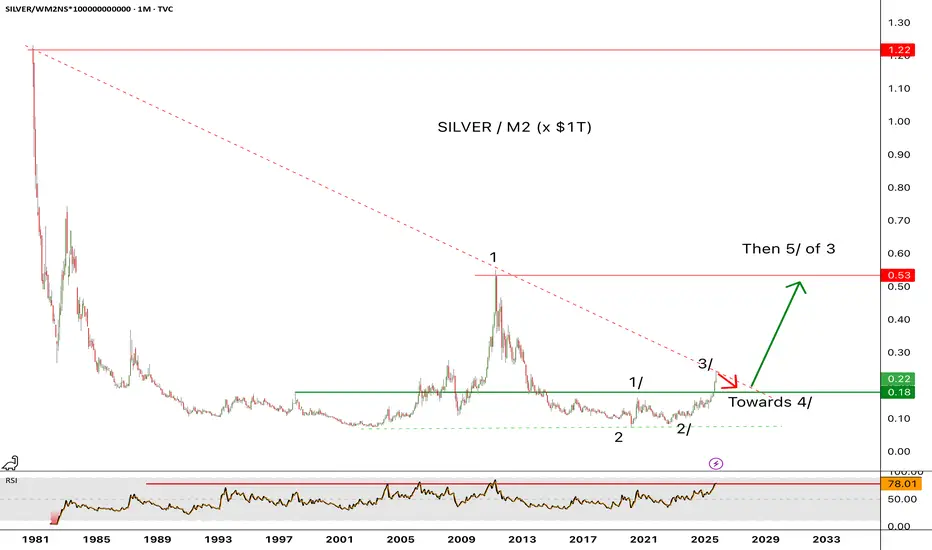
The ratio of Silver / M2 reached an important resistanceThe ratio of Silver / M2 (x$1T) has reached an important resistance last Thursday. It also reached rare overbought condition (see the monthly RSI14 at the 78 resistance area). It is now due for a consolidation phase, support seen near 0.18 (implying a pullback of about 18% to $44 from the recent high of $54 on silver. This could take a few months (normally, but who knows) before exploding above the down trend line towards the 0.53 area. In summary, the rise of silver has just started.
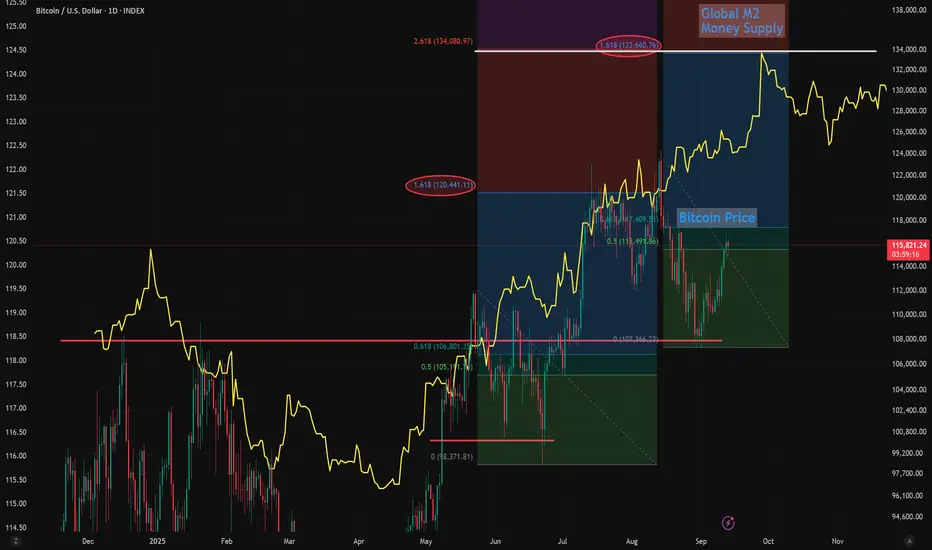
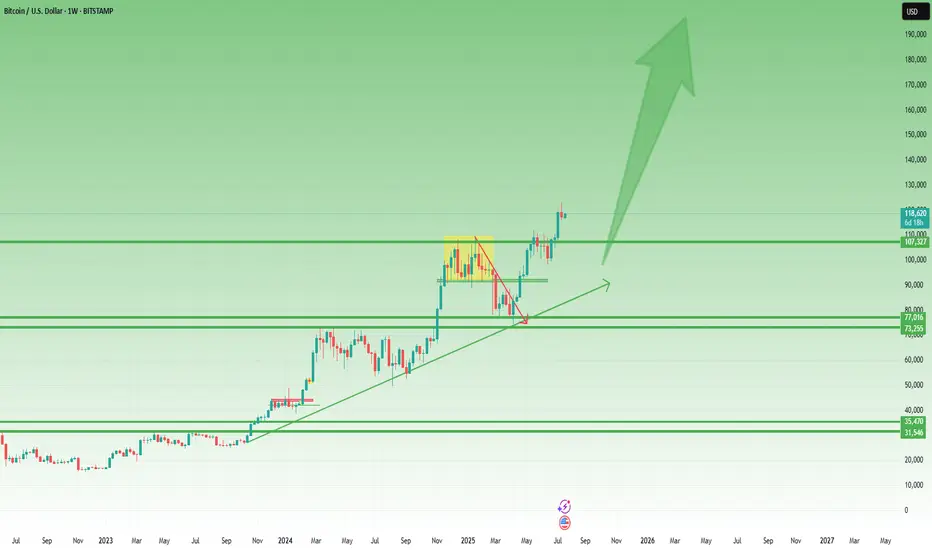
Global M2 and Bitcoin Fib Bounce Targets Point to $134K Next Global M2 has been leading Bitcoin which has been diverging, mostly due to an economic slowdown and waiting for interest rates to start dropping as a catalyst.
Since we're pricing in and high probability of 3 rate cuts starting in September, I expect Bitcoin to start pushing higher and several studies point toward $134k - $135k from here.
These Fibs studies aren't exactly correct, b/c I drew the high / low using the wiicks vs the real bocy, but still interesting.
The first Fib swing high/low correction forecast the pump to the 1.618 target.
So using the most recent high/low swing, points toward around $134k on the 1.618 which is coincidentally the 2.618 extension from the first Fibonacci.
My bull-flag targets on Bitcoin also point to a measured move of $134k-$135k as the next likely profit target, before another pullback and ultimately on the way to $150k this year I think.
Let me know your thoughts below.
- Brett
XAUUSD BreakoutAfter a strong rally up since the beginning of the year, Spot Gold struggled to breakthrough $3,425 for the last 129 days. However, since the beginning of the week Gold broke through that level surging +4.3%.
Seeing Gold continue to rally alongside the stock market, both of which at all time highs despite typically having an inverse relationship.
With M2 money supply ever growing, rate cuts continuing and acceptance of higher levels of inflation there is plenty of fuel to keep this move going no matter how unnatural it feels. Gold typically thrives in risk-off environments but this year has seen huge progress.
Now Gold has entered price discovery it's about riding the wave of momentum caused by the breakout. Should Gold turn around and get back below $3,425 there is potential for worry, a SFP confirmation is bearish. A retest of $3,425 as support with bullish continuation is a more comfortable hold.

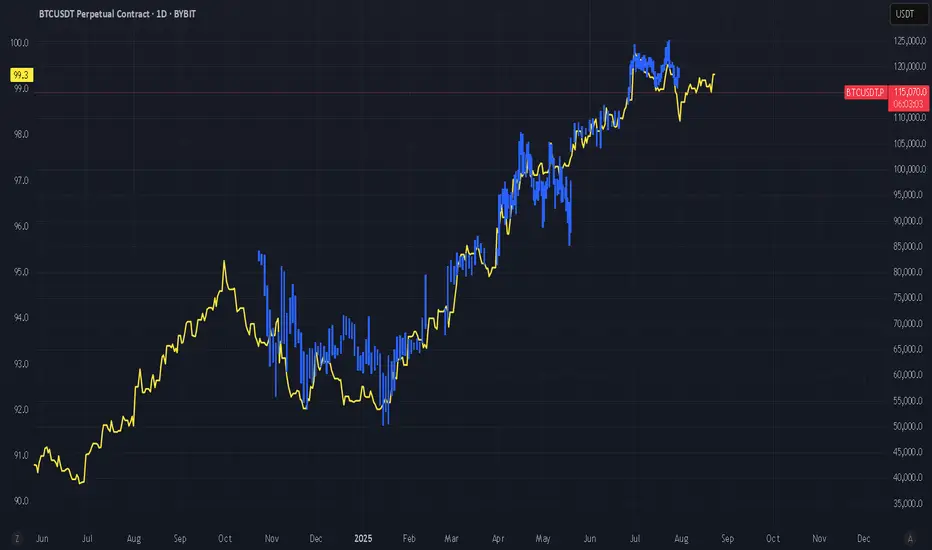
Is a Bitcoin correction still on the horizon?The chart below compares BTC price (blue) and US M2 money supply (yellow). Historically, Bitcoin’s movements have closely tracked changes in US money supply, often with a few months’ lag. With current trends suggesting a potential divergence, a market correction could still be on the table.
Curious to hear your thoughts, where do you see Bitcoin heading next?
#crypto #bitcoin #btc #trading #analysis
BITCOIN 2025 TOP PREDICTION!This chart represents the M2 Money Supply / BTCUSD correlation with an 84-day delay.
You can see that the M2 Money Supply has formed a double top (with a lower high) in late September.
The price of bitcoin tops out 525–532 days after the halving in every cycle.
What does this mean?
In my opinion, bitcoin will continue to follow the direction of M2 in a highly correlated manner. This would mean that BTC's top is only 2 months away.
What price will bitcoin top?
That I'm not entirely sure of yet. The M2 / BTC correlation can be placed in a plethora of different scales. However, it currently looks like the top will be BELOW $200,000.
I hope to be proven wrong, but as of right now, bitcoin is following previous cycles perfectly (excluding the fact that we created a new ATH prior the halving, this was because of ETFs).
Given diminishing returns (and assuming that "supercycle" is not reached), $135,000 - $190,000 top in late September makes sense.

Bitcoin- 175-200k by year's endEvery major Bitcoin move over the last decade — whether a jaw-dropping bull run or a brutal crash — has shared one silent macro trigger.
It’s not the halving.
It’s not ETF hype.
It’s not Twitter sentiment or TikTok FOMO.
👉 It’s global liquidity.
And right now, this powerful force is expanding fast — the same setup that previously drove Bitcoin from $5K to $70K in under a year.
But here’s the twist: as of today, Bitcoin is already trading near $120,000, not $20K or 30k.
That means the engine is already roaring — and if this macro thesis holds, the next stop might just be $175,000-200.000 by year's end.
________________________________________
🧠 What Is Global Liquidity, Really?
Global liquidity = the total money sloshing around the financial system.
It’s often measured through M2 money supply, combining:
• Cash
• Checking/savings deposits
• Easily accessible liquid assets
The most comprehensive view comes from Global M2, which aggregates liquidity from 20 of the world’s largest central banks.
Right now, Global M2 is not just rising — it’s breaking to all-time highs.
And if history repeats itself, Bitcoin tends to follow this wave closely.
________________________________________
📅 Past Performance: Bitcoin and Liquidity Walk Hand in Hand
Let’s break it down:
• 2016–2017: Liquidity surges → BTC +5,000%
• 2020–2021: Post-COVID easing → BTC $5K to $69K
• 2018 & 2022: Liquidity dries up → BTC crashes ~70%
It’s a recurring pattern:
Liquidity drives the crypto cycle.
________________________________________
💡 Why Liquidity Moves: Interest Rates and Central Banks
Central banks control the tap.
• 🟢 Cut rates → Easier credit → More lending → More liquidity
• 🔴 Raise rates → Tighter credit → Less spending → Liquidity contraction
In 2022, the Fed tightened hard.
🧊 U.S. money supply shrank.
📉 Bitcoin fell from $70K to $15K.
But starting August 2023, the Fed paused, then pivoted.
Since then:
• 🟢 The U.S. M2 supply rebounded
• 🟢 Global M2 began expanding again
• 🟢 Over 64 global rate cuts were made in just six months — one of the fastest global easing cycles in history
The last time we saw this much cutting? 2020.
And we all know what happened to Bitcoin then.
U.S M2
________________________________________
🟢 Today’s Setup: The Engine Is Already Running
Fast forward to mid-July 2025:
Bitcoin is no longer at $30K — it’s already testing $120K.
Intraday highs have touched $123K, with a current consolidation zone between $117K–$120K.
This isn’t a "recovery rally" — we’re already in price discovery territory.
The question now becomes:
Is $150K and above next… or are we topping out?
________________________________________
📈 Charting the Path: Bitcoin vs Global M2
When we overlay Bitcoin price over global liquidity trends, one thing becomes crystal clear:
📊 Bitcoin tracks liquidity direction.
• When money supply expands, Bitcoin rallies.
• When money dries up, Bitcoin tanks.
Given that global M2 is at record highs, and liquidity conditions are easing globally, the chart suggests there’s still plenty of fuel in the tank.
And if we follow the same growth, Bitcoin could realistically reach $175,000 before 2026 kicks in.
________________________________________
Technically:
As we can clearly see from the posted weekly chart, you don’t need to be an expert to recognize the strength of the current uptrend.
While last week printed a small bearish Pin Bar, this alone shouldn’t raise major concerns — especially considering the presence of multiple key support levels, starting from the 110K zone.
In the context of a strong and well-established trend, such candles often reflect normal short-term profit-taking, not a reversal.
🎯 Conclusion – Don’t Fight the Tide
This isn’t about hopium.
It’s not moon talk.
It’s about macro flows and monetary velocity.
Ignore the noise.
Watch what the central banks are doing.
Because Bitcoin moves not on wishful thinking, but on waves of liquidity — and the tide right now is rising fast.
Whether $175K comes by year-end, one thing is clear:
We are in the middle of a liquidity-driven expansion phase, and Bitcoin is already responding.
Stay focused, manage your risk, and don’t chase — ride the wave. 🌊
Global M2 Money Supply (70/84/90 Day offset) and $150k BTCI'm using Global M2 slightlty different than most here, and showing it behaves differently during different periods of the cycle.
Many people say M2 leads Bitcoin by 10-12 weeks (70 - 84 Days) and I've seen periods where it does... But in this phase of the bull-run 90 days is working best.
We can see the dip in M2 around now coinciding with the drop in Bitcoin prices.
Of course, these are not directly correlated and can't be relied upon as predictive.
But it's following pretty close, and overall looks great for further upside!
I'll follow up with a video on this if anybody is interested.

Is SP500 / US M2 Money Supply telling us a story?Historically this ratio has inflected from key levels. Last week the upper boundary of what 8 would call a normal range has acted as support. If history rhymes to dot com bubble, this AI bubble can bounce from these levels and see an increase until Q4 2026, then a sharp fall will follow. To the lower boundary of that normal range.

Global M2 Money SupplyWith more money than ever before in circulation available. Asset prices should go up..
Do you agree or disagree?

Altcoins (Market Cap) - Excluding Top 10 Coins - Inverted H&SBullish setup on the daily chart. CRYPTOCAP:OTHERS have once again made a inverted head & shoulders pattern which is a bullish reversal pattern. With the yellow chart below showing the Global M2 Liquidity index breaking out aswell. With more money in circulation, the propabilty is that more money will enter the market over time. Although, there can be latency.
For now I will trust the patterns in the chart of Others and follow it to see IF we can confirm the Inverse H&S. We have to break the neckline which should be around 310-325 B for June and July. But still, after that we need a pullback to confirm that neckline and make it support for continueation.
It´s a very interesting world right now. And much can happen. But IF this break out. It would probably be one of the most explosive bull markets to remember for a long time.. I myself are holding quality coins and tokens. Im not in memecoins, whats so ever. With the adoption happening right now in crypto I don´t believe that is the right market to be in right now.
Nothing on this profile should be interpreted as financial advice. Always do your own research and investment decisions. Im only expressing my thoughts and beliefs. Nothing else. Crypto is a risky business but It also has a lot of reward If being right. I can´t find equal yield in any other markets for now. If you know any, plz comment below =)
BINANCE:BTCUSD
CRYPTOCAP:OTHERS
CRYPTOCAP:TOTAL
MARKETSCOM:ETHEREUM
BINANCE:SOLUSD
BINANCE:SUIUSD
ICEUS:DXY

BTC is basically SPX with a higher multiplesince Wall Street got in we actually got significantly more correlated (obviously)
(it wasn't as much prior to 2021)
BTC has basically become SPX with a higher multiple.
Do with that what you will

BTC M2 CorrelationMaybe Raoul is right and it was M2 all along.
Monetary policy driving all markets, see correlation and time-lag (offset) on chart.

BTC Log Trend accumulation/expansionnoticed this Accumulation/Expansion/Contraction idea when trending along the Log Pitchfork lines.
and the high correlation to SPX (and M2) for direction.

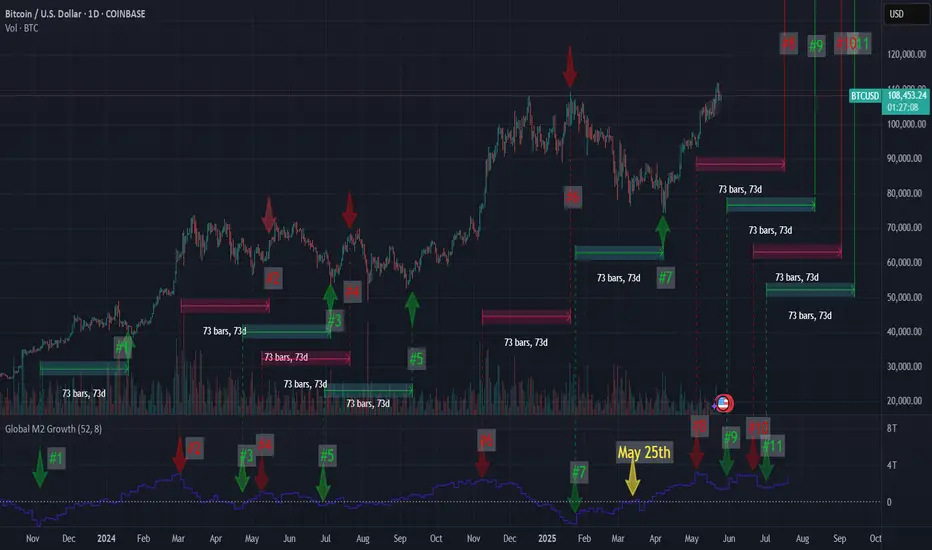
73 days looks to be spot on73 Day Lag to the Global M2 Money Supply looks to be spot on for the last year. If it is, this is good news with the M2 still climbing.
If I am right, we will have a dip within 24 hours of May 28th, only to get another pump to the upside withing 24 hours of June 2nd.
(I tried inputting all this data to Grok in order for him to give me some price targets. They were close to where I think the price will be but using the M2 for price targets still needs some work.)
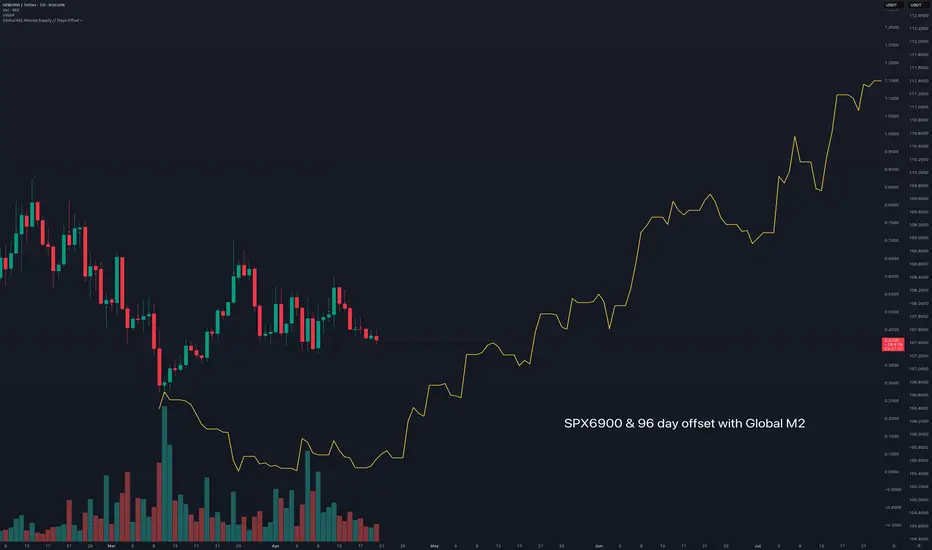
$SPX6900 following Global M2 money supplyFollowing Colin Talks Crypto's BTC & Global M2 money supply.
I'm using his script to generate global M2, in his version there is a 108 day - 86 day offset.
Here with SPX I adjusted to between that range at 96 days.
This sets up a strong outlook for SPX6900 going into the new few months.
Gold Skyrockets Like It's 2011: Are We There Yet?Gold has been on a powerful run since breaking above the 2100 resistance level in March 2024. After just one year of relentless gains and a return of over 60%, it has become one of the top-performing assets. But the big question now is: how far can this rally go? To the moon?
It's difficult to predict how far prices can climb during these kinds of parabolic moves. In 2011, the final green monthly bar alone rose 17% from open to high. These FOMO-fueled surges often lead to euphoric tops followed by painful bear markets. So, are we there yet?
Since Richard Nixon ended the dollar's gold backing and introduced the modern fiat system, gold's status as a safe haven has become even more prominent. Whenever there are heightened risks, whether geopolitical, fiscal, or related to the fiat money system, investors tend to flock to gold. The 2011 rally was a clear example of this. After the 2008 financial crisis and the quantitative easing that followed, gold became the go-to asset for both preserving value and speculative opportunity.
A similar pattern has unfolded following the COVID-19 shock. The Federal Reserve returned to aggressive quantitative easing, while both the Trump and Biden administrations increased fiscal spending, including direct payments to households. This surge in money supply and concerns about fiat stability, along with rising government debt, helped trigger another major gold rally. With the added risk of a trade war, the rally has accelerated further, pushing gold beyond 3300 and creating a situation that closely mirrors 2011.
Looking at the money supply-to-gold ratio and the US federal debt-to-gold ratio, gold now appears to be testing trendline levels. Its recent surge has made metrics like M2 and federal debt seem relatively smaller, which may be a sign that the rally is approaching exhaustion.
Still, history shows that final euphoric moves can stretch even higher before a true top is formed. Rather than trying to predict the peak, it's often better to wait for signs of price stabilization. Gold typically offers a second opportunity, often forming two peaks with the second lower than the first, before entering a bear phase.
In 1980, gold fell more than 60% within two years. After the 2011 top, it declined nearly 40%. Even if the retreat expected to be milder this time, gold could still offer a 20% or greater downside opportunity once the top is in.
Smart money has already started to take profits gradually. Net managed money positions in the COT report have decreased by 40% since January, as we discussed in our earlier post:

Prepare for LIFTOFF $ADAThe Global Net Liquidity index is breaking out of its multiyear downtrend channel on the back of a weak TVC:DXY dollar. Altcoins like CRYPTO:ADAUSD and other risk assets historically wildly outperform during Global Net Liquidity uptrends and dollar debasement cycles. As the business cycle heats up with ISM Manufacturing PMI ECONOMICS:USBCOI rising above 50, expect altcoins to gain relative strength to CRYPTO:BTCUSD and a Bitcoin Dominance
CRYPTOCAP:BTC.D collapse into the 35-45% range.
This is your last chance.

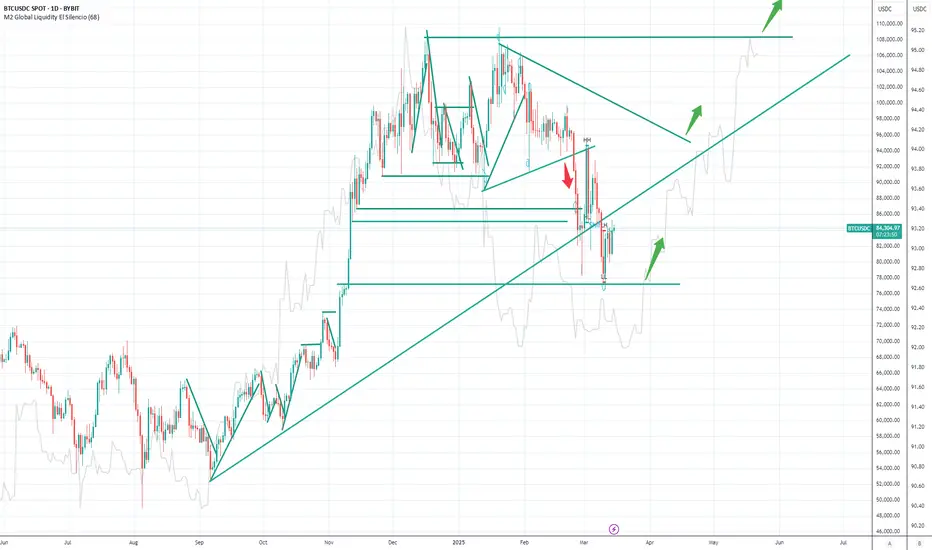
M2 LiquidityTrend reversal expected around March 25-30!
77k support, bull run can start. Bounce is expected if the fall continues. Double bottom formation with narrow STOP entry option.
M2 Liquidity indicator forecast 10 week offset W1 (68 day D1 view).