XAUUSD - Time for correction or new move?Hello TradingView Community!
Gold is currently trading well above the 1.272 Fibonacci extension of the recent major impulse leg — a level that has often served as a strong exhaustion point after sharp upside moves.
Combined with repeated failures to push meaningfully higher over the past several days (price keeps testing resistance without a decisive close above), this setup could signal a potential short-term reversal and the beginning of a correction back toward the broader trend.
Key levels we're watching if the pullback develops:
• First magnet / POI: Daily Fair Value Gap (FVG) around 4,550
• Deeper target & stronger support: 4H Point of Control (POC) near 4,481
These zones represent classic areas of imbalance where price frequently returns to rebalance after overextensions.
We'll need bearish confirmation (rejection candles at the highs, downside volume increase, or break of recent structure) to confirm the move lower. Until then, the bias remains cautious on new longs while monitoring for short opportunities on weakness.
Globally gold still screams long-term bullish (geopolitics + CB demand ain’t going anywhere), but yeah — a clean dip to 4550 FVG and especially 4481 POC would be the healthiest thing right now. Shakeout weak hands, reset RSI, better structure for the next leg up.
What do you think — signs of exhaustion building, or still room for one more push? Share your views below! 🚀
#Gold #XAUUSD #TradingView #SmartMoney
Macro

Silver is flashing a warning it hasn’t shown in decadesToday the price crossed $90 per ounce while the monthly RSI the 92 level. Higher than 2011, when silver topped out near RSI 82 and then fell by ~80%
The only other time we’ve seen this level was 1980… followed by a ~90% crash
History doesn’t repeat perfectly, but it does rhyme
So the real question is: what makes this time different?

USD/MXN 2026 Outlook: Volatility Returns After Stellar RallyThe Mexican Peso (MXN) enters 2026 at a crossroads. After a stellar 2025 where it appreciated approximately 23% against the US Dollar (USD), the currency now faces a "perfect storm" of geopolitical friction and shifting macroeconomic tides. The pair plunged from 20.50 to 17.88 last year, driven by a resilient carry trade and a weaker dollar. However, analysts warn that the easy gains are over. The year ahead promises heightened volatility as trade renegotiations and central bank pivots collide.
Geopolitics & Geostrategy: The USMCA Stress Test
The political landscape remains the primary driver of USD/MXN volatility. President Donald Trump’s second term has already introduced significant friction, most notably with the "Liberation Day" tariffs imposed in April 2025. While the subsequent suspension of tariffs following President Claudia Sheinbaum’s immigration agreements provided relief, the underlying tension persists.
The formal review of the United States-Mexico-Canada Agreement (USMCA) scheduled for summer 2026 is the next major flashpoint. The White House is expected to leverage trade policy to extract concessions on migration and drug enforcement. Specifically, US negotiators aim to enforce stricter Rules of Origin to prevent Chinese firms from using Mexico as a "backdoor" into the US market. This aggressive stance could periodically pressure the Peso, pushing the pair higher during negotiation stalemates.
Macroeconomics: The Interest Rate Differential
The wide interest rate spread between Mexico and the US has been the Peso's primary shield. With Banxico’s reference rate at 7% and the Fed’s funds rate at 3.50%-3.75%, the 325-basis point differential remains attractive. However, this gap is set to narrow.
Banxico is poised to continue its easing cycle, with markets pricing in a cut to 6.50% by year-end 2026. While Governor Victoria Rodriguez Ceja notes that currency appreciation has helped tame inflation (projected at 3.5% for early 2026), she acknowledges that external US financial conditions will dictate the pace of cuts. Conversely, uncertainty surrounds the Federal Reserve. The potential nomination of a loyalist like Kevin Hassett as Fed Chair could trigger aggressive US rate cuts, weakening the Dollar. A more traditional pick like Kevin Warsh would likely stabilize the greenback, posing a risk to the Peso’s strength.
Industry Trends: The Carry Trade Unwind Risk
The "Carry Trade" borrowing in low-yielding currencies to invest in high-yielding ones powered the Peso’s 2025 rally. However, the funding side of this equation is changing. The Bank of Japan (BoJ) raised rates to 0.75% in December and is expected to hike further.
If the BoJ adopts a hawkish stance in 2026, the cost of funding these trades will rise, shrinking the net margin for investors. A rapid unwinding of these positions would trigger a sharp depreciation of the Peso, regardless of domestic Mexican fundamentals.
Technical Analysis: Bears Target 2024 Lows
Technically, the USD/MXN pair remains in a downtrend. The price action has broken below the confluence of the 100- and 200-week Simple Moving Averages (SMA) near 18.82. Momentum indicators like the RSI remain in bearish territory but are not yet oversold, suggesting further downside potential.
Sellers are eyeing the July 2024 low of 17.60 . A decisive break below this level exposes the massive psychological support at 17.00 , with a potential extension toward the 2024 yearly low of 16.26 . Conversely, bulls need to reclaim the 18.82 resistance level to invalidate the bearish thesis.
Summary
The Mexican Peso’s "Goldilocks" period is ending. While the currency remains fundamentally supported by a 6.50% projected yield, the external environment is deteriorating. Traders should prepare for a volatile 2026 defined by USMCA headlines, potential Fed politicization, and the looming threat of a Japanese rate hike unwinding the carry trade. The bias remains lower for USD/MXN, but the path will be far more turbulent than in 2025.

EUR/JPY | Rising Channel Extension – Momentum vs RiskEUR/JPY continues to benefit from a wide EUR–JPY policy divergence, but the pair is increasingly exposed to volatility should yen sentiment shift via BOJ communication, inflation data, or broader risk-off conditions.
Technical Lens (Daily):
Price remains firmly within a well-defined rising channel, respecting higher highs and higher lows. The broader trend structure is intact, but momentum indicators are flashing caution — RSI remains elevated, signalling increasingly stretched conditions rather than immediate trend failure. At current levels, price sits in what is effectively “no man’s land”: trend-following structure holds, but upside efficiency is diminishing.
Lower Timeframe Note (H1):
On the intraday chart, a short-term flag structure has resolved to the upside, aligning with the broader daily trend. While this supports near-term continuation, it does not materially reduce the higher-timeframe correction risk at these elevated levels.
Scenarios:
If channel support continues to hold → the trend can extend further, but upside progress may slow and become more volatile as momentum cools.
If channel support breaks → scope opens for a corrective pullback toward prior channel midline and structural support zones.
Catalysts:
BOJ rhetoric or policy signalling
Japanese inflation data
Broader risk sentiment shifts impacting JPY demand
Takeaway:
The trend is intact, but elevated positioning increases correction risk — this is a continuation structure with declining margin for error.
Q1 2026 Bias:
Trend continuation remains the base case, but with elevated vulnerability to corrective phases if yen strength emerges.

SPY – ATH into Heavy Macro Week | Trend Still IntactThesis
AMEX:SPY continues to trade in a mature but intact bullish cycle, pushing to new all-time highs despite a heavy macro and event-driven calendar.
Context
- Weekly timeframe
- CPI, PPI, Jobless Claims ahead
- Start of key earnings season
- Supreme Court ruling delayed into next week, adding uncertainty
What I see
- Market printed another ATH and closed the week at the highs
- Price remains well above rising trend support
- No visible distribution or topping structure yet
- Momentum remains strong despite known macro risks
What matters now
- As long as price holds above the rising channel, the trend remains bullish
- Last CPI print came in much cooler than expected
- A second consecutive soft CPI would confirm a disinflation trend and likely fuel further upside
- Market is clearly not pricing near-term stress
Buy / Accumulation zone
- This is not an area for aggressive new buying
- Focus shifts from adding risk to managing and cleaning the portfolio
- Selectively trimming positions that fully rode the last 5–6 years of the cycle
Targets
- Trend-following extension remains open toward higher Fib projections
- No confirmed cycle top yet
Risk / Invalidation
- A sustained loss of the rising channel would signal the need to reduce exposure
- Until then, price action favors holding, not anticipating a top

The Yield Curve: A Forex Trader’s Early Warning SystemTradingView added the Yield Curves tab (found at the bottom right of your chart) to their UI last Year and constantly improved upon it. At first glance, it looks like a tool just for bond traders. But even though I am not a bond trader (yet), I started wondering: Can we use this as an early indicator for Forex trading?
The short answer is YES . While Forex traders usually watch price action and news, bond yields often move before the news hits the screen. In this write-up, I will show you how to use this "hidden" signal to stay one step ahead of the market.
First things first: How to Recreate My Charts
If you want to track this yourself on TradingView, search for these two symbols:
- US10Y - US02Y: This shows the "Spread" the gap between long and short rates.
- FRED:DFF: This shows the actual daily interest rate set by the Federal Reserve.
By overlaying these, you can see exactly when the bond market (the Spread) moved before the Fed (the Rate).
The Basics: What is a Bond Yield? (The Seesaw Rule)
To understand the chart, you only need to know Bond prices and yields move like a seesaw.
- When traders buy bonds: The price goes up, and the yield goes down.
- When traders sell bonds: The price goes down, and the yield goes up.
Why do we care? Yields represent the "market's opinion" on interest rates. If yields are falling, the market is betting that the Fed will cut interest rates soon. If yields are rising, the market expects rates to stay high. Because interest rates drive currency value, the yield curve is the ultimate indicator of what "Smart Money" is doing before the news goes public.
The Simple Math (The "Seesaw")
Bond yields and bond prices move on a seesaw. When one goes up, the other must go down because the interest payment (the "coupon") is fixed.
Think of a bond as a fixed contract that never changes. If you own a bond that pays exactly $50 a year, that $50 is locked in.
- Scenario A: You buy a bond for $1,000 that pays $50 interest. Your yield is 5% ($50 / 1,000).
- Scenario B: (Low CPI): Suddenly, a low inflation (CPI) report comes out. Investors get excited because they think the Fed will cut interest rates soon. They rush to buy your bond. Because everyone wants it, the price of your bond rises to $1,100.
The Result: The bond still only pays that fixed $50. But because the new buyer paid $1,100 for it, their yield is now only 4.5% ($50 / 1,100).
Simple English: You are paying more money (higher price) to get the same fixed reward. Therefore, your percentage of profit (yield) goes down.
Summary so far:
Low CPI: The market anticipates lower interest rates in the future.
The Action: Traders rush to lock in today's higher rates by buying bonds.
The Result: Bond prices go up.
The Math: Higher price for the same interest = Lower Yield.
This is why you will see the US10Y yield drop on your TradingView chart the second a "cool" inflation report hits the news.
Setting the Scene: The "Early Indicator" Theory
In a healthy economy, a 10-year bond should pay more than a 2-year bond. Why? Because lending money for 10 years is riskier than lending it for 2 years. This is a "Normal" curve.
An Inverted Curve happens when the 2-year yield is higher than the 10-year yield. This is the market’s way of saying: "We think the Fed has pushed rates too high for the 'Now,' and they will be forced to cut them in the 'Future' to save the economy."
The Timeline: 2019 to Today (Context to the Chart Above)
1. Aug. 2019: Pre-Covid Jitters The spread touches 0. The US-China trade war was slowing global growth. The bond market warned of a slowdown months before the pandemic.
2. Mar. 2020: Pandemic Shock The Fed cuts rates to 0.1%. The spread spikes as the market expects a massive recovery.
3. Mar. 2021: The "Transitory" Trap Inflation starts rising. The Fed says it’s temporary and keeps rates at 0.1%, but the spread starts falling. The bond market knew the Fed was wrong and that rate hikes were coming.
4. Mar. 2022: The Pivot The Fed finally hikes rates. The "Cheap Money" era ends. The 2-year yield spikes to keep up with the Fed.
5. Jun. 2022: Inflation Spike (KEY EVENT) (9.1%) Inflation hits a 40-year high. This is the "Panic Point." Investors realize the Fed must hike aggressively to break inflation.
6. Jul. 2022: The Great Inversion The spread falls below 0. The market signals a recession is coming. For the first time since 2008, the market decided that the "Now" was more risky than the "Future.”
7. Jul. 2023: The Bottom (KEY EVENT) (Soft Landing Bet) The spread hits its lowest point (-1.08%). Inflation drops to 3%, but jobs stay strong. The market starts betting that we might avoid a crash. The spread begins to rise.
8. 2022–2024: The Long Wait The longest inversion in history (26 months). The economy was "immune" to high rates because of 3% mortgages and corporate cash.
9. Sep. 6, 2024: The Un-Inversion (KEY EVENT) (Soft Landing Confirmed) The Golden Signal. The curve turns positive. This wasn't because of a crash, but because inflation was defeated. The bond market confirmed the Soft Landing 12 days before the Fed’s first 0.50% cut.
10. Jan. 2026: Normalization We are here today. The spread is stable at +0.68%. The Fed rate is 3.50%. The curve is healthy again.
The Takeaway
The Rule: The bond market represents "Smart Money."
The Signal: A rising spread usually means the market expects rate cuts or economic strength.
For Forex: If the spread rises before the Fed cuts, it’s an early signal to look for Dollar weakness.
The next time you see the US10Y - US02Y line making a big move on your chart, don't wait for the Fed meeting. The bond market has already made its decision. If the spread is rising, the market is "pricing in" a weaker dollar or a rate cut. As Forex traders, that is our cue to look for setups.
Think of it this way: The spread is a "Confidence Meter."
Falling Spread: "We are worried the Fed is hiking too much."
Rising Spread: "We are excited the Fed is finally cutting rates to help the economy."
*** Congratulations for making it this far! Let me know in the comments if you use or plan to use these early indicators.

GBP/NZD 2026: Why the Kiwi is Winning the New Year RallyThe GBP/NZD exchange rate faces intense pressure as 2026 begins. A surge in global risk appetite is currently driving investors toward the New Zealand Dollar. Meanwhile, disappointing economic data from London is weighing heavily on the British Pound. This divergence has pushed the pair into a defensive posture near the 2.33 level.
Geostrategy: From Venezuela Shock to Settlement
Geopolitical tensions initially spiked following the U.S. military operation in Venezuela on January 3, 2026. However, the "fear factor" evaporated quickly as early dialogue between Washington and Caracas began. Markets now hope for a stabilized energy corridor rather than a prolonged conflict. This shift from "panic" to "risk-on" directly benefits the New Zealand Dollar. As a high-beta currency, the "Kiwi" thrives when global uncertainty recedes.
Macroeconomics: The UK's Services PMI Reality Check
The British Pound struggled this week following a significant revision to the UK Services PMI. Final figures for December 2025 dropped to 51.4 from an initial "flash" estimate of 52.1. This downgrade signals that the UK's core growth engine is losing steam. Rising operational costs and weak European demand are currently squeezing British margins. Consequently, traders are increasing bets on aggressive Bank of England rate cuts throughout 2026.
Industry Trends: Agriculture and High-Tech Resilience
In New Zealand, the "Fonterra Pivot" is generating renewed optimism for the national balance sheet. The expected return of capital from Fonterra’s consumer brand sales is supporting the rural economy. Furthermore, New Zealand’s high-tech precision farming sector continues to attract significant international investment. These "green shoots" in domestic activity contrast sharply with the UK's sluggish industrial sector. While the UK recovers from a major cyber incident at Jaguar Land Rover, New Zealand is accelerating its export growth.
Technology and Cyber: The Productivity Gap
The UK's long-standing productivity challenges remain a significant hurdle for Sterling. Recent Office for National Statistics data shows the UK attracted the lowest investment in the G7 during 2025. While some British firms are finally integrating AI to lower costs, the rollout remains fragmented. In contrast, New Zealand's focus on tech-led agricultural efficiency has created a more resilient "commodity-plus" economic model. This technical advantage supports a stronger long-term floor for the NZD.
Management & Leadership: The BoE vs. RBNZ
Management of monetary policy is now the primary battleground for this currency pair. The Reserve Bank of New Zealand (RBNZ) has lowered the OCR to 2.25%, signaling the end of its easing cycle. Conversely, the Bank of England is just beginning to face its growth-inflation dilemma. With UK unemployment rising to 5.1%, the BoE faces immense political pressure to slash rates. This policy divergence favors the New Zealand Dollar’s yield advantage over the Pound.
M2 Liquidity vs Gold × VIX — Macro Stress & Liquidity GaugeThe formula reflects real U.S. dollar liquidity, normalized through gold as a long-term store-of-value anchor and multiplied by VIX — an indicator of market stress and expected volatility.
The indicator has been working for over 20 years and captures global market sentiment: periods when market participants are willing to take on risk, as well as phases of consolidation and heightened caution.
The green zone represents periods of fear and liquidity compression — precisely the conditions under which favorable opportunities for gradual position accumulation are formed.
The red zone reflects overheated market phases, when investors are already deeply positioned and the incentive grows to lock in profits, move to cash, or rotate capital into other asset classes (under current conditions — including crypto markets).
The yellow zone serves as a transitional decision-making phase.
When the indicator moves from the green zone toward the red zone, the yellow zone acts as an area for partial profit-taking, helping reduce risk ahead of potential market overheating.
When the indicator moves from the red zone toward the green zone, the yellow zone may serve as an area for re-entering or gradually rebuilding a position.
The yellow zone functions as a balancing range, allowing for position management and capital reallocation without attempting to precisely time market reversals.

EUR/USD 2026: Why the Dollar Dominates Despite Global UnrestThe EUR/USD pair entered January 2026 under significant pressure. The U.S. dollar recently hit a three-week high against the euro. While geopolitical headlines scream of regime change in South America, the market remains cold. Investors are ignoring the noise to focus on iron-clad economic fundamentals. Current price action near $1.1704 reflects a clear preference for U.S. assets.
Geostrategy: The Venezuela Pivot and Risk Primacy
Geopolitics took center stage on January 3 with Operation Absolute Resolve in Venezuela. The capture of President Maduro signaled a shift in Washington’s geostrategy. Analysts initially feared a "safe-haven" stampede. However, the currency markets remained remarkably stable.
Traders now view this move as a reassertion of the Monroe Doctrine. The U.S. is securing its own hemisphere while becoming more transactional elsewhere. This strategic focus reduces long-term energy risks for the American economy. Consequently, the dollar’s "exorbitant privilege" remains unchallenged by recent kinetic actions in Latin America.
Macroeconomics: The Growth Divergence Gap
The underlying economics favor a stronger dollar throughout early 2026. The U.S. economy projects a 1.9% growth rate. Meanwhile, the Eurozone stumbles at just 1.1% [/b. This divergence stems from sticky inflation and differing fiscal capacities.
While the Federal Reserve maintains a cautious stance, the European Central Bank (ECB) faces stagnation. High energy costs continue to haunt German industry. Markets now price in fewer U.S. rate cuts than previously expected. This interest rate differential acts as a gravity well for global capital.
Leadership: The Fed’s High-Stakes Regime Change
Management and leadership at the Federal Reserve are currently under the microscope. Jerome Powell’s term concludes in May 2026. President Trump has signaled a preference for a more "pro-growth" successor. Speculation surrounds candidates like Kevin Hassett or Christopher Waller.
A leadership shift toward looser policy could theoretically weaken the dollar. However, the market currently bets on institutional continuity. Investors trust the Fed’s mandate to protect the dollar’s purchasing power. This "credibility premium" keeps the greenback resilient against a fragmented European political landscape.
High-Tech and Patents: The Innovation Deficit
A deep-dive patent analysis reveals a widening chasm between the two regions. The U.S. leads in high-tech sectors like AI and quantum computing. European innovation remains fragmented across national borders. In 2025, the U.S. outpaced the EU in AI-related patent filings by nearly 3 to 1 .
* R&D Spend: The U.S. invests roughly 3.5% of GDP into R&D.
* Venture Capital: U.S. fund sizes dwarf European counterparts by double.
* Business Model: The EU’s "precautionary principle" slows high-tech adoption.
Europe’s "middle-technology trap" limits its productivity growth. Without a unified capital markets union, the Eurozone cannot fund the next technological revolution. This structural weakness creates a long-term bearish outlook for the euro.
Technology and Cyber: Securing the Digital Dollar
Cybersecurity and financial technology also play a pivotal role. The U.S. is rapidly integrating AI into its demand forecasting and logistics. These "high-tech" efficiencies lower the cost of doing business. Furthermore, the U.S. leads in developing secure, digital-first financial architectures.
European firms struggle with high regulatory hurdles like the AI Act. While these laws protect privacy, they often stifle rapid scientific advancement. Consequently, global investors view the U.S. as a safer, more innovative harbor for digital capital.
Market Outlook: January 7 and Beyond
All eyes now turn to the mingling U.S. manufacturing data and non-farm payrolls. These indicators will confirm if the U.S. "A-pillars" of growth remain intact. If data stays firm, the EUR/USD may test support at $1.1650 . The dollar's dominance is not just a trend; it is a structural reality.

COPPER - The Metal No One Is Talking About… YetCopper just did something important, it broke above its previous all-time high. That alone puts it back on the radar from a macro perspective.
Structurally, the trend is clearly bullish. Price is respecting the rising trendline, and what we are seeing now is a normal post-breakout reaction, not weakness.
The plan from here is simple: 👇
i will be watching the intersection of the rising trendline and the prior structure zone. That confluence is where risk becomes defined and where trend-following longs make the most sense.
As long as price holds above structure and respects the trendline, the bullish thesis remains intact.
📊 Always follow your trading plan regarding entry, risk management, and trade management.
Good luck! 🍀
All Strategies Are Good; If Managed Properly!
~Richard Nasr

USD/INR at 90: Can the RBI Halt the Rupee’s Slide in 2026?The Indian rupee stands at a historic crossroads. As 2025 concludes, the currency hovers precariously near the 90.00 psychological barrier. While the Reserve Bank of India (RBI) maintains a defensive posture, a combination of record capital flight and geopolitical friction creates a challenging environment for the year ahead.
Geopolitics and the Tariff Storm
Trade tensions between Washington and New Delhi have intensified throughout 2025. The re-imposition of tariffs climbing as high as 50% on key Indian exports has strained the bilateral trade balance. Major sectors like jewellery, automotive parts, and electronics now face shrinking margins and reduced global demand.
This protectionist environment discourages foreign direct investment (FDI). Investors remain cautious as they await a potential trade deal. Without a diplomatic breakthrough, the "tariff overhang" will continue to pressure the rupee toward weaker levels in early 2026.
Record Capital Flight: The FII Exodus
The year 2025 marked a historic turning point for Indian capital markets. Foreign Institutional Investors (FIIs) pulled a record ₹1.58 lakh crore ($18 billion) from Indian equities. High domestic valuations and rising US Treasury yields prompted this massive rotation of capital back toward developed markets.
While Domestic Institutional Investors (DIIs) provided a cushion through steady SIP inflows, they could not fully offset the currency impact. This exodus has effectively removed a primary source of dollar supply, leaving the rupee vulnerable to every spike in global volatility.
Management & Leadership: The RBI’s Defensive Play
The Reserve Bank of India has adopted a "controlled depreciation" strategy. RBI leadership intervened frequently near the 90.00 mark, selling dollars through state-run banks to prevent a chaotic collapse. This proactive management provides the market with a "tacit floor."
Traders now view the 90 level as a critical pivot point. The central bank's leadership must balance currency stability with the need to keep Indian exports competitive. If the RBI softens its stance, the path of least resistance leads toward 91.50 by mid-2026.
Macroeconomics: A Tale of Two Central Banks
The Federal Reserve and the RBI are navigating diverging paths. In December 2025, the Fed delivered its third consecutive interest rate cut to 3.5%–3.75%. However, hawkish language in the Fed minutes suggests a slower pace of cuts for 2026.
In contrast, the RBI’s recent 25 basis point cut aims to boost domestic growth (forecast at 7.3% for FY26). This narrowing interest rate differential often makes the rupee less attractive for "carry trades," further supporting a bullish USD/INR trend.
Indicator Current Status Impact on Rupee
Oil Prices $61.70 (Brent) Positive (Lower import costs)
US Tariffs Up to 50% Negative (Export pressure)
FPI Flows Record Outflow Negative (Dollar scarcity)
GDP Growth 7.3% (Projected) Positive (Long-term resilience)
Technology and the Future of Trade
Innovation in "Cyber-traceability" and blockchain-based supply chains is becoming vital for Indian exporters. These technologies help firms bypass some regulatory hurdles by proving compliance with global standards.
Patent analysis reveals that Indian firms are rapidly filing for high-tech manufacturing processes. This shift toward high-value, patent-protected exports could eventually reduce India's structural trade deficit. However, the currency benefits of these innovations will take years to materialise.
2026 Prediction: Consolidation Before Clarity
The USD/INR pair will likely consolidate between 89.50 and 91.00 in the first quarter of 2026. The "invisible hand" of the RBI will prevent a vertical spike, but the lack of foreign inflows remains a major hurdle.
Smart traders should watch for the signing of a US-India trade deal. A successful agreement would act as the ultimate "Buy" signal for the rupee, potentially triggering a sharp recovery toward the 88.00 handle.

Gold in 2026: Will the Bull Market Defy Gravity?Gold emerged as the premier asset of 2025, delivering a remarkable year-to-date gain of roughly 60% . The precious metal shattered multiple records, peaking near $4,550 per ounce in December. While the S&P 500 advanced approximately 17%, gold decisively outperformed almost every major asset class. As we enter 2026, the market must decide if this powerful uptrend still has "fuel in the tank."
Fed Policy and the Opportunity Cost Shift
Federal Reserve policy remains the primary engine for gold’s momentum. After reigniting the easing cycle in late 2024, markets now price in approximately * 60 basis points of additional cuts for 2026. Lower interest rates reduce the opportunity cost of holding non-yielding bullion, making gold more attractive to institutional investors.
The potential appointment of a more dovish Fed chair in mid-2026 could further accelerate this trend. President Trump has publicly pressured for more forceful rate reductions to support economic expansion. If the Fed adopts a markedly more accommodative tone, gold could easily target the $5,000 psychological barrier .
Geopolitical Flashpoints and Tariff Warfare
Military conflicts in Ukraine, Gaza, and the Middle East continue to drive persistent safe-haven inflows. However, the "Trump Liberation Day" announcement of sweeping global tariffs has become an even larger catalyst for demand. Investors increasingly utilize gold as a hedge against the resulting trade-war uncertainty and currency volatility.
Central Banks and the De-Dollarization Narrative
Central banks are fundamentally altering the global reserve landscape. Emerging market institutions, led by China and India, are stockpiling gold to reduce reliance on the U.S. dollar. In 2025, official sector demand reached record-breaking levels, with quarterly totals often exceeding 900 tonnes .
While the pace of accumulation may moderate slightly in 2026, the structural trend remains firmly bullish. Central banks now treat gold as strategic collateral in an increasingly fragmented global financial system.
The Gold-to-Silver Ratio Compression
While gold’s performance was exceptional, it lagged behind the explosive gains in silver, which surged over 150% in 2025 . This dynamic caused the gold-to-silver ratio to tumble toward the 70 mark. Historically, such a sharp compression often precedes a renewed acceleration in the gold rally as the ratio reverts toward the mean.
Risks: Jewelry Demand and Regulatory Headwinds
Despite robust investment interest, record-high prices are crushing physical jewelry demand. Worldwide jewelry consumption saw a 31% year-on-year decline in Q3 2025 as consumers balked at elevated costs.
Additionally, new regulatory measures could dampen local demand in key markets. China’s decision to cut tax exemptions on certain gold holdings might exert downward pressure on prices in early 2026. If the Fed implements fewer rate cuts than anticipated due to a resilient U.S. economy, the bull run could enter a consolidation phase during the second half of the year.
Strategic Outlook for 2026
Technical analysts target the $5,000 to $5,200 range for gold in the first half of 2026. This target aligns with the 261.8% Fibonacci extension of recent corrections. While the path will not be linear, the convergence of geopolitical risk, debt expansion, and accommodative monetary policy justifies a higher equilibrium price.

Risk-Off Regime: 90.35k Reclaim or 84k Buy Zone__________________________________________________________________________________
Market Overview
__________________________________________________________________________________
Bitcoin is pressing into a stacked higher-timeframe lid while intraday momentum attempts to push through. Thin holiday liquidity and soft ETF flows keep upside persistence fragile.
Momentum: Cautiously bearish into resistance, with intraday upticks failing so far to flip the 12H/1D downtrend.
Key levels:
- Resistances (HTF): 90,350 (12H/720 Pivot High gate), 93,558–94,635 (4H–1D supply band).
- Supports (MTF): 89,400–89,600 (2H/4H pivot zone), 87,614 (240 Pivot Low), 83,700–84,200 (cross‑TF demand cluster).
Volumes: Overall normal, with a very high spike recorded on 15m during the last push, treat spikes as amplifiers near 90,350.
Multi-timeframe signals: 1D/12H/6H/4H trends point down, while 2H/1H/30m/15m are up into resistance. The gate at 90,350 is the inflection to resolve this conflict.
Harvest zones: 84,000 (Cluster A) / 83,700–84,200 (Cluster B). Ideal dip‑buy zones for inverse pyramiding only on ≥2H reversal.
Risk On / Risk Off Indicator context: Neutral sell bias, confirming the cautious momentum and arguing for patience until a clean reclaim or a quality dip‑reversal.
__________________________________________________________________________________
Trading Playbook
__________________________________________________________________________________
Trend pressure remains down on HTF, so we adopt a neutral sell stance until a decisive reclaim flips the board.
Global bias: Neutral sell while price is below 90,350, invalidation on a 12H/1D close and hold above 90,350 with follow‑through.
Opportunities:
- Tactical sell: Fade rejection at 90,350 into 93,558–94,635 with red volume confirmation.
- Breakout buy: If 90,350 is reclaimed on 12H with a successful retest, target 93,558–94,635.
- Dip buy: Only at 83,700–84,200 on a ≥2H reversal structure, reduced size against HTF downtrend.
Risk zones / invalidations: A daily close above 94,635 would invalidate tactical shorts and open the upper band. A sustained close below 83,900 would invalidate dip‑longs at the cluster.
Macro catalysts (Twitter, Perplexity, news):
- US spot ETF flows are negative on the 7‑day average, which undermines upside persistence.
- Thin holiday liquidity can magnify both rejections and breakouts at 90,350.
- Hard‑asset strength and energy tensions add risk, but do not yet supply crypto demand.
Harvest Plan (Inverse Pyramid):
- Palier 1 (12.5%): 84,000 (Cluster A) + reversal ≥2H → entry
- Palier 2 (+12.5%): 80,600–79,000 (-4/-6% below Palier 1)
- TP: 50% at +12–18% from PMP → recycle cash
- Runner: hold if break & hold first R HTF at 90,350
- Invalidation: < HTF Pivot Low 83,900 or 96h no momentum
- Hedge (1x): Short first R HTF on rejection + bearish trend → neutralize below R
__________________________________________________________________________________
Multi-Timeframe Insights
__________________________________________________________________________________
Across timeframes the structure is mixed, with lower timeframes attempting a push into a firm higher‑timeframe supply shelf.
1D/12H/6H/4H: Downtrend into resistance, price is testing 90,350 with the next HTF supply at 93,558–94,635. Failure at the gate risks a slide back toward 89,400–89,600 then 87,614.
2H/1H/30m/15m: Short‑term uptrend pressing the 90,350 gate, but very high 15m volume and risk‑off regime argue for confirmation before chasing. A clean reclaim would unlock the 93–95k band.
Major confluence: The 83,700–84,200 demand cluster aligns with 720/D pivot lows, making it the highest‑quality dip zone if revisited, while 90,350 remains the decisive upside gate.
__________________________________________________________________________________
Macro & On-Chain Drivers
__________________________________________________________________________________
Macro is mixed to risk‑off while ETF flows soften, which tempers bullish follow‑through and favors a trade‑the‑range approach.
Macro events: Hard assets are strong, oil is supported by geopolitics, and US futures are firm with VIX lower. Yet crypto‑specific demand is muted and holiday liquidity is thin.
External Macro Analysis: The Risk On / Risk Off Indicator sits in bear mode with confluence mixed. Credit stress and weak speculative appetite contradict sustained crypto beta, despite early‑cycle hints in semis and small caps.
Bitcoin analysis: Price is oscillating around the high‑80ks to ~90k. Institutional spot ETF flows are negative on a 7‑day basis, which aligns with fading moves into 90,350–94,635 unless fresh demand appears.
On-chain data: Realized cap growth has stalled and inflows are softer, derivatives remain warm, and dominance signals are mixed. This supports range behavior rather than trending.
Expected impact: Macro and on‑chain lean toward neutral‑to‑cautious, which supports the technical bias to fade into resistance and buy only confirmed dips at the 84k cluster.
__________________________________________________________________________________
Key Takeaways
__________________________________________________________________________________
BTC is range‑bound into a higher‑timeframe lid with macro flows unsupportive. The broader trend is cautiously bearish, the most relevant setup is to fade 90,350 unless reclaimed, and the key macro factor is negative spot ETF flow momentum. Stay tactical, harvest volatility, and respect confirmations like a disciplined raid leader in a tough zone.

SOL & XRP - Decision Time at Weekly Structure!⚔️Both SOL and XRP are now sitting at a major weekly support zone , clearly marked in blue. This is not just a random level, it’s a key structural area that has defined direction in the past.
From here, the market is at a crossroads: 🔁
📉If this weekly support breaks , it would signal a loss of structure, opening the door for further long-term bearish continuation toward the green demand zone below.
📈On the other hand, for bulls to regain control, price must prove strength. That confirmation comes only with a break above the last major daily high, marked in red. Without that, any bounce remains corrective, not a trend reversal.
In short:
Structure is being tested.
Reaction matters more than prediction.
Do you think this support holds, or are we heading deeper into demand? 📊
⚠️ Disclaimer: This is not financial advice. Always do your own research and manage risk properly.
📚 Stick to your trading plan regarding entries, risk, and management.
Good luck! 🍀
All Strategies Are Good; If Managed Properly!
~Richard Nasr

ES Weekly Outlook: Can the Santa Rally Carry ES Back to All TimeMacro Backdrop and Sentiment Over the Past Month
Over the past month, the macro narrative for ES has been defined by a gradual shift from momentum driven optimism to a more cautious and selective risk environment. Coming out of October, equities were supported by easing financial conditions, strong earnings from mega cap technology, and continued enthusiasm around productivity gains tied to AI investment. That optimism pushed ES to fresh all time highs by the end of October.
As November progressed, sentiment became more balanced. Market participants began to reassess forward growth expectations, the path of monetary policy, and the sustainability of stretched valuations. Rather than a sharp risk off move, the tape transitioned into a rotational regime where participants became increasingly responsive around well defined value areas.
This shift has resulted in slower tempo, overlapping value, and greater sensitivity to technical references rather than headline driven trend continuation. The market has increasingly rewarded patience, context, and execution around key levels as opposed to chasing momentum.
What the Market has done
• From the all time highs made at the end of October, the market rotated lower toward the 6605 area, which aligned with daily support. Responsive buyers entered aggressively at this level and successfully defended the level.
• Following the responsive buying, price auctioned higher toward the 6975 area, which aligned with daily resistance and the 5 November weekly value area high, where sellers responded and capped further upside.
• During the past week, the market broke below the first two weeks of December’s range and the composite value area, signaling a short term loss of acceptance at higher prices.
• Price then auctioned lower toward the 6780 area, which aligned with the 24 November weekly VPOC, where buyers once again responded and defended the level.
• Responsive buying from 6780 drove the price back higher toward the 6885 area, which sits near the 12 December weekly settlement and the two week composite value area low, reinforcing the broader balanced structure.
What to expect in the coming week
The key reference to frame the coming week is the previous week’s settlement at 6888.50.
Bullish scenario
• If the market can accept above 6888.50, expect an auction higher toward the 6970 area, which aligns with daily resistance, the 5 November weekly value area high, and the weekly 0.5 standard deviation high.
• Sellers are expected to respond in the 6970 area and attempt to rotate price back down
• If sellers fail to defend this area, continuation higher toward 7012 becomes likely, which aligns with all time highs and the weekly 1 standard deviation high.
Bearish scenario
• If the market is unable to accept above 6888.50, expect a move lower toward the 6827 area, which aligns with the previous week’s value area low and the weekly 0.5 standard deviation low.
• Buyers are expected to respond at 6827 to bid prices back up through value.
• If buyers fail to hold 6827, expect a continuation lower toward the 6780 area, which aligns with the previous week’s low, the 24 November weekly VPOC, and the weekly 1 standard deviation low.
Neutral scenario
• If the market is unable to extend meaningfully beyond 6970 on the upside or 6827 on the downside, expect the market to remain balanced and rotational.
• In this scenario, value is likely to continue shifting modestly higher as the market awaits the next catalyst.
Conclusion
ES remains in a broader balance regime where responsive trade dominates and initiative activity has struggled to sustain follow through. Until the market can show clear acceptance above resistance or below support, patience and level based execution remain critical. The previous week’s settlement at 6888.50 will act as the primary decision point this week that helps determine whether the market seeks higher prices, deeper balance, or continued two way trade. If seasonal Santa rally dynamics come into play, they may act as the catalyst that allows the market to regain initiative strength and auction back toward all time highs.
What is your take on ES? We would love to hear your view on it. Please give us your comments and give this a boost so that more traders in the community can participate. Thank you.
Disclaimer: This is not financial advice. Analysis is for educational purposes only; trade your own plan and manage risk.

USD/JPY: The Carry Trade's High-Tech EvolutionThe Japanese yen is capitulating, trading near historic lows against major crosses despite the Bank of Japan’s (BOJ) historic pivot. With the USD/JPY pair hovering near 157.40 and threatening a breakout above 158.00, the market has delivered a decisive verdict: policy normalization in Japan is too slow to counter the magnetic pull of U.S. capital markets. This divergence is no longer just about interest rate spreads; it is driven by a structural shift in global capital flows, heavily influenced by artificial intelligence (AI) and geopolitical realignment.
Macroeconomics: The Yield Curve Trap
The BOJ’s decision to raise the policy rate to 0.75%—a three-decade peak—failed to anchor the currency. While the 10-year JGB yield surged past 2% for the first time since 1999, the yen collapsed. This creates a dangerous "yield curve trap" where rising domestic borrowing costs punish local balance sheets without generating enough yield to attract foreign capital.
Governor Kazuo Ueda’s adherence to "data-dependent" rhetoric rather than explicit forward guidance has effectively neutralized the market’s fear of tightening. Traders now view the BOJ as reactive, not proactive. Until the central bank signals a terminal rate that rivals Western peers, the carry trade remains profitable, funded by cheap yen to buy high-yielding dollar assets.
Industry Trends: The AI Capital Drain
A new driver, the "AI Trade," has exacerbated the yen's weakness. Japanese institutional and retail investors are aggressively selling yen to purchase U.S. technology stocks. The logic is simple: while Japan manufactures excellent semiconductor materials, the massive value capture in AI software and data center infrastructure occurs in American equity markets.
This structural outflow differs from traditional carry trades. It is not just about seeking higher bond yields; it is a chase for equity growth that the Tokyo Stock Exchange currently cannot match. As long as U.S. tech giants dominate the generative AI landscape, capital flight from Tokyo to Silicon Valley will pressure the yen.
Geopolitics and Geostrategy
Japan’s geopolitical position actively undermines its currency defense. As a critical node in the U.S.-led "Chip 4" alliance, Japan has committed to reshoring semiconductor supply chains to insulate against Chinese aggression. However, this reindustrialization requires massive imports of energy and raw materials, priced in dollars.
Consequently, Japan runs a persistent trade deficit in the very commodities needed to rebuild its defense and industrial base. This "security premium" forces continuous yen selling to fund national security objectives, neutralizing the impact of Ministry of Finance intervention threats.
Cyber and Technology: The Digital Deficit
The financial sector faces a new "digital deficit." Corporate risk assessments for 2025 identify cyber attacks as a primary threat. Japanese financial institutions are ramping up spending on U.S.-made cybersecurity infrastructure to comply with new active cyberdefense laws. This necessity drives further yen selling to pay for American software licenses and cloud security services.
Furthermore, the delay in a fully realized "Digital Yen" (CBDC) has left Japan reliant on existing SWIFT infrastructure, limiting its ability to bypass dollar-denominated settlement rails.
Patent Analysis and Innovation
Japan remains an intellectual property powerhouse, particularly in hardware. Patent filings in 2025 grew, led by innovations in electrical machinery and measurement instruments. However, a "Patent-Value Mismatch" exists. Japanese firms own the patents for critical robotic components and silicon wafers, but U.S. firms own the platforms that integrate them.
This commercialization gap means the economic rent from Japanese innovation often accrues in dollars, not yen. Japanese multinationals effectively act as high-end component suppliers to the U.S. tech ecosystem, reinforcing the dollar’s dominance.
Management and Leadership
The BOJ’s communication strategy remains its weakest link. Governor Ueda’s refusal to adopt a hawkish tone during press conferences contradicts the urgency of the bond market. This leadership gap emboldens speculators who interpret "caution" as "paralysis." Effective central banking requires managing expectations; the current leadership has allowed the market to dictate the narrative, turning potential policy wins into currency routs.
Conclusion
The USD/JPY rally is a symptom of a deeper imbalance. It reflects a world where capital seeks the growth of the U.S. AI sector over the stability of Japanese bonds. Unless the BOJ disrupts this dynamic with shock-and-awe tightening—or the U.S. economy falters—the path of least resistance remains higher. The 158.00 level is not a ceiling; it is the next threshold in a fundamental repricing of Japan’s role in the global economy.

BTC Playbook: Sell the Rip, Buy the Confirmed Dip__________________________________________________________________________________
Market Overview
__________________________________________________________________________________
Bitcoin remains range-bound with a downside tilt as sellers cap every push into the 89.5–90.0k band while buyers defend the 85.9k shelf. Momentum is cautious, microstructure and levels are driving outcomes as macro catalysts stay light.
Momentum: Bearish bias within a range, rallies are being faded below 90k and demand only sticks on clean reversals at 85.9k.
Key levels:
- Resistances (12H–1D): 89,500–90,000, then 94,600 (Weekly pivot high).
- Supports (4H–1D): 85,900, then 84,400.
Volumes: Normal across intraday and HTF, no extreme prints to force a regime shift.
Multi-timeframe signals: 1D/12H/6H trend down with repeated lower highs into 89.5–90.0k. LTFs compress under 90k with demand wicks near 85.9k, daily ISPD only offers tactical buy context at supports if a proper reversal prints.
Harvest zones: 85,900 (Cluster A) / 80,700–82,500 (Cluster B). Ideal dip-buy areas for inverse pyramiding, only on confirmed ≥2H reversals.
Risk On / Risk Off Indicator context: Neutral Sell, which aligns with the sell-the-rip tone under 90k and advises patience on longs until HTF conditions improve.
__________________________________________________________________________________
Trading Playbook
__________________________________________________________________________________
The dominant structure is a corrective range with bearish HTF filters, so favor patience and fade strength into resistance until acceptance above 90k changes the tone.
Global bias: Neutral Sell while price holds below 90,000, invalidation of the short fade bias on a daily close above 90,000.
Opportunities:
- Tactical sell: Fade 89,500–90,000 rejections with stops above the band, first targets 88,000 then 86,000.
- Tactical buy: Only on strong 2H–12H reversal at 85,900, partials toward 87,900 then 89,300–90,000.
- Breakout buy: Daily acceptance above 90,000 opens 94,600, enter on retest if confirmed.
Risk zones / invalidations: A daily close below 85,900 unlocks 84,400 and risks deeper distribution. A daily close above 90,000 invalidates near-term short fades and shifts focus to 94,600.
Macro catalysts: Japan 10Y above 2 percent raises cross-asset vol risk and carry stress. Gold’s surge underscores a cautionary risk tone. US spot ETF 7-day net outflows are a mild headwind that can cap upside.
Harvest Plan (Inverse Pyramid):
- Palier 1 (12.5%): 85,900 (Cluster A) + reversal ≥2H → entry
- Palier 2 (+12.5%): 80,700–82,500 (-4/-6% below Palier 1) → reinforcement
- TP: 50% at +12–18% from PMP → recycle cash
- Runner: hold if break & hold first R HTF
- Invalidation: < HTF Pivot Low or 96h no momentum
- Hedge (1x): Short first R HTF on rejection + bearish trend → neutralize below R
__________________________________________________________________________________
Multi-Timeframe Insights
__________________________________________________________________________________
Across HTFs the path of least resistance is down, while LTFs compress just below 90k and try to defend 85.9k.
1D/12H/6H: Downtrend filter persists with lower highs into 89.5–90.0k and a cap extension at 94,600. Acceptance back above 90,000 is needed to ease pressure toward the weekly pivot.
4H/2H: Compression under 90k with demand wicks at 85.9k, long attempts require a clear bullish reversal structure, otherwise sell rejections at 89.5–90.0k.
1H/30m/15m: Intraday squeezes stall below 89.5–90.0k and liquidity sits below 88k and near 86k, which favors tactical shorts until HTF flips or 90k is reclaimed.
__________________________________________________________________________________
Macro & On-Chain Drivers
__________________________________________________________________________________
Macro crosscurrents lean cautious, which can limit impulsive upside until flows improve and risk appetite broadens.
Macro events: Japan 10Y above 2 percent signals potential carry pressure and volatility. Gold’s strong run reflects a hedge bid. US spot ETF flows have a negative 7-day average and a down day, a mild headwind for spot.
External Macro Analysis: The Risk On / Risk Off Indicator sits in a bearish regime with credit stress confirmed, while small-caps and semis are conflicted, a late-cycle mix that supports the Neutral Sell technical bias.
Bitcoin analysis: Spot activity clusters in the mid-high 80ks, OI is elevated, and overhead supply around 90k–95k keeps a sell cloud. Acceptance above 90k would be the first step toward 94.6k.
On-chain data: Mixed risk tone with selective demand and an options skew that favors downside protection near term, reinforcing respect for supports and the need for confirmation on longs.
Expected impact: The macro and flow backdrop supports fading bounces under 90k and waiting for acceptance above resistance to re-risk long with better odds.
__________________________________________________________________________________
Key Takeaways
__________________________________________________________________________________
BTC is coiling in a corrective range with a bearish tilt under 90k and buyers defending 85.9k.
The trend is neutral-to-bearish until 90k is reclaimed. The most relevant setup is fading 89.5–90.0k with targets at 88.0k and 86.0k, while only buying 85.9k on confirmed reversals. Macro tone is cautious with ETF outflows and Japan yields above 2 percent adding risk. Stay tactical, respect invalidations, and let 86–90k resolve before sizing up.

Bitcoin Playbook: Grind the Range, Harvest the Dip__________________________________________________________________________________
Market Overview
__________________________________________________________________________________
Bitcoin holds a choppy range after rebounding off mid-range support, with upside still capped by a well-defined HTF ceiling. Event risk is elevated, so liquidity pockets and confirmation matter more than speed.
Momentum: Neutral to bearish tilt within a broad 83,900–94,600 range, capped below 90,350 as intraday trends remain heavy while 1D attempts to stabilize.
Key levels:
- Resistances (HTF): 88,900 (1H supply), 90,350 (240 Pivot High), 94,635 (D Pivot High).
- Supports (HTF): 85,177 (720 Pivot Low), 84,100–84,260 (ISPD multi‑TF floor), 83,871 (D Pivot Low).
Volumes: Mostly normal across TFs, with moderate 2H spikes acting as an amplifier near resistance.
Multi-timeframe signals: 12H/6H trend down while 1D edges up, arguing for fades into 88,900–90,350 and patience for dip-buys only at the strongest floor confluence near 84.1–84.26k.
Harvest zones: 84,200 (Cluster A) / 79,100–80,800 (Cluster B). Cluster A is the ideal dip-buy for inverse pyramiding, Cluster B is a deeper core zone built from 2H/12H floors if volatility expands.
Risk On / Risk Off Indicator context: NEUTRE VENTE, confirms the risk-off tone and raises the bar for breakouts while favoring tactical shorts into HTF resistance.
__________________________________________________________________________________
Trading Playbook
__________________________________________________________________________________
The dominant structure is range with a defensive bias, so trade the edges and demand confirmation.
Global bias: Neutral sell below 90,350, key invalidation for downside bias on a sustained daily close above 90,800.
Opportunities:
- Buy the dip only at 84,260–84,100 with a confirmed ≥2H bullish reversal and tight follow‑through rules.
- Breakout buy on clean break and hold above 90,350 with volume, then trail toward 91,800 → 94,600.
- Tactical sell on rejection at 88,900–90,350 with rising volume, add on failed retest.
Risk zones / invalidations: A daily close above 90,800 would invalidate the short‑fade plan, a sustained close below 83,700 would invalidate dip-longs at the cluster.
Macro catalysts (Twitter, Perplexity, news): CPI today, BoJ decision tomorrow, and a very large options expiry window raise volatility risk and can flip range edges into breakout traps or accelerants.
Harvest Plan (Inverse Pyramid):
- Palier 1 (12.5%): 84,200 (Cluster A) + reversal ≥2H → entry
- Palier 2 (+12.5%): 80,800–79,100 (-4/-6% below Palier 1) (Cluster B included) → reinforcement
- TP: 50% at +12–18% from PMP → recycle cash
- Runner: hold if break & hold first R HTF
- Invalidation: < HTF Pivot Low or 96h no momentum
- Hedge (1x): Short first R HTF on rejection + bearish trend → neutralize below R
__________________________________________________________________________________
Multi-Timeframe Insights
__________________________________________________________________________________
Timeframes are mixed, with daily stabilization but intraday pressure, which supports a range-harvesting stance.
12H/6H: Downtrend under the EMA cloud with lower highs, favoring fades at 88,900–90,350 and keeping risk tight into event risk.
4H/2H/1H: Upswings are stalling into the HTF ceiling, requiring volume confirmation for any breakout above 90,350, otherwise expect mean‑reversion to 87,800 → 85,200.
1D: Up attempt but capped by 90,350 and 94,635, best long-risk spots align with the 84.1–84.26k multi‑TF ISPD floor just above the 83,871 daily pivot low.
__________________________________________________________________________________
Macro & On-Chain Drivers
__________________________________________________________________________________
Macro is in the driver’s seat over the next 24–48 hours, and the risk regime is defensive even as ETF flows help at strong floors.
Macro events: CPI today sets DXY and rates tone, BoJ tomorrow can shock global beta, and a very large options expiry window heightens short-term vol. Equities are wobbling, Gold is firm, and oil is bid into geopolitics.
External Macro Analysis: The Risk On / Risk Off Indicator shows a defensive regime with late-cycle tones, credit stress signals align bear, while small caps and semis are conflicted. This supports a cautious technical bias and argues for confirmation on breakouts.
Bitcoin analysis: Spot ETF net inflows are supportive on dips, whale outflows reduce on-exchange supply, yet the market remains rangebound and low conviction until the 90,350 cap is reclaimed.
On-chain data: Mixed and fragile, with defensive posture, soft volumes, and elevated skew consistent with range or corrective risk while below key HTF bands.
Expected impact: Macro risk is likely to reinforce a neutral-sell bias, favoring dip-buys at Cluster A with confirmation and short-fades at resistance until a clean breakout resets the regime.
__________________________________________________________________________________
Key Takeaways
__________________________________________________________________________________
BTC is rangebound with a cautious, event-driven tone that demands disciplined execution at high-confluence zones.
The broader trend is neutral with a bearish tilt while below 90,350. The most relevant setup is buying confirmed reversals at 84.1–84.26k or fading 88,900–90,350 rejections. The key macro factor is the CPI → BoJ → options expiry trifecta that can force expansion. Stay patient, think Tarkov, and only take the fight where you control the angles.

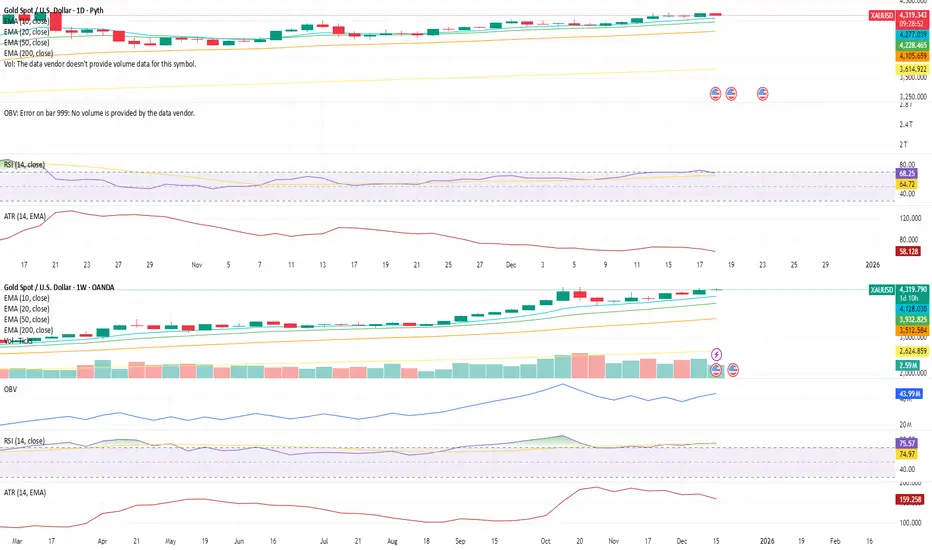
XAUUSD Structure Update — Daily & Weekly View1D Chart (Daily)
Gold continues to trade above all key EMAs, with the 10 EMA leading and holding steady, reinforcing short-term structural support rather than impulsive momentum.
RSI is taking a brief breather but remains elevated near 68, suggesting momentum is cooling in a controlled manner rather than breaking down.
ATR remains flat, indicating volatility is contained and price is progressing in an orderly fashion rather than expanding aggressively.
Due to the nature of spot gold volume, OBV on the daily timeframe is less informative, and participation signals are better assessed from the higher-timeframe structure.
Overall, the daily chart reflects consolidation within strength, not distribution.
1W Chart (Weekly)
The weekly structure continues to support the broader bullish framework.
Price remains above all major EMAs, with the 10 and 20 EMA rising steadily — not steep, but clearly directional — reinforcing sustainable trend progression rather than late-stage acceleration.
OBV trends higher on the weekly, signaling healthy participation and accumulation beneath the surface.
RSI holds near 75, elevated yet stable, indicating persistent strength without signs of exhaustion.
ATR remains flat, confirming that volatility remains controlled even as price holds elevated levels.
The weekly structure confirms that gold remains constructive and supported, with no technical evidence of breakdown.
⭐ Final Clarity Note ⭐
In structurally strong markets, consolidation often appears before continuation, not after failure.
When price holds above trend EMAs, volatility remains compressed, and participation persists on higher timeframes, it typically reflects positioning rather than speculation.
Gold’s current structure suggests the market is digesting gains, not abandoning them.
USDJPY - Correction or Reload Before the Next Push?📈USDJPY remains structurally bullish on the higher time frame . The market respected the rising blue trendline, broke above the previous support zone, and shifted that zone into new demand.
🏹After the impulsive move higher , price is now going through a controlled correction, drifting back toward a key area of confluence:
the rising trendline + former support zone.
❗️This is exactly where trend traders pay attention . As long as price holds above this intersection, the plan is simple: look for trend-following long setups, aiming for continuation in the direction of the dominant trend.
A clean bullish reaction here keeps the structure intact. Only a decisive break below would put this bullish scenario into question.
Is this just a pause… or the fuel for the next leg higher? 🤔
⚠️ Disclaimer: This is not financial advice. Always do your own research and manage risk properly.
📚 Stick to your trading plan regarding entries, risk, and management.
Good luck! 🍀
All Strategies Are Good; If Managed Properly!
~Richard Nasr

BTC Playbook: Harvest the Dip, Fade 87.8–89.5kMarket Overview
__________________________________________________________________________________
Bitcoin continues to drift lower beneath reclaimed HTF resistances while defending a tight 84k demand pocket; sellers keep fading bounces as we head into U.S. data with a defensive macro tone.
Momentum: Bearish-to-neutral — rallies are sold under 87,784–89,513 while 83.6–84.2k bids keep price supported.
Key levels:
- Resistances (HTF): 87,700–87,900 (720R); 89,300–89,600 (240R); 93,600–94,600 (HTF highs).
- Supports (HTF): 83,600–84,200 (1H/1D cluster + D Pivot 83,871); 79,300–80,000 (2H/12H floors).
Volumes: Normal on HTF; moderate on 1H/2H during re-tests of 87,784 and 84k.
Multi-timeframe signals: 12H/6H/4H/2H/1H trend Down; 1D shows a tactical BUY context at 84k — mixed stack that favors shorting into resistance while respecting the 84k cluster.
Harvest zones: 83,900 (Cluster A) / 79,300–80,000 (Cluster B) — ideal dip-buy areas for inverse pyramiding if a clear reversal prints.
Risk On / Risk Off Indicator context: Neutral sell — confirms the defensive regime and supports fading bounces unless 84k proves strong with breadth improvement.
__________________________________________________________________________________
Trading Playbook
__________________________________________________________________________________
Short-term trend is pressured; adopt a defensive stance: fade rallies into 87,784/89,513, consider tactical longs only at 84k with confirmation.
Global bias: Neutral sell while below 87,784–89,513; bearish bias invalidated on a strong daily close above 89,513.
Opportunities:
- Buy (tactical dip): 83,600–84,200 cluster only with a confirmed 30m/1H reversal; targets 86,000 → 87,784.
- Breakout buy: 12H close above 89,513 opens 93,600–94,600.
- Tactical sell: Fade 87,700–87,900 or 89,300–89,600 rejections with weakening momentum.
Risk zones / invalidations:
- Break below 83,871 would invalidate the dip-bounce idea and expose 79,300–80,000.
- 12H/1D close above 89,513 invalidates the short-fade bias and hands control to buyers toward 93.6–94.6k.
Macro catalysts (Twitter, Perplexity, news):
- Repo usage uptick and soft ETF flows support a risk-off tone — rallies face supply unless data turns.
- U.S. jobs release is the near-term volatility trigger; soft prints help bounces into 87,784, hot prints risk 84k breakdown.
- External dashboard: tech regime unfavorable; credit stress aligned with a defensive stance.
Harvest Plan (Inverse Pyramid):
- Palier 1 (12.5%): 83,900 (Cluster A) + reversal ≥2H → entry
- Palier 2 (+12.5%): 78,900–80,500 (-4/-6% below Palier 1) (Cluster B included) → reinforcement
- TP: 50% at +12–18% from PMP → recycle cash
- Runner: hold if break & hold first R HTF (87,784)
- Invalidation: < 83,900 or 96h no momentum
- Hedge (1x): Short first R HTF on rejection (87,784) + bearish trend → neutralize below R
__________________________________________________________________________________
Multi-Timeframe Insights
__________________________________________________________________________________
Across intraday TFs the trend is down, with supply capping bounces and demand concentrated near 84k; the 1D offers a tactical BUY only if 84k holds with confirmation.
12H/6H/4H/2H/1H: Downtrend beneath 87,784–89,513; sellers defend the MA bands and prior pivots. Key supports remain 83,600–84,200, then 79,300–80,000 if 84k fails.
1D: Tactical BUY context into 83,600–84,200 (tight 1H/1D confluence with D Pivot 83,871). A clean reversal here can squeeze to 86,000–87,784; failure opens the 79.3–80.0k magnet.
Major confluence: Tight cluster at 84k aligns with D Pivot Low; broader macro risk-off keeps upside attempts contained until 89,513 is reclaimed.
__________________________________________________________________________________
Macro & On-Chain Drivers
__________________________________________________________________________________
Macro is defensive: easier Fed rhetoric vs. near-term funding stress and soft ETF flows; risk appetite hinges on U.S. jobs.
Macro events: Repo facility usage elevated (funding stress), USD tone softer, gold remains bid above 4,300; risk assets trade data-dependent into U.S. jobs.
External Macro Analysis (dashboard): Tech regime unfavorable (master BEAR), credit risk aligned (HYG BEAR), while semis/small caps show conflicting resilience — supports a cautious, mid‑cycle stance consistent with a neutral-sell bias.
Bitcoin analysis: Spot ETF net outflow (−$357.7M daily) and muted 7d average add a macro headwind; 86.6k watched intraday, with 75k discussed as a deeper must-hold if supports give.
On-chain data: Demand softening (weak spot CVD/ETF), IV reset, >25% supply in loss; structure stabilizes above True Market Mean but remains fragile.
Expected impact: Unless data flips sentiment, macro/on-chain lean risk-off — favors fading bounces under 87,784/89,513 and waiting for a confirmed 84k reversal or a 89,513 reclaim.
__________________________________________________________________________________
Key Takeaways
__________________________________________________________________________________
BTC trades in a defensive regime: sellers cap price at 87,784–89,513 while buyers defend 83,600–84,200.
- Trend: Short-term bearish-to-neutral; fade bounces until 89,513 is reclaimed.
- Setup: Tactical dip-buy only on clear reversal at 84k; deeper buy zone stands at 79.3–80.0k.
- Macro: Risk-off tone from funding stress and ETF outflows limits upside unless U.S. data helps.
Stay nimble — treat 84k like a boss gate: confirm before entering, and respect invalidation if it breaks.

BTC Playbook: 90k Fades, 84k Swing Accumulation__________________________________________________________________________________
Market Overview
__________________________________________________________________________________
Bitcoin is consolidating under 90 000 after rebounding from 87 688, with a corrective tone where the 12H downtrend still caps momentum. The near-term battle is defined by 89 429 support and 90 000–90 600 supply overhead as macro keeps volatility elevated.
Momentum: Bearish tilt within a corrective range; rallies fade below 90 200–90 600 while buyers defend 89 429 and 87 688.
Key levels:
- Resistances (4H–1D): 89 950–90 200 (multi‑TF supply), 90 600 (HTF shelf), 93 547–94 555 (pivot‑high band).
- Supports (2H–1D): 89 429 (4H pivot‑low), 87 688 (pivot‑low), 83 800–84 200 (Cluster A with D pivot‑low inside).
Volumes: Normal on LTF and HTF; no extreme footprint to negate the 12H down bias.
Multi-timeframe signals: 12H Down and 1W Down dominate a tentative 1D Up; structure remains capped beneath 90 600 despite the daily bounce.
Harvest zones: 84 100 (Cluster A) / 79 800–80 300 (Cluster B) — preferred dip‑buy areas for inverse pyramiding when a clear reversal prints.
Risk On / Risk Off Indicator context: NEUTRE VENTE; confirms a cautious stance and aligns with fading bounces into HTF resistance.
__________________________________________________________________________________
Trading Playbook
__________________________________________________________________________________
With the dominant trend corrective and risk‑off, play defense: fade into resistance, accumulate only on confirmed floor reversals.
Global bias: NEUTRAL SELL while price is capped below 90 600; invalidation for bears on sustained closes above 90 600.
Opportunities:
- Buy the dip: 1D/2H reversal at 84 100 (Cluster A) with confirmation; first targets 89 429 then 89 950–90 200.
- Breakout long: Reclaim and hold 90 200 on 2H–4H, looking for 90 600 and 93 547–94 555.
- Tactical sell: Fade 89 950–90 200 rejection; add on a loss/retest‑fail of 89 429 toward 87 700.
Risk zones / invalidations:
- Break below 83 500 would invalidate the 84k long thesis (Cluster A failure).
- Sustained close above 90 600 would invalidate the fade‑the‑rip approach.
Macro catalysts (Twitter, Perplexity, news):
- Fed “hawkish cut” and a heavy week (NFP/CPI/PCE/quad‑witch) keep a risk‑off skew; event spikes can force range breaks.
- JPM tokenized money‑market fund on Ethereum — supportive for institutional adoption but not a near‑term driver.
- USD/JPY volatility and China softness argue for selective risk‑taking.
Harvest Plan (Inverse Pyramid):
- Palier 1 (12.5%): 84 100 (Cluster A) + reversal ≥2H → entry
- Palier 2 (+12.5%): 79 100–80 700 (-4/-6% below Palier 1) (Cluster B included) → reinforcement
- TP: 50% at +12–18% from PMP → recycle cash
- Runner: hold if break & hold first R HTF (89 950–90 200)
- Invalidation: < HTF Pivot Low 83 800 or 96h no momentum
- Hedge (1x): Short first R HTF on rejection + bearish trend → neutralize below R
__________________________________________________________________________________
Multi-Timeframe Insights
__________________________________________________________________________________
Across TFs, lower timeframes trend down while the daily shows a reflex bounce; weekly context stays corrective.
12H/6H/4H/2H/1H/30m/15m: Downtrend pressures persist beneath 89 950–90 200 and 90 600; repeated rejections favor tactical fades, with 89 429 as the intraday line in the sand.
1D: Green bar but still boxed by 90 200–90 600; a firm reclaim/hold opens room toward 93 547–94 555, else the path of least resistance remains sideways‑to‑down.
1W: Corrective and below HTF supply; until 90 600+ is reclaimed on a closing basis, risk skews to mean‑reversion into lower demand clusters.
__________________________________________________________________________________
Macro & On-Chain Drivers
__________________________________________________________________________________
Macro is mixed-to‑cautious and keeps the tape liquidity‑sensitive; on‑chain/derivatives lean defensive but can flip quickly on a clean reclaim.
Macro events: A “hawkish cut” backdrop and a packed US data slate (NFP/CPI/PCE/quad‑witch) raise event risk; USD/JPY volatility and China’s softness constrain risk appetite even as institutional on‑chain pilots (e.g., JPM) provide a slow‑burn positive.
External Macro Analysis: The Risk On / Risk Off Indicator reads VENTE with credit stress (HYG VENTE) and weak speculative appetite (ARKK VENTE); partial conflicts in semis/small caps imply mid‑cycle churn. This supports the NEUTRAL SELL technical bias.
Bitcoin analysis: After large liquidations, options structure and IV compression drive intraday; modest fund/ETF inflows are supportive but not decisive, while a reclaim could spark upside convexity.
On-chain data: Demand softer with short‑term realized losses; OI lighter, funding neutral — consistent with a reactive, headline‑driven regime.
Expected impact: Macro/on‑chain favor reactive trading — fade into 90k supply unless 90 200→90 600 is reclaimed and held; dips into 84k/80k improve risk‑reward for swing accumulation.
__________________________________________________________________________________
Key Takeaways
__________________________________________________________________________________
BTC sits in a corrective range under HTF supply with a risk‑off lean and normal volumes.
The trend is bearish‑to‑neutral while capped below 90 600. The highest‑quality setup is a confirmed reversal at 84 100 (Cluster A), with deeper adds near 80k (Cluster B) if tested. Macro remains catalyst‑heavy, so respect event risk and require confirmation. Stay patient, let the levels do the work, and harvest volatility with discipline.

NZD/AUD Forecast: The Climb to 0.90 Amid Diverging Rates
Current Status: The New Zealand Dollar (NZD) has stabilized against the Australian Dollar (AUD), trading at 0.8728 . After bottoming near 0.86 in November, the cross is recovering, driven by a recalibration of interest rate expectations and shifting economic currents.
Macroeconomic Analysis: The Central Bank Divergence
A primary driver of the NZD/AUD recovery is the reassessment of monetary policy trajectories. The Reserve Bank of New Zealand (RBNZ) faces persistent domestic inflation, tempering expectations for aggressive rate cuts. Conversely, the Reserve Bank of Australia (RBA) maintained its cash rate at 3.60% in December, maintaining a hawkish stance due to upside inflation risks. This narrowing policy gap, where the RBNZ is no longer significantly "out-dovin" the RBA, provides crucial support for the Kiwi dollar.
Geostrategy & Geopolitics: The China Factor
Both currencies remain sensitive to Chinese economic stability, but their exposure differs significantly. The AUD serves as a liquid proxy for Chinese industrial demand, facing volatility as Beijing recalibrates stimulus measures for 2026. In contrast, the NZD ties closely to soft commodities like dairy and meat, which see resilient demand despite broader geopolitical friction. As trade routes stabilize, lower volatility in New Zealand's export markets contributes to the currency's "safe harbor" appeal relative to the risk-sensitive Aussie.
Industry Trends: AgTech vs. Mining Tech
New Zealand’s shift toward high-margin agricultural technology (AgTech) is altering its export profile. Innovation in sustainable farming and automated dairy processing boosts productivity, offsetting headwinds from traditional commodity price fluctuations. Meanwhile, Australia’s mining sector grapples with high capital costs for green energy transitions. This structural divergence suggests New Zealand’s export economy is entering a phase of higher efficiency, supporting long-term valuation.
Economics: The Housing Market Constraints
Economic resilience is visible in the housing sector. Australian data indicates a 7.2% rise in home values since early 2025, driven by supply shortages. This "wealth effect" keeps consumption high, forcing the RBA to stay restrictive. New Zealand’s housing market shows more balanced supply-demand dynamics. This stability allows the RBNZ more flexibility, potentially reducing the risk of a policy error that could devalue the currency.
Forecast: The Path to 0.90
Current projections estimate the NZD/AUD cross will climb toward 0.90 by early 2027 . This forecast assumes a gradual normalization of the interest rate differential. The recovery will likely be non-linear; periods of Australian dollar strength are inevitable if global risk sentiment spikes. However, as the easing cycle proves shallower than feared and the RBA eventually pivots, the fundamental floor for the NZD is expected to rise.
Conclusion: The NZD/AUD is no longer trapped in a one-way bearish trend. Investors should watch the spread between Australian and New Zealand 2-year swap rates as the key indicator for the next leg higher.
