Bitcoin Death Cross! Save Yourselves! – November 2025A Death Cross. Sounds terrifying, doesn’t it? Like something out of a low-budget horror film. Here in deepest darkest Bavaria you can’t drive ten minutes without seeing Christ nailed to a cross at every T-junction, it’s practically the local logo. Cross the Austrian border and the numbers multiply like leverage traders in a bull run. Lovely.
But this? This is the real death cross. Or at least, that’s what the market thinks.
Déjà vu… for the third time
This is the third time I’ve written this post. And yes, it’s always at max fear. Every cycle the same: people panic, memes fly, and somewhere someone says, “It’s different this time.” Spoiler: it’s not.
If you’re feeling nostalgic, click the little triangles where the purple arrows point on the chart. you’ll see the previous posts. The critics lined up back then too, bless ’em. Loud voices, small wallets, and Mum's voice in the background "Dinner's ready!".
April 7th, 2025 Death cross
August 18th, 2024 Death cross
The November 17th Death Cross
On the 1-day chart above, the signal is forecast to print by November 17th. That’s when the
50-day SMA (blue) crosses below the 200-day SMA (red) and price action sits under the 200-day line. It’s the technical version of your mother saying, “I’m not angry, just disappointed.”
This forecast uses the Trigg & Leach method, the same one applied to prior crosses and it’s nailed every one since the bull market began.
Closer
Zooming out..
Time to market top: circa 59 days
Here’s the clever bit, or as I call it, the boring maths no one reads. Historically after each Death Cross Bitcoin rallied before topping out. The time between the cross and the pivot has been shrinking:
1st Cycle → 179 days
2nd Cycle → 131 days
3rd Cycle → 99 days
Apply some arithmetic progression, that’s a fancy way of saying “find the difference and pretend it means something.”
Difference 1 131 − 179 = −48
Difference 2: 99 − 131 = −32
Average difference = −40
Therefore 99 − 40 = 59 days.
That puts the potential cycle top mid-January 2026, and wouldn’t you know it, mid-January sell-offs are a Bitcoin tradition older than bad YouTube thumbnails.
Conclusions
So yes, a Death Cross is coming. Cue the headlines, the drama, and the bloke on X explaining Fibonacci levels like they’re sacred scripture.
Look left. Every time this happened, it played out the same way: panic, bounce, despair, recovery. Rinse, repeat.
The maths points to mid-January 2026 for the next swing high, and then gravity takes over.
If it all goes to plan, brilliant. If not, add this one to your growing folder titled “Why I don’t listen to anyone on TradingView.”
Ww
Disclaimer
==============================================================
This isn’t financial advice. I’m not your fund manager, your priest, or your mum.
If you go all-in on Bitcoin because two squiggly lines made a cross, that’s your fault, not mine.
If it pumps, you’ll say you “always knew.”
If it dumps, you’ll tweet “market manipulation.”
Either way, I’ll still be here, drinking tea and laughing at the comment section.
So yes it’s a Death Cross. But relax. It’s just a chart, not the Book of Revelation.
Ahmen
Moving Averages

CADJPY // Inverted head and shoulders formationAlthough there is a reverse head and shoulders formation on the chart, the first target exit is 113.494, which corresponds to Fibo 1.414. If the level is above the level I mentioned, the main target is 117.476.

GBPJPY // A short transaction can be opened at the level of 205.376, which corresponds to the yellow line. Our take profit point is the 8 exponential moving average.

PATH - Go in the direction of the WINDOW!PATH - CURRENT PRICE : 17.14
The Japanese Candlestick theory refer to what we call in the West a gap as a window. Whereas the Western expression is "filling in the gap," the Japanese would say, "closing the window."
A rising window is a bullish signal. There is a price vacuum between the prior session's high (that is, the top of the upper shadow) and the current session's low. It is said by Japanese technicians to "go in the direction of the window." This is because windows are continuation signals. Consequently, with the emergence of a rising window, one should look to buy on dips.
PATH has formed three rising windows (gaps upward) in just two weeks that remain unfilled. This pattern suggests strong demand and sustained bullish momentum. Each window shows that buyers overcame sellers before the prior candle closed, reinforcing confidence in the trend.
Furthermore, a Golden Cross has formed for the first time in a long period (look at blue circle), where the 50-day EMA has crossed above the 200-day EMA — a classic long-term bullish confirmation. Notably, the last occurrence of this pattern was in November 2023, making this the first reappearance in over two years, further reinforcing its significance as a potential turning point in market sentiment.
For short-term target is 20.00 and 24.00. For position trader that holds for several months may target around 30.00. Investors holding for approximately one year, the target is 50.00.
ENTRY PRICE : 16.80 - 17.20
FIRST TARGET : 20.00
SECOND TARGET : 24.00
SUPPORT : 14.77 (the low of 08 Oct 2025 candle) - cutloss if price close below support level on closing basis.

btc finds 200 ema support, whats next?As I have been posting in these "Ideas" for the past few weeks about market direction and where the price for BTC will go. It now has come to pass where the 200 EMA has been tested and support has been found, It however has not generated any relief among buyer sentiment unable to push price above the previous days close leaving the digital asset to continue to bleed out and cause positions from all the 93k Bulls to liquidate.
Its a shame people cannot make the connection that the only way price can go higher is to go lower in a market. That Is why I am going to warn people about where we may go , I believe the 200 EMA will be tested again and if support is broken it will send is into the low 70k area where there are open orders and It is possible this may happen. The Bull market support band is the 200EMA however there may be institutional money that may drive us down to cause massive liquidations and fear and panic among those holding bags while greed causes big players to push more into the fringe of where we can maintain a recovery.
Watch for a retest of the 200EMA . which is a bit of a fuzzy zone , use the high and low to denote the area for support as well as keep an eye on the RSI and CCI , we are also watching on balance volume drop off which is not a great sign that there is market confidence however this will play out over the weekly and the weekly candle will start to materialize in the next few days.

(hidden) Confluence of support#Gold has a new shelf of volume that is centered on $4,000. This amount of volume has served as support 2 other times in the last 9 months.
That said, a hidden confluence of support may hit exactly in yellow highlight:
- MA20
- unformed tringle chord
- $4,000, as mentioned.

All Bitcoin 6 Month Moves following a Death Cross (1D Timeframe)Analyzed all the previous 6 month moves of BTC after a death cross. Turns out they are a lot less bearish than you would assume.

$BTC crash. Where is the bottom?Bitcoin is crashing — and while it looks scary, it’s also one of those rare long-entry opportunities you’ll regret missing once the rebound kicks in.
Why is Bitcoin dumping?
1️⃣ A major hedge fund manager shut down his Bitcoin fund.
Historically, this kind of event often precedes bubble corrections, creating panic in the market.
2️⃣ The FED won’t publish inflation or unemployment numbers due to the government shutdown.
With no data, Powell can’t justify a rate cut.
The market is now pricing a “no-cut scenario,” which puts downward pressure on all risk assets — including crypto.
3️⃣ Structural consolidation.
I already posted about this:
- bullish short-term,
- bearish long-term
This is exactly what’s happening.
The macro downtrend should end around Q2 2026, meaning we’ll likely grind down or range until then.
Is this a bear market?
Not really.
Bitcoin probably won’t see an -80% crash ever again.
But a -30% correction? Absolutely possible.
What does the chart say?
The current correction has a support zone at $94–95k.
If that breaks, the next zone is $88k — less likely but still possible.
Between now and Q2 2026, we’ll get several relief bounces.
If you go long without leverage on strong support zones, you can ride these bounces safely.
Where is the opportunity?
Buy the fear, sell the greed — classic strategy.
Altcoins will bounce even harder than BTC:
CRYPTOCAP:PEPE , NYSE:FUN , DeFi coins, memecoins — these always react with double-digit rebounds.
The key idea
👉 The best entries happen when everyone is panic-selling.
👉 The best exits happen when everyone is euphoric.
Stay smart, stay patient.
DYOR.
#Bitcoin #CryptoCrash #BTC #Altcoins #CryptoTrading #CryptoAnalysis #CryptoMarket #CryptoInvesting #BTCPrice #BuyTheDip #MarketUpdate #TradingStrategy #TechnicalAnalysis #Macro #RiskManagement #HODL #CryptoNews

Weakening economy? How about pawn shops?@matthias brought up EZPW in a conversation we were having today and we got talking about how pawn shops are like BNPL stocks, but with interest income and physical collateral in case loans don't get paid back. In what looks to be a somewhat sputtering economy that I, personally, think will get weaker as AI gets better and better at replacing more and more people at their jobs, stocks like these offer relative security.
They are somewhat inversely correlated to the market - when things get worse in the economy, business tends to pick up for them. If inflation re-enters the chat, they have physical collateral/inventory (a lot of which is gold and silver jewelry) that rises in value. You can see how it performed back when the tariff tantrum was going on in Feb and March.
It has been in a strong and steady uptrend all year, and is currently well above its 200 EMA. A rebound in gold should, in theory, help stocks like this one, too. The method I'm using here today has resulted in 26 winning trades on the year, with 0 losses. The average gain is about 1.84% (this is a first profitable close method) and the average trade length was 4.4 trading days. This generated a .42% per day held gain, which is +106% annualized.
As a bonus, 21 of the 26 trades closed in 1 or 2 trading days, freeing up my money to go back to work elsewhere if this plays out that way too. Not many other stocks in the market right now offer a chart that looks like this, with fundamentals that get rosier as things elsewhere in the portfolio get gloomier. I got in at the close at 158 even.
If the trade drags out, I will happily add to the position tactically and take profits on those additions the same way.
As always - this is intended as "edutainment" and my perspective on what I am or would be doing, not a recommendation for you to buy or sell. Act accordingly and invest at your own risk. DYOR and only make investments that make good financial sense for you in your current situation.

The S&P 500 is flirting with a close below the 50-day moving aveThe S&P 500 is flirting with a close below the 50-day moving average for the first time since April.
This level has acted as reliable support twice already, and so far the index is reacting in a similar way.
However, the RSI is showing a clear bearish divergence, suggesting momentum is weakening even as price pushed to new highs in October–November.
🔎 Key levels to watch:
• 50-day MA — primary support
• RSI structure — persistent lower highs
• Recent swing lows — potential breakdown trigger if the 50-day MA fails
Price is at an inflection point: either the 50-day holds again, or we finally get a deeper pullback after months of strength.

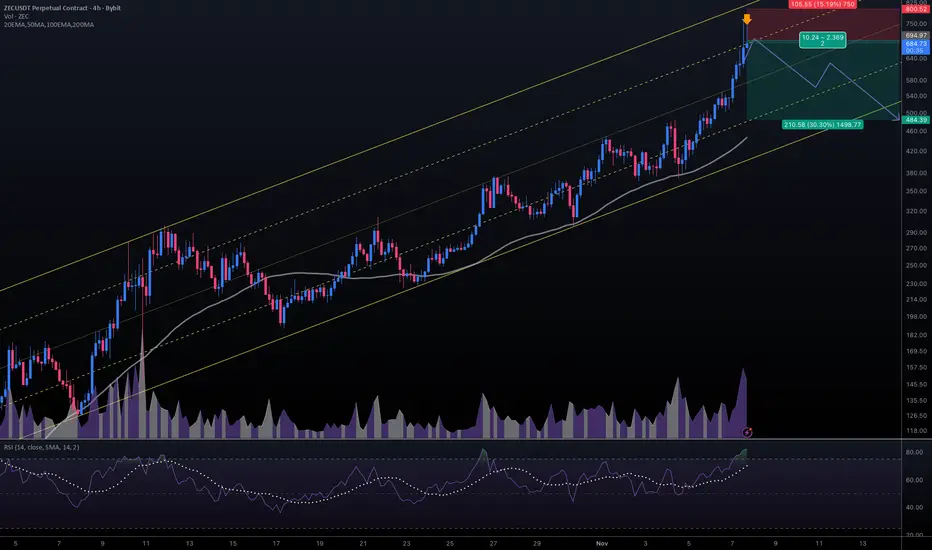
#ZECUSDT #4h (ByBit) Ascending channel on resistance [SHORT]Zcash just printed a shooting star and entered overbought territory again.
It seems likely to finally retrace down towards 50MA support, short-term.
⚡️⚡️ #ZEC/USDT ⚡️⚡️
Exchanges: ByBit USDT
Signal Type: Regular (Short)
Leverage: Isolated (3.0X)
Amount: 4.4%
Current Price:
684.73
Entry Targets:
1) 694.97
Take-Profit Targets:
1) 484.39
Stop Targets:
1) 800.52
Published By: @Zblaba
CRYPTOCAP:ZEC BYBIT:ZECUSDT.P #4h #Privacy #ZK z.cash
Risk/Reward= 1:2.0
Expected Profit= +90.9%
Possible Loss= -45.6%
Estimated Gaintime= 1 week
GBP/USD Fails at 1.3200 for Second DayGBP/USD is trading lower on Friday after the U.K. government abandoned its planned income tax increases, a move that immediately raised concerns about how the Treasury will plug the emerging budget gap. Scrapping the tax increases leaves an estimated £20-30 billion shortfall that will need to be addressed in the Autumn Statement. Markets are already pricing wider risk premia around U.K. assets, with U.K. gilt yields rising across the curve to Sterling’s detriment.
In the above chart, GBP/USD rates have once again failed to break above 1.3200, where both the May and July monthly lows were carved out. The pair is likewise struggling to sustain price action above its 20-day exponential moving average (EMA). Concurrently, each of the 20-, 50-, and 100-day EMAs have a negative rate of change, signifying sustained bearish momentum. Daily MACD remains below its signal line, while Slow Stochastics are dropping through their median line. Bears are in control as long as GBP/USD fails to sustain a daily close north of 1.3200.

SYRUPUSDT 4H – On-Trend Long in Institutional Credit RWA 1. Setup
BINANCE:SYRUPUSDT is the token of Maple Finance – an institutional on-chain credit / RWA platform with syrupUSDC/USDT products and a clear fee → buyback model.
Spot trades around 0.44–0.45 with 24h volume in the $45–58M range and a market cap near $510M. Drawdown from the June ATH at 0.6532 is only ~31%, so this is not a “dead rebound” but a mid-trend pullback.
My 4H On Trend Long strategy has triggered a fresh long after a higher low around the 4H EMA band, with all intraday timeframes (15m–3D) in “Above trend” state while only 1W remains below.
2. Technical context (4H)
Price has been oscillating around the 4H EMA ribbon, respecting it as dynamic support. The last dip into ~0.43–0.44 was bought up, leaving a higher low at the blue support block. From here I’m following the system and joining the existing uptrend instead of trying to catch an extreme deviation.
Trade levels on the current setup:
Entry zone ≈ 0.449
Invalidaton ≈ 0.428 (break below local demand / 4H EMA stack)
Main target ≈ 0.533–0.537 (prior local high and resistance cluster)
That’s roughly +18.6% upside vs −4.8% downside, R:R ≈ 3.9.
3. Strategy statistics – 4H On Trend Long (SYRUP)
Backtest sample: 65 trades, long only.
Winrate ~41.5% – many small scratches and failed trends.
Average PnL per trade +1.70%.
Average winner +5.6%, average loser −2.1% → win/loss size ratio ≈ 2.45.
Largest winner +22.1%, largest loser −7.3%.
Trades are relatively short-lived: ~5 bars in total on average, ~8 bars in winners.
So the edge is classic trend-following: lower hit-rate, but winners tend to pay for several losers. This current setup fits the profile – risk is kept close to the historical average loss, while the target lies in the upper zone of past winners.
4. Fundamentals & flows
TVL and AUM keep expanding: Maple has >$5B AUM in Q3, +66% QoQ, with institutional inflows above $500M recently.
Revenue momentum is strong: about $4M in Q3 (+41.5% QoQ), with an October revenue ATH around $2.16M.
The protocol directs 25% of protocol revenue into SYRUP buybacks, creating a direct link between credit growth and token demand.
Recent news highlighted integrations with Aave and other DeFi venues, plus a Q4 ecosystem call focused on 2026 plans – all keeping the RWA/credit narrative warm.
On derivatives, OI sits near $25M, with futures volume roughly 1.5–3x spot. This leverage mix can amplify moves in both directions, so invalidation needs to be respected.
Scorecard from my dashboard:
Sentiment +9, Momentum neutral, Liquidity high, Risk medium, Confidence ~80%.
5. Trade plan & invalidation
The idea is simple: follow the existing 4H uptrend with a system long, using the EMA ribbon as a dynamic line in the sand.
If price closes 4H below 0.428 and fails to quickly reclaim the EMA band, I treat the trend leg as broken and exit. If the move plays out, I’ll look to realise most profits around 0.53–0.54, where earlier sellers were active, and only keep a small runner in case the fundamental momentum drives a new ATH push.
Not financial advice – just a structured on-trend long setup in one of the stronger RWA / credit names.

PLUMEUSDT 4H – EMA Deviation Long on RWA + USDC CatalystSetup
BYBIT:PLUMEUSDT just printed a fresh 4H EMA Deviation long signal after a sharp flush below the EMA stack. Price is trading around 0.038–0.039, with all key timeframes (15m, 1H, 4H, 1D, 3D) in “Below / Oversold” state on my EMA Dev dashboard. Current 4H deviation is ~28%, above the historical oversold average (~26%), which fits my rules for a mean-reversion long.
I am looking for a bounce back into the 4H EMA band and the nearest supply zone, where the previous distribution leg started.
Technical context
The downtrend from 0.055–0.056 pushed price under the 4H and 1D EMAs and into the lower ATR corridor. The last impulsive candle washed out local longs and expanded deviation to one of the highest readings in the current sample.
Key levels on the chart:
• Entry zone: 0.038–0.039 (current 4H demand / max negative deviation)
• First target: 0.0485–0.0490 (4H EMA cluster + local supply)
• Optional second target: 0.055–0.056 (prior breakdown area / 1D EMA region)
• Invalidation: sustained 4H close below the spike low around 0.034–0.035
As usual with this strategy, I’m not trying to catch the exact bottom – the edge comes from entering when deviation is stretched and closing into the EMA / resistance band.
Strategy stats (PLUME, 4H EMA Dev long)
Backtest sample: 20 trades, long only.
Winrate: 75%.
Avg PnL per trade: +3.75%, avg winner +8.15%, avg loser −9.45% (win/loss ratio ~0.81).
Largest winner +17.4%, largest loser −15.4%.
Losing trades tend to last longer (≈62 bars) than winners (≈25 bars), so if price sits under EMAs too long without mean reversion, I prefer to cut rather than “marinate” in drawdown.
Given the current ~28% negative deviation, the upside to the 4H EMA/supply (~+25–28%) is larger than the historical average winner, while downside to invalidation is kept near the typical loss profile.
Fundamentals & narrative
Plume is positioning as an RWA chain with a focus on compliant tokenized assets:
CCTP V2 and native USDC are now live on Plume, enabling smoother cross-chain liquidity flows.
Nest Protocol is relaunching on Plume using Pendle-style mechanics with TVL in the hundreds of millions, supporting the yield/RWA narrative.
There is active collaboration with Circle (CCTP + USDC workshop) and a growing stack of institutional RWA products (WisdomTree funds, Galaxy allocation, prior SEC transfer-agent registration, etc.), although some of those catalysts are already “spent” in the short term.
Main overhang: an upcoming unlock of ~239.65M PLUME (~2.4% of supply) on 21 December, which can cap the upside if spot demand doesn’t keep up. My fundamental score here is around BBB+ – constructive RWA + USDC story, but with clear unlock risk.
Trade plan
Base case: fade the current oversold deviation on 4H, ride the move back into 0.048–0.049, and optionally trail a small remainder toward 0.055–0.056 if momentum and flows improve.
If price fails to bounce and closes 4H below 0.034–0.035, I consider the EMA Dev setup invalid for now and step aside until a new deviation cluster forms.
Not financial advice – this is a systematic mean-reversion long based on my EMA Deviation framework plus the current RWA / USDC catalysts on Plume.

Dogecoin (DOGE/USD) Technical Analysis – Monthly ChartStructure:
Long-term ascending channel since 2021.
Currently trading near the 50-month SMA (~$0.14) — a key support level that has held multiple times.
Bullish Scenario
If DOGE holds above $0.14–$0.16 and confirms a monthly close above $0.18,
momentum could push it higher within the channel.
Targets:
• Target 1: $0.30
• Target 2: $0.38
• Target 3 (major resistance): $0.50
Stop Loss: Below $0.13 (monthly close)
Bearish Scenario
If DOGE breaks and closes below $0.14, the long-term uptrend channel weakens.
A deeper correction could follow.
Downside Targets:
• Target 1: $0.10 (channel bottom)
• Target 2: $0.06 (major psychological support)
Stop Loss for shorts: Above $0.19 (monthly close)

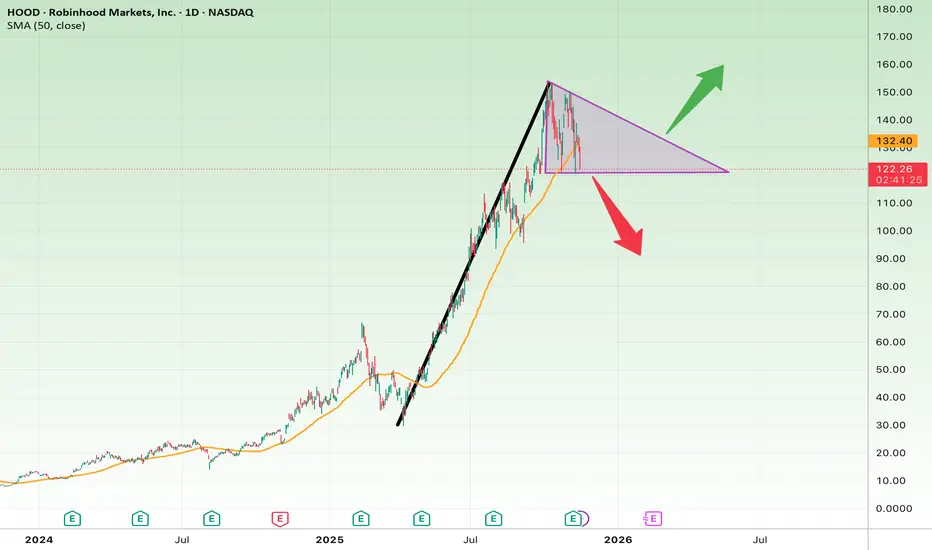
Robinhood at a Major TriangleHOOD formed a symmetrical triangle after a massive rally from ~$20 to ~$150. This consolidation now acts as a make-or-break zone.
Bullish Case:
• Break above $140 → continuation toward $160–$170
• Supported by the 50-day SMA at $111
Bearish Case:
• Drop below $120 → correction to $100–$85
Conclusion:
Robinhood is in a decisive consolidation. The breakout direction will define its next big move.
SoFi Testing Major Cup Breakout — Bull Run or Fakeout?SOFI has formed a large cup pattern over the past few years, now testing the key breakout zone around $28–$30. The 50-day SMA at $28 adds dynamic support.
Bullish Case:
• Breakout above $30 → targets $45–$50.
• Strong volume = confirmation of long-term uptrend continuation.
Bearish Case:
• Failure to hold $28 → pullback to $25, possibly $20 if weakness continues.
Conclusion:
SOFI is at a critical breakout level. Sustaining above $30 would confirm a multi-year reversal pattern with major upside potential.

EUR/USD Aiming for 1.1700, AgainEUR/USD has rallied near 1.1630 on Thursday, supported by firm messaging from European Central Bank officials and a moderate rebound in risk sentiment following the resolution of the U.S. government shutdown earlier this week. The pair briefly tested 1.1643, its highest level in two weeks, before easing slightly in midday trade.
Comments from ECB Executive Board member Isabel Schnabel helped underpin the Euro after she said inflation risks in the Eurozone remain “tilted a little to the upside,” suggesting policymakers are in no rush to discuss rate cuts. That hawkish tone reinforced expectations that the ECB will stay on hold through the end of the year. In the U.S., uncertainty persists following the short federal shutdown that delayed the release of key inflation and employment data.
In the above chart, EUR/USD rates have broken the downtrend from the September and October swing highs, suggesting the recent period of weakness may be ending. The pair is on pace for its first close above its 50-day exponential moving average (EMA) since October 16. From a technician’s perspective, a breach of recent swing highs near 1.1669 would confirm that the series of lower highs and lower lows has ended. Until then, resistance could appear at first blush in the area around the late-September swing lows/late-October swing highs.

EURUSD BUY OPPORTUNITY SWING TRADERS 30min There is a clear trend break and retest on 30min timeframe. Waiting for price to retest the support level and hit off 10 20 EMA. Targeting 1.17100. 4hr timeframe EMA's are also on uptrend. Potentially big rr trade....

TESLA Long SqueezeTesla has been trading within a sideways range but has recently broken down below it. Following some intriguing options data suggesting a potential positive gamma move above $450, many market participants may have become overly optimistic and begun anticipating new all-time highs.
However, at its current price level, Tesla appears to be in a danger zone. The recent rally lacks well-developed price action, indicating weak support until around $370. In that region, I have identified several VWAPs marking volume-weighted support areas, as well as the value area low from the volume profile of the previous trading range.
These zones align well with a potential support/resistance flip of the initial Wave 1 structure, and I’ll be watching for a possible Wave 4 low to form in this area.
According to Elliott Wave Theory, if Wave 4 falls below the highs of Wave 1, the structure is no longer considered impulsive and instead becomes corrective. This would increase the probability of Tesla’s price retracing toward previous lows—potentially dipping below $300 once again.
I plan to set alerts and monitor this zone closely for a possible long setup.

Aecon Group Inc. (TSX: ARE) — Swing Trade💰 Aecon Group Inc. (TSX: ARE) — Swing Trade Breakdown
Chart Date: Nov 13, 2025
RSI(2): 3.11 (deep oversold signal)
🏢 Company Snapshot
Aecon Group is one of Canada’s leading infrastructure and construction companies — active in transportation, utilities, and industrial projects. The stock has been trending higher since mid-2024, supported by strong backlog growth and resilient margins in public and energy projects.
📈 Fundamentals
Valuation remains moderate with a P/E around 9×, a healthy 3.4% dividend yield, and a manageable debt-to-equity ratio near 0.6. Free cash flow and liquidity are solid, positioning Aecon to capitalize on new government-funded infrastructure spending. Fundamentally sound and cash-generative — ideal for steady accumulation during pullbacks.
🔍 Technical Setup
ARE recently pulled back from its October peak near CAD $35 to test the 50-day moving average around $27–28, printing a strong RSI(2) oversold reading at 3.11 — historically a high-probability bounce zone on this ticker.
Price remains above the 200-SMA (~$21), confirming a sustained uptrend. Volume has stabilized after the post-earnings surge, showing orderly profit-taking rather than panic.
The pattern resembles a textbook pullback within an ongoing uptrend, where previous “BUY” signals at the 50-SMA have consistently led to multi-week rallies.
🎯 Trade Plan
Entry Zone: $27.00 – $27.50, near 50-SMA and RSI(2) signal confirmation.
Stop Loss: $25.80, below the 50-SMA and recent swing low.
Target: $31.50 – $33.00, near prior resistance and measured-move projection.
Risk/Reward: ~2.5× potential return to risk.
Aggressive traders may scale in at current levels; conservative traders can wait for a bullish reversal candle or reclaim of $28.00 with uptick in volume.
🧠 Swing Trader’s View
Aecon is in a bullish intermediate trend with short-term oversold momentum. RSI(2) at 3.11 is one of the lowest readings of 2025 — typically preceding a relief rally. As long as price holds above $26.00, the 50-SMA should act as dynamic support.
This setup aligns with prior buy triggers seen earlier in the trend (August and September), both leading to strong continuation swings.
💡 Outlook (Next 1–3 Weeks)
Expecting a technical rebound toward $31+ if the 50-SMA holds.
Favouring a buy-the-dip swing targeting mid-November strength — confirmation comes with an RSI(2) cross back above 10 and volume expansion off the 50-day line.

LYFT 1W from losses to profit investors believe,but for how longLYFT broke out of its long accumulation range between $8 and $20 and is now consolidating above the breakout level. The “breakout + retest” structure remains intact, with $20–21 acting as key support. A golden cross on the weekly chart confirms a shift toward bullish momentum. As long as price holds above $20, targets stay at $33.33 and $48.48.
Fundamentally , Lyft is in its strongest position in years. In Q3 2025, the company reported its first net profit of about $46 million after years of losses. Revenue grew 11% YoY to $1.68 billion, gross bookings rose 16%, and adjusted EBITDA reached roughly $139 million (+29% YoY). Active riders climbed past 28 million, average revenue per user increased, and corporate and premium rides strengthened overall performance. Cash flow improved, debt levels declined, and operating margins continued to expand.
The main challenge lies in competition and pricing pressure from Uber, as well as in sustaining profitability beyond a single quarter. While optimism is reflected in the stock price, consistent financial performance is now critical for further upside.
Technically, holding above $20 keeps the bullish setup valid. Any pullback toward $21–20 may offer a buy-the-dip opportunity with targets at $33 and $48.
Lyft finally turned profitable - now the real test is proving that growth isn’t just a quarterly anomaly.

Insight Enterprises | NSIT | Long at $92.10Insight Enterprises NASDAQ:NSIT
Technical Analysis
Price entered my "crash" simple moving average zone. Often, but not always, this is an area of algorithmic share accumulation and price reversal. A red flag, however, is that there are still open price gaps on the daily chart down to $50. A green flag is that there are open price gaps up to $215. While the price gaps below will likely get filled in the future, I am betting on a short-term reversal (if not longer-term one) given the prospective growth and its current P/E of 20x (electronic industry currently near 30x).
Insight AI
Stock enters the "crash" zone, and suddenly there is an generative AI announcement to drive revenue and EPS growth: www.businesswire.com . Intentional drive down of stock price for entry? Time will tell.
Revenue and Earnings-per-Share Growth into 2028
Revenue: $8.32 billion in 2025 to $9.88 billion in 2028 (+10.8%)
EPS: $9.64 in 2025 to $12.38 in 2028 (+28.4%)
Health
Debt-to-Equity: 0.9x (pretty good)
Quick Ratio / ability to pay current bills: 1.3 (1.5-3.0 is ideal, but still pretty good)
Alman's Z Score / risk of bankruptcy: 1.8 (3+ is ideal, so moderate risk)
EBIDTA: 5% to 7% range, which is generally considered healthy
Action
Given the "value", AI integration, technical analysis assessment, and growth, NASDAQ:NSIT is in a personal buy zone at $92.10. Caution if the stock dead-cat bounces and aims to drop further into the $50s, but I suspect fundamentals will have to dramatically change in the near-term for that to happen (or the economy crashes)...
Conservative Targets into 2028
$105.00 (+14.0%)
$117.00 (+27.0%)
