Signal Breakout as SOL Targets ATH and $300+Solmate’s $300M Launch in the UAE Sparks Solana Treasury Wave: Institutions Signal Breakout as SOL Targets ATH and $300+
The Solana ecosystem is entering a critical new phase of institutional adoption and capital formation, with multiple catalysts converging to form one of the strongest bullish narratives in crypto today. The headline development: Solmate has launched with a $300 million mandate to establish a Solana-focused treasury in the United Arab Emirates. This move, paired with growing institutional interest, potential ETF approvals, and increasingly favorable technicals, has set the stage for a potential breakout rally. Some market participants now see a credible pathway to $300+ for SOL, while others point to new all-time highs as fundamentals and momentum align.
This piece explores the strategic implications of Solmate’s treasury launch, the growing momentum behind Solana among institutions like Forward Industries, the macro tailwinds surrounding ETF approvals, and the technical structure that supports a bullish continuation. We’ll also assess the potential risks, the role of on-chain growth, and how the UAE’s regulatory and capital environment could accelerate Solana’s trajectory.
Solmate’s $300M UAE Treasury: Why It Matters
Solmate’s $300 million capital pool dedicated to establishing a Solana treasury in the UAE is more than a headline number—it’s a signal that institutional-grade asset management for crypto-native assets is globalizing beyond traditional finance hubs. The UAE, and particularly Abu Dhabi and Dubai, have positioned themselves as crypto-forward jurisdictions with clear regulatory sandboxes and proactive frameworks. Establishing a Solana treasury there creates:
• A regional liquidity hub: Concentrating capital in a friendly regulatory environment can improve market depth for SOL and Solana-native assets during aggressive expansion phases.
• Institutional standardization: A treasury framework can adopt disciplined risk controls, custody standards, and transparent rebalancing strategies, making it a template for other funds and corporates to emulate.
• On-ramp for Middle Eastern capital: Sovereign wealth funds, family offices, and regional asset managers have shown interest in digital assets. A Solana-focused treasury in the UAE lowers friction for capital allocation.
•
Mechanics of a Solana Treasury
Treasury operations are more than passive holdings. They typically involve:
• Core SOL accumulation: A base allocation that reflects long-term conviction in network value capture, staking yields, and governance.
• Liquidity provisioning: Deploying assets in DeFi protocols, AMMs, and order books to enhance liquidity and earn fees, subject to risk controls.
• Staking strategies: Validator diversification, slashing protection, and yield optimization through auto-compounding and programmatic rebalancing.
• Venture and ecosystem exposure: Strategic allocations to Solana-native projects, tokens, real-world asset (RWA) initiatives, and infrastructure plays (or via index-like baskets).
• Hedging overlays: Options and perp hedges to manage drawdowns while maintaining directional exposure.
By anchoring these flows in the UAE, Solmate not only signals conviction; it operationalizes a repeatable structure that can absorb larger institutional checks as compliance frameworks and counterparties mature.
Forward Industries Bets Big on Solana
Forward Industries’ publicized pivot toward SOL underscores a broader shift: institutions are no longer simply “diversifying” into Solana—they are actively rotating into it as a core position. The drivers include:
• Performance-to-throughput ratio: Solana’s execution environment continues to deliver high throughput and sub-second finality with low fees, supporting consumer-grade applications such as payments, on-chain order books, and gaming without UX compromise.
• DePIN, payments, and consumer apps: From real-time order execution to growth in tokenized assets and payments rails, Solana’s app layer is demonstrating product-market fit in areas where latency and cost matter.
• Developer momentum: Tooling, runtimes, and TypeScript-centric development are attracting teams that want to ship quickly with rich UX. Growth in Saga and mobile-focused experiments adds tailwind.
• Liquidity concentration: As more capital pools into SOL pairs and Solana’s native DEXs, slippage decreases and the market becomes more attractive for block-sized orders.
The “buying frenzy” moniker stems from combined flows across centralized exchanges, on-chain wallets, staking platforms, and prime brokers. Institutional trade sizes are up, and block liquidity providers report rising interest for SOL borrow and cross-margin facilities—both signposts that levered directional exposure and basis trades are heating up.
The ETF Wave: SEC Approvals Could Reshape Flows
A critical macro catalyst is the likelihood of multiple ETF approvals in the coming months. While much of the focus has been on Bitcoin and Ethereum, the structural changes triggered by ETF adoption—standardized custody, audited NAV calculations, and regulated market-making—create spillover effects across large-cap crypto assets.
Here’s why ETF approvals matter to Solana:
• Legitimacy funnel: When institutions obtain board approvals for crypto exposure via ETFs, internal compliance friction declines. From there, investment committees often explore other large-cap crypto assets with similar liquidity and adoption—enter SOL.
• Portfolio construction: Multi-asset crypto strategies reweight based on momentum, liquidity, and correlations. If BTC and ETH ETF flows stabilize, allocators often diversify into high-beta assets with compelling adoption narratives—again, SOL is a prime candidate.
• Derivatives market deepening: ETF market-making expands basis, options, and hedging activity. Robust hedging tools lower the barrier to building large SOL positions.
Even if a Solana ETF is not immediately approved, the institutional infrastructure and behavioral changes catalyzed by BTC/ETH ETFs provide a clear path for capital to migrate into SOL through other compliant vehicles.
Technical Structure: SOL Aligns for a Breakout
From a technical perspective, SOL’s setup reflects several bullish elements frequently observed in assets that break into new cyclical highs:
• Higher lows and a strong weekly structure: Persistent higher lows on the weekly timeframe suggest bid support from larger accounts. Breakouts from multi-month accumulation ranges often lead to trend extensions.
• Volume confirmation: Rising volume on up weeks and muted sell volume on retracements indicate absorption by patient buyers. This is often a hallmark of institutional accumulation.
• Moving average alignment: When the 50-day and 200-day moving averages turn up in tandem and compress beneath price, they function as dynamic support. Golden cross conditions on high timeframes historically reinforce trend persistence.
• Momentum oscillators: Constructive RSI behavior (staying in bullish regimes, respecting 50-55 on pullbacks) supports the case for sustained upside. MACD crossovers above the zero line add confirmation.
• Market structure breaks: If SOL clears prior supply zones with strong breadth in Solana ecosystem tokens, it often precedes a sharp expansion leg.
From a pure charting lens, the path to retest the all-time high (ATH) becomes plausible once prior resistance shelves are flipped to support with convincing retests. The next leg can extend if funding stays balanced and derivatives don’t overheat.
Why $300+ Is on the Table
Calling specific price targets in crypto is always probabilistic, but the $300+ scenario reflects a confluence of factors:
• Elastic demand: As SOL regains narrative dominance, every incremental institutional participant must source supply in a relatively illiquid float, especially with high staking participation. This creates reflexivity: higher prices attract more attention and flows.
• Ecosystem beta: When Solana majors rally, Solana ecosystem tokens and NFTs often follow, generating wealth effects that feedback into SOL via fees, staking, and treasury rebalancing.
• On-chain revenues and usage: Fees and MEV-like revenue capture, combined with consistent L1 usage, differentiate SOL as more than a speculative token. If fee markets remain healthy without compromising UX, valuations can adjust quickly.
• Capital markets maturity: Prime brokerage services, credit lines, and custodial lending for SOL increase leverage capacity for funds. Managed responsibly, this deepens liquidity and smooths volatility while supporting upside.
•
Institutional Signaling and Order Flow Dynamics
Institutions leave footprints:
• Options skew: A shift toward call dominance and tightening call spreads near key strikes suggests demand for upside exposure. Calendar spreads can hint at timing expectations around catalysts like ETF decisions or protocol upgrades.
• Basis behavior: Persistent positive basis with manageable funding indicates steady demand for levered long exposure without frothy excess. Sharp basis expansions often precede blow-off tops, but controlled elevations are constructive.
• Block trade prints: Larger fills on the offer with minimal price impact imply sophisticated execution algorithms are absorbing liquidity. VWAP-style participation in uptrends is a hallmark of fund flows.
•
Solana Fundamentals: Not Just Hype
The bullish case is reinforced by fundamentals:
• Throughput and reliability improvements: Ongoing client and scheduler upgrades have meaningfully reduced congestion and improved consistency, aligning the chain for mainstream-scale apps.
• Developer ecosystem: Grants, hackathons, and venture inflows are driving an uptick in deployment across DeFi, DePIN, payments, and consumer social. More apps mean more transactions, fees, and network effects.
• Staking and validator health: A broad validator set with improving decentralization metrics, plus liquid staking growth, provides both security and capital efficiency. Mature slashing protections and monitoring infrastructure reduce operational risk.
• Cross-ecosystem bridges and RWAs: Safer bridging architectures and the growth of tokenized real-world assets on Solana expand the total addressable market and institutional relevance.
The UAE Vector: Why Location Matters
The decision to anchor a Solana treasury in the UAE amplifies several advantages:
• Regulatory clarity: Entities can obtain approvals and operate with predictable oversight, facilitating custody, staking, and DeFi participation at institutional scale.
• Geographic diversification: Reduces dependence on US and EU regulatory cycles, creating a global liquidity map that supports 24/7 markets.
• Access to sovereign and family office capital: The region’s investor base is comfortable with alternative assets, infrastructure, and frontier technologies, making Solana’s high-throughput narrative particularly compelling.
• Talent and infrastructure: The UAE’s growing fintech and crypto workforce supports operational resilience for treasury and market activities.
Risk Factors and What Could Go Wrong
No thesis is complete without acknowledging risk:
• Regulatory shifts: Unexpected adverse rulings in key jurisdictions, or delays/denials around ETFs, could dampen flows and sentiment.
• Network incidents: Performance degradation or security issues would hurt adoption narratives and compress multiples.
• Liquidity shocks: If derivatives positioning becomes crowded, a deleveraging event could trigger cascading liquidations. Watch funding, OI, and CVI-like measures.
• Macro correlation: A sharp risk-off in global markets—driven by rates, growth scares, or geopolitical events—can compress crypto valuations, including SOL, even amid strong fundamentals.
• Competitive pressure: Advances from competing L1s or L2s, especially around modular architectures and data availability, could siphon developer and liquidity attention.
Signals to Track in the Coming Months
For investors and observers, keep an eye on:
• ETF decision timelines: Not just for SOL, but for broader crypto products. Watch S-1 updates, surveillance-sharing agreements, and authorized participant rosters.
• On-chain metrics: Daily active addresses, fee revenue, transaction success rates, and validator participation. Sustained growth here supports the fundamental re-rating.
• Derivatives health: Funding rates, options IV, skew, and term structure. Healthy markets allow trends to persist without disorderly squeezes.
• Treasury disclosures: Any public filings, attestations, or wallet monitoring from Solmate and similar entities. Evidence of steady accumulation bolsters the thesis.
• Ecosystem catalysts: Major app launches, RWA integrations, payments partnerships, and mobile distribution wins (e.g., Saga ecosystem) that translate to real usage.
Strategy Considerations for Different Participants
• Long-only funds: Dollar-cost averaging with disciplined rebalancing can mitigate timing risk. Consider partial hedges around known catalysts to manage drawdowns.
• Crypto-native funds: Use options to express directional views while capping tail risk. Calendar call spreads around ETF windows or ecosystem launches can be capital-efficient.
• Corporates and treasuries: For those inspired by Solmate’s model, start with staking policies, custody/vendor selection, and risk dashboards. Establish governance before deploying into DeFi strategies.
• Retail participants: Avoid over-leverage. Respect invalidation levels and maintain a cash buffer. Focus on time in market rather than perfect entries.
•
Why This Cycle Is Different for Solana
Cycles rhyme, but specific drivers evolve. For SOL, three differentiators stand out:
• Real usage at scale: Consumer-grade apps processing real volumes, with fee revenues that matter.
• Institutional-grade infrastructure: Custody, staking-as-a-service, credit lines, and compliance tooling that make large allocations feasible.
• Global capital alignment: The UAE initiative symbolizes a broader dispersion of crypto capital formation—less dependent on any single regulator or geography.
The Road to ATH and Beyond
Reclaiming all-time highs requires both narrative strength and structural support. Solana’s current setup has:
• Narrative: High-throughput chain powering next-gen consumer and financial apps, now validated by serious capital allocators.
• Structure: Disciplined treasury formation, institutional flows, deepening derivatives, and growing on-chain revenues.
A move to fresh ATHs could unfold in stages:
1. Clearance of major resistance with rising spot volume
2. Healthy consolidation with elevated but not extreme funding
3. Fresh leg higher fueled by ecosystem beta and positive macro catalysts (ETF approvals, corporate adoption)
4. Volatility expansion near psychological round numbers, followed by a volatility contraction if treasuries and market makers absorb flows
If these stages play out with controlled leverage and robust spot participation, the path toward $300+ becomes more than aspirational—it becomes a function of order flow and narrative reflexivity.
Bottom Line
• Solmate’s $300 million launch to build a Solana treasury in the UAE is a landmark institutional milestone that could catalyze regional and global capital into SOL and its ecosystem.
• Institutional players like Forward Industries are signaling a pronounced shift toward Solana, reinforcing a buying frenzy dynamic supported by liquidity and execution improvements.
• The likely approval of multiple crypto ETFs later this year is a macro tailwind that indirectly benefits SOL, even before any Solana-specific ETF comes to market.
• Technicals align with fundamentals: higher lows, constructive volume, favorable moving averages, and bullish momentum patterns support the case for an ATH retest and potential breakout toward $300+.
• Risks remain—regulatory, network, liquidity—but the balance of probabilities currently favors continued upside as on-chain usage, institutional infrastructure, and global capital alignment strengthen.
As always, this is not financial advice. Markets are volatile, and conditions can change quickly. But with treasury formation ramping, institutional flows accelerating, and technicals confirming, Solana’s next chapter is setting up to be its most consequential yet. If the current trajectory holds—anchored by the UAE treasury initiative and sustained by institutional adoption—SOL’s bid for new all-time highs and beyond looks not just plausible, but increasingly likely.
Moving Averages

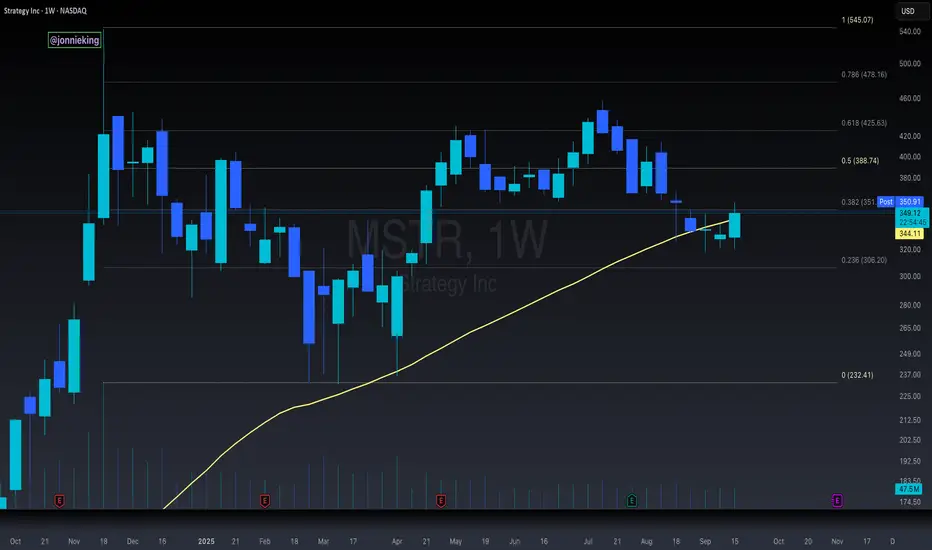
$MSTR Must Close This Week Above the 50WMA Or Else...The MicroStrategy chart is the only top signal that is somewhat cause for concern at the current moment.
You can see NASDAQ:MSTR has closed the past several weeks below the 50WMA, which signaled the start of the bear market last cycle.
Having said that, it has had a bullish rally this week and is trading above the 50WMA once again.
MSTR must close the week above this level, otherwise the stock could be in for a much deeper correction, which could negatively affect CRYPTOCAP:BTC in October.
Where have you heard that October prediction before?
Coincidence? 🥸
Intel | INTC | Long at $20This is going to be purely about technical analysis since Intel NASDAQ:INTC has a 90x P/E and has not proven themselves to be a viable challenger in the semiconductor market (yet...). Bad news could continue to destroy this ticker, but without that news, there could be some recovery in the near term.
The NASDAQ:INTC chart is in an overall downward trend. However, based on a few of my selected simply moving averages (SMAs), there is some predictability around support/resistance areas. Some of my favorite setups are a nice bounce on the lowest (green) selected SMA, occurring in October 2022 for a "rip then dip" to the second lowest (blue) - which it hit now. Often, but not always (I can't stress this enough), this green to blue SMA bounce represents a very strong support area during a downward trend. The other move is a further dip to retest the green SMA, but I suspect that would come with tremendously bad news for Intel... let's hope not, though.
Currently, NASDAQ:INTC is in a personal buy zone at $20.00 based on technical analysis only. A stop has been set if it drops below the blue SMA (which is may further test).
Target #1 = $28.00
Target #2 = $32.00
Target #3 = $60.00+ (very long-term, but high-risk unless fundamentals change)

Monolithic Power | MPWR | Long at $580.00Monolithic Power $NASDAQ:MPWR. If the semiconductor market continues to get attention in connection with AI, there may be a bounce here near $580.00 as NASDAQ:MPWR enters my historical simple moving average area. However, a further dip into the high $400s wouldn't surprise me (tax harvesting season is in session) and doesn't change the thesis as long as the overall trend continues to stay positive. While NASDAQ:MPWR is a strong company with growth predictions on the horizon, it has a 65x P/E, 46x price-to-cash flow, lots of insider selling, and some near-term concern if the economy shows weakness. From a technical analysis perspective, though, it's in an area of opportunity as long as semis stay a "hot" investment. Thus, at $580.00, NASDAQ:MPWR is in a personal buy zone.
Target #1 = $690.00
Target #2 = $745.00
Target #3 = $825.00
Target #4 = $908.00

IONQ - BREAKOUT DOWN TRENDLINEIONQ - CURRENT PRICE 48.00 - 50.00
The stock is bullish as the share price is above 50-day EMA. The lows are getting higher - indicating demand is increasing.
The stock broke out down trendline - signaling bullish momentum. This bullish outlook is strengthened by positive readings in RSI (above 50 level).
ENTRY PRICE : 48.00 - 50.00
TARGET : 59.00 and 66.00
SUPPORT : 50-day EMA (CUTLOSS below 50-day EMA on closing basis)

The 13 EMA System Rocket Booster StrategyHave you ever been labelled as a loser?
Thats what happened to me last night.
I was talking to an old buddy of mine.
He told me off.
He said:
"Lubosi you are old, grow up
and leave your parents home."
"Lubosi find a job and get married"
I replied telling him
that i have options.
In this case am talking
about crypto options trading.
Now am not in this trade.But i want to
share it with you because i appreciate
you following me.I think
i saw one of my followers
with a tag from
"the real world" i am humbled
to know that my reach goes
even to you.
You see am not the "cool" guy
but one thing about me man is that
i bust my behind to get isshh done.
Am like the video director
for the real world - That guy is cool
sadly he gets bullied. Once in a while
but they love him, because
he produces good results.
The market doesn't care about
your race, past, or present
All it cares about is what you are
going to give it today.
If you give the market high value.
You will get
high value in return
Thats why am so humbled
to be part of
this community.
My goal is to take you with me on
my journey.
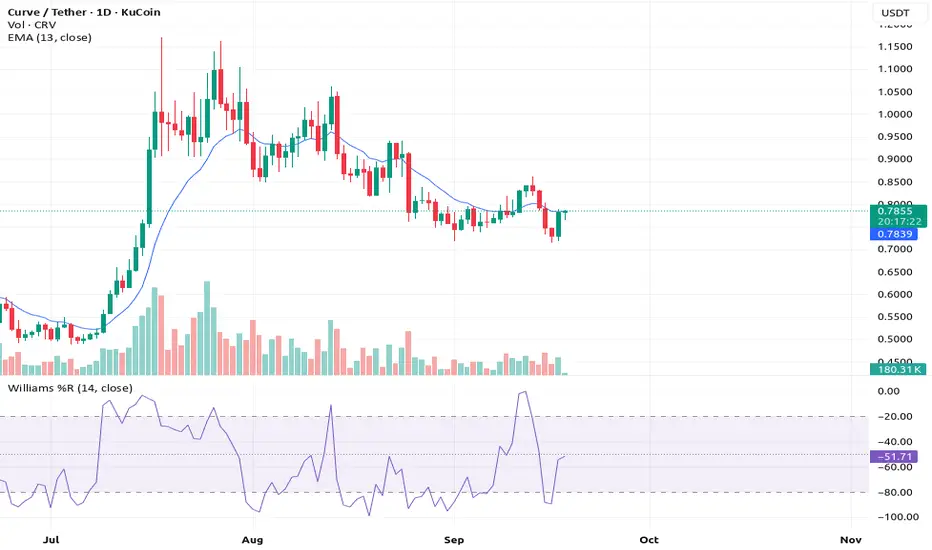
Now look at this crypto KUCOIN:CRVUSDT
its below the William %R -50
that's your entry No negotiation.
You should exit at above the -20
that's your profit taking target and risk
management no negotiation
man do it.
This is called the 13 EMA System
Rocket Booster Strategy
Rocket boost this content to learn more.
Thank you for reading.
P.S.
The entry pattern you are seeing is called the
Dragon Fly Doji
Its got a long wick at
the bottom.
I learnt this from candlestick patterns
book by Steve Nison
Thanks for reading again
remember to rocket boost the content.
So that you learn more
Disclaimer: Trading is risky please learn risk management
and profit taking strategies.Also
feel free to use a simulation trading account
before you trade with real money .
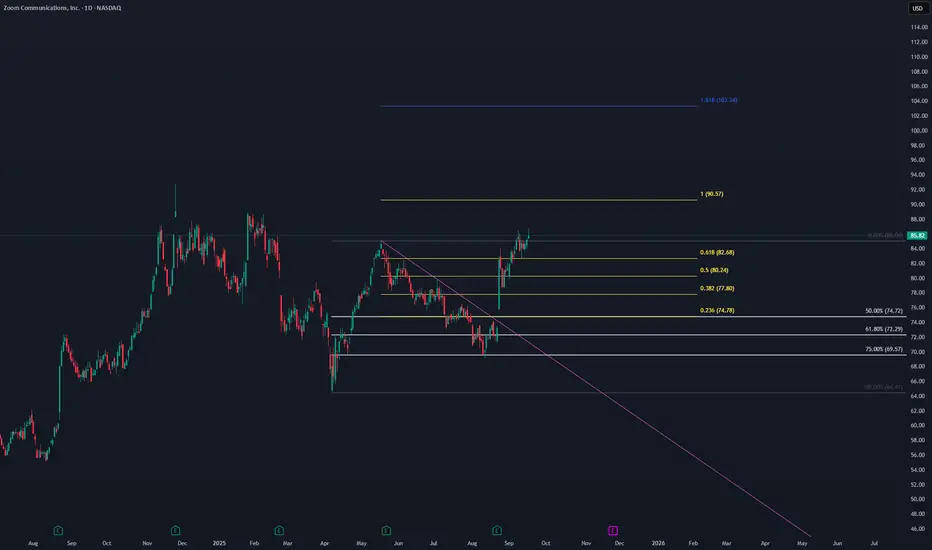
Zoom Update. Near ObjectiveLike previous analysis ZM is near to reach the objective.
FIB RETRACEMENT⮕PRICE RETRACEMENT⮕TRENDLINE CROSSING⮕FIB EXTENSION⮕TARGET THE OBJECTIVE
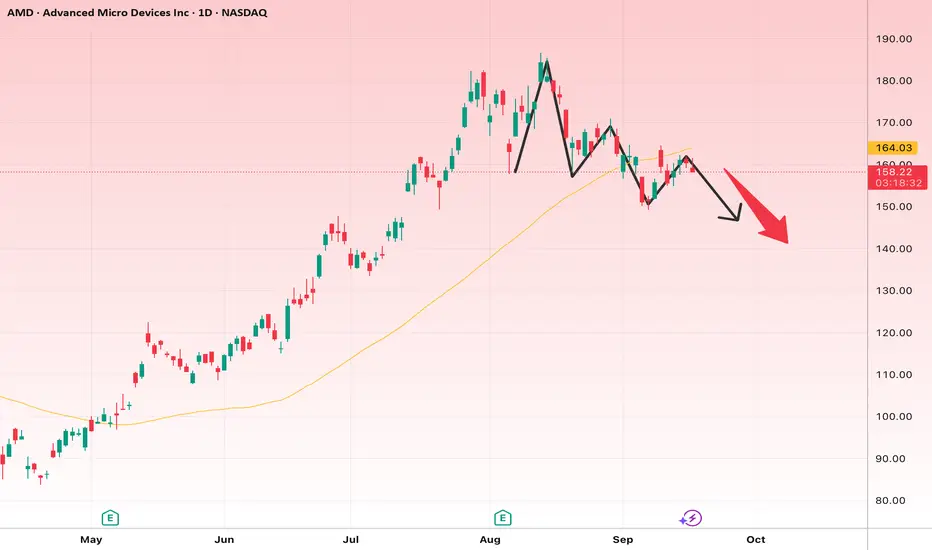
AMD at a Crossroads: Deep Correction or a Launch to New Highs?
🔎 Technical Analysis (Based on the Chart)
Recent Trend:
After a sharp rally from around $100 to nearly $180, the stock entered a corrective phase.
A series of lower highs and lower lows suggests the start of a short-term downtrend.
Price is now trading below the 50-day moving average (yellow line), which is a bearish signal.
Patterns & Price Action:
The chart shows a possible Head & Shoulders structure or at least a similar bearish formation.
The red arrow indicates potential downside movement toward lower levels.
📉 Short-Term Outlook (2–6 weeks)
Bias: Bearish
Targets:
First target: $150
Second target: $140 (if support breaks)
Stop-loss: A confirmed close above $166–168 (back above the moving average and resistance).
📈 Long-Term Outlook (3–6 months)
If the current correction extends, the stock could dip toward $135–140, then potentially start a new bullish phase.
Upside Targets:
First target: $180 retest
Second target: $200–210 if the historical high breaks
Stop-loss (long-term): A confirmed close below $135 (break of major support, trend reversal to bearish).
✅ Summary:
Short-term: Likely correction toward $150–140.
Long-term: As long as $135 holds, bullish targets toward $200 remain valid.
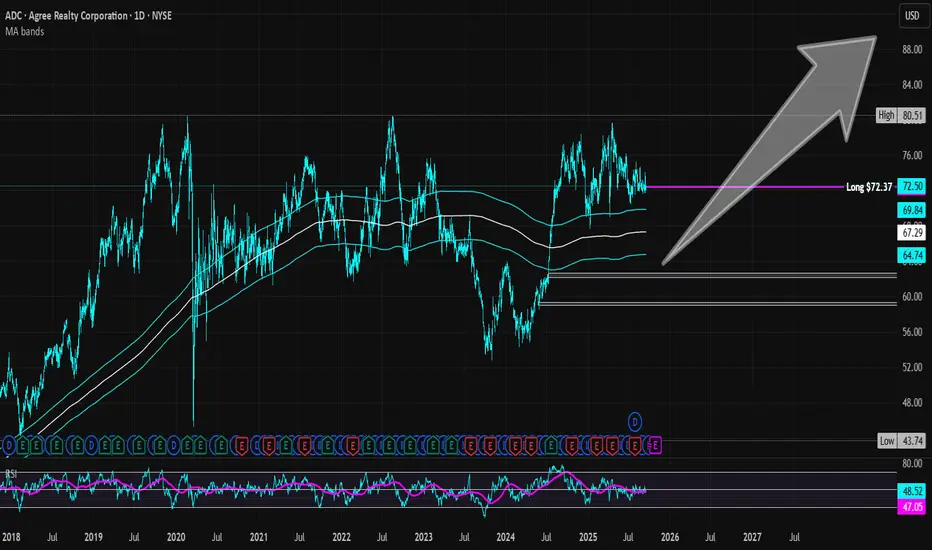
Agree Realty | ADC | Long at $72.37Agree Realty NYSE:ADC
Summary: A "boring" REIT with a 4.2% dividend, ~68% investment-grade tenants, high occupancy (~99%), average lease terms of 10+ years, which include major tenants Walmart (top tenant), Dollar General, Tractor Supply, Best Buy, Dollar Tree, TJ Maxx, O'Reilly Auto Parts, CVS, Kroger, Lowe's, Hobby Lobby, Burlington, Sherwin-Williams, Sunbelt Rentals, Wawa, Home Depot....
Technical Analysis: Cup and handle formation may be forming off the recent double bottom (bullish). Two open price gaps remain on the daily chart since 2020 (down near $59) - chance these may get closed if the market turns in the near-term. However, REITs average +30% returns within 16 months post-Fed rate cuts, so patience may benefit investors here.
Follow the Money : Insiders buying .
Company Financial Health: Strong. $2.3B liquidity, no material debt maturities until 2028, and investment-grade balance sheet (A- rating from Fitch). Debt-to-assets ~40%, covered by stable net-lease rents. Macro risks (e.g., tenant bankruptcies like At Home, consumer slowdown) exist but are mitigated by diversification. Altman Z-Score suggests low distress and no near-term catalysts for insolvency.
Earnings and Revenue Growth: ~4% between 2025 and 2027 (slow growth, but good/steady for a REIT).
Thus, at $72.37, NYSE:ADC is in a personal buy zone for a likely move up given the high probability of lower interest rates in the future. A near-term risk of a drop to $59 could occur, but REITs often move higher within 1-2 years after interest rates cuts. It's a solid company financially with a good dividend.
Targets into 2028:
$80.00 (+10.5%)
$90.00 (+24.3%)
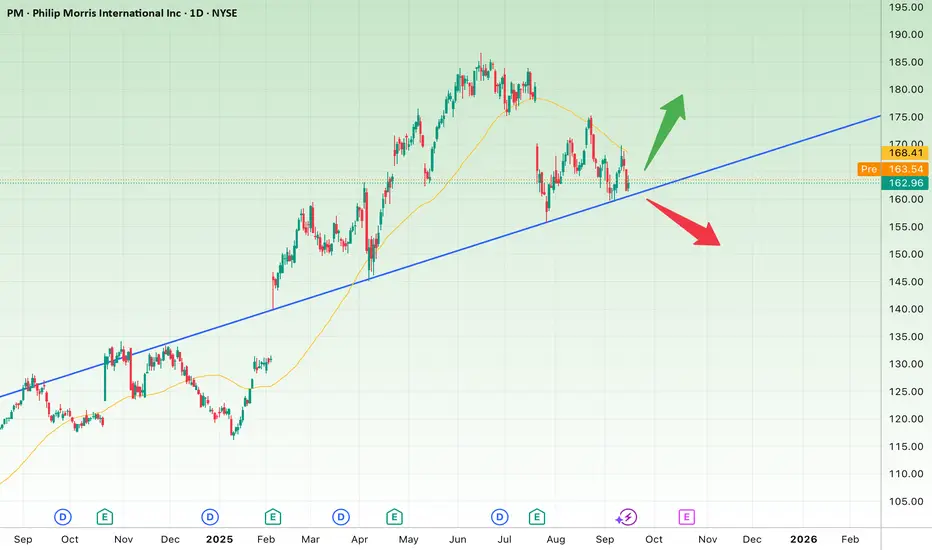
Philip Morris Turning Point: Surge to $200 or Drop to $140?
Technical Analysis
Overall Trend: The stock is in an upward channel, and the ascending trendline (blue) has been validated multiple times, showing strong price reactions.
Moving Average: The price is fluctuating near the 50-day moving average, which acts as short-term support/resistance.
Key Support: The $163–165 range aligns with the ascending trendline.
Key Resistance: $175–177 and then $185–190.
Short-Term Scenario (1–3 weeks)
Bullish Scenario:
If the price holds above the trendline ($163–165) and breaks $168.5, a rise to $175 is expected. If $175 is broken, the next target is $182–185.
Target 1: $175
Target 2: $182–185
Stop Loss: Below $162
Bearish Scenario:
If the trendline is broken and the price consolidates below $162, a drop to $155 is possible, and in the worst case, it could reach $138–140.
Target 1: $155
Target 2: $138–140
Stop Loss: Recovery and consolidation above $168
Long-Term Scenario (3–6 months)
Bullish Scenario:
If the upward trend continues and the $185–190 resistance is broken, the path toward the all-time high near $195–200 opens.
Mid-term Target: $185–190
Long-term Target: $195–200
Stop Loss: Losing support at $155
Bearish Scenario:
If the key support at $155 is broken and selling pressure continues, a corrective target around $137 is likely. This level is considered strong support on a larger timeframe.
Target 1: $155
Target 2: $137
Stop Loss: Recovery and consolidation above $175
Summary:
In the short term, traders should consider the $163–165 range as critical. Holding above it opens a growth opportunity to $175–185, but losing it could trigger a drop to $155 and $140.
In the long term, as long as support at $155 holds, the bullish trend remains dominant, and the $190–200 target remains active.
Alibaba | BABA | Long at $108.84Like Amazon, I suspect AI and robotics will enhance Alibaba's NYSE:BABA e-commerce, logistics, and cloud computing operations. There is some risk here, like other Chinese stocks, that they could be delisted from the US market if trade/war tensions rise. But I just don't think that is likely (no matter the threats) due to the importance of worldwide trade and investment. I could be way wrong, though...
NYSE:BABA has a current P/E of 14.2x and a forward P/E of 2x, which indicates strong earnings growth ahead. The company is very healthy, with a debt-to-equity of 0.2x, Altmans Z Score of 3.3, and a Quick Ratio of 1.5. If this were a US stock, investors would have piled in long ago at the current price.
From a technical analysis perspective, the historical simple moving average (SMA) band has started to reverse trend (now upward), indicating a high potential for continued (overall) price movement up. It is possible, however, that the price may reenter the SMA band in the near-term - the $80s aren't out of the question - as tariff threats arise. But that area is another personal entry zone if fundamentals hold.
Thus, while it could be a bumpy ride and the risk is there for delisting, NYSE:BABA is in a personal buy zone at $108.84 (with known risk of drop to the $80s in the near-term).
Targets into 2028:
$125.00 (+14.8%)
$160.00 (+47.0%)

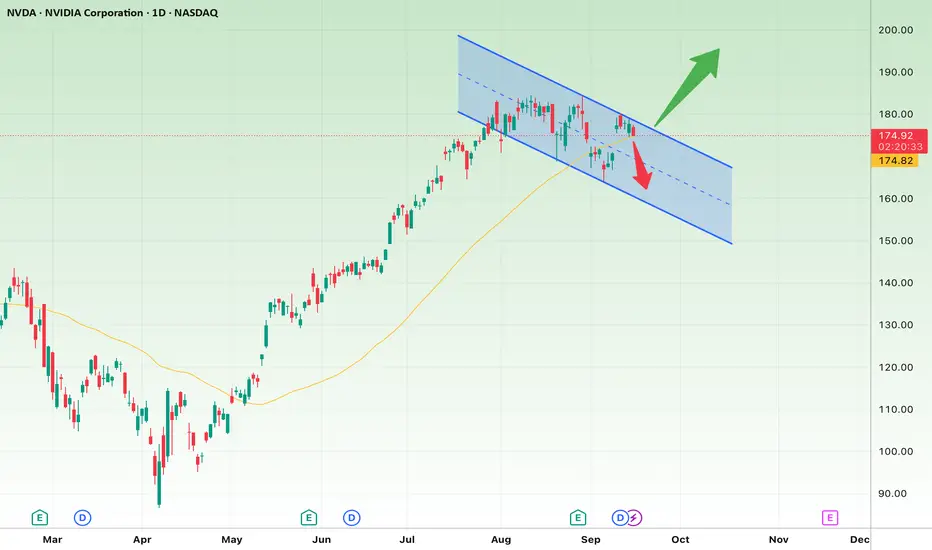
NVIDIA Analysis: Short-Term Gains & Long-Term PotentialShort-Term Analysis (1-2 weeks):
Price Action: The current price is near the lower boundary of the descending channel, with the support level around $174.80. This could act as a good entry point for a potential rebound.
Technical Insights: The chart shows a descending channel, indicating that if the price reaches the lower boundary, there's a likelihood of a short-term reversal.
Price Target: In the short term, the first target would be around $180, which is near the upper resistance of the channel. If broken, a further move toward $185 could be possible.
Stop Loss: If the support at $174.80 breaks, the stop loss could be set at $170.
Long-Term Analysis (1-3 months):
Price Action: If the price manages to break out of the descending channel, a continued bullish trend would likely push the price toward $190. This is a strong resistance level.
Technical Insights: A breakout from the descending channel would indicate a continuation of the bullish trend. In that case, the price might reach higher levels above $190.
Price Target: In the long run, if the price breaks above the channel, the next target could be $200.
Stop Loss: In case the price drops below $170 in the long term, the bearish trend would likely continue, with a stop loss set at $160.
Summary:
Short-Term: Support at $174.80, with a price target of $180 and a stop loss at $170.
Long-Term: Bullish target at $190-$200, with a stop loss at $160.
Always consider fundamental news that could significantly impact price movements.
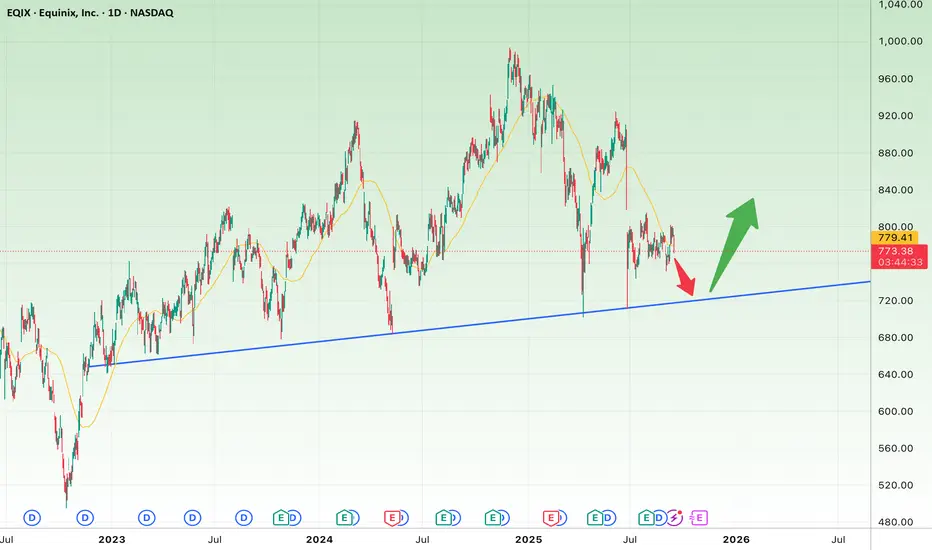
Bulls vs. Bears: Key Levels That Will Decide the Next Big Move
Long-Term View
The overall trend since 2022 is upward (supported by the rising blue trendline).
Each touch of this trendline has triggered a strong bounce.
Key long-term support: 720 – 730
Major resistances:
First: 820 – 840
Second: 920 – 950
As long as price holds above 720, the long-term outlook remains bullish. A breakdown below 720 could trigger a deeper correction toward 660 – 680 or even 590.
Short-Term View
Current price is around 770, consolidating between 720 (support) and 820 (resistance).
If candles hold above 760, price may push back to 800 – 820.
A breakdown below 760, and especially under 730, would likely send price down to retest the 720 trendline support.
Price Targets & Stop Loss
Bullish Scenario (if 730 – 760 holds)
Target 1: 820
Target 2: 890 – 920
Long-term target: 950 – 1000
Stop loss: close below 720
Bearish Scenario (if 720 breaks)
Target 1: 660 – 680
Target 2: 600 – 620
Long-term target: 570
Stop loss: recovery and close back above 750
Pro Conclusion
Short-term: Range trading between 730 – 820.
Long-term: Bullish bias remains as long as 720 holds.
Best strategy: Buy near supports (730 – 760) with a tight stop, aiming for 820+.
Globant | GLOB | Long at $55.00Globant NYSE:GLOB - an IT and software development specializing in AI-driven digital transformation and engineering. The company has partnerships with AWS, Google Cloud, Unity, and Slack, while collaborating with clients such as Google, Electronic Arts, Santander, and Rockwell Automation to deliver enterprise AI and custom software services.
Technical Analysis:
Price for NYSE:GLOB has fallen into my "crash" simple moving average zone. This often, but not always (still a "major" crash zone further down), signals a bottom. The current crash zone extends to $45 and there is a high possibility the price may dip that low in the near-term. Long-term, given the potential earnings and revenue growth, it looks undervalued at its current price.
Earnings and Revenue Growth Between 2025 & 2028
Projected Earnings Growth: ~17% increase (from ~$2.4B in 2025 to $2.8B in 2028)
Projected Revenue Growth: ~96% increase (from ~$157M in 2025 to $309M in 2028, at 28.7% CAGR).
Health
Debt-to-Equity: 0.25x (very good)
Altman's Z-Score/Bankruptcy Risk: 3.5 (excellent/very low risk)
Quick Ratio/Ability to pay current bills: 1.7 (great, low risk)
Action
Due to the good growth potential of NYSE:GLOB , the connections / partnerships it currently has with major companies, and solid financial health, I am personally going long at $55.00. More shares will be gathered if the price reaches the $40's and the fundamentals remain the same.
Targets in 2028
$75.00 (+36.7%)
$100.00 (+81.8%)

GCT - POTENTIAL 52-WEEK HIGHGCT - Current Price 31.10 - 31.20
GCT is in a healthy UPTREND because :
Price is above 50- and 200-days EMA.
A Golden Cross was formed recently, where the 50 EMA crossed above the 200 EMA (look at the blue circle).
RSI (45-period) has remained above 50 level since May 2025, showing consistent momentum buildup and buyers’ dominance.
Price is now approaching the 52-week high resistance at 34.50. A breakout above this level could trigger momentum toward the next target of 38.00 based on Fibonacci extension.
ENTRY PRICE : 30.00 - 31.20
TARGET : 34.00 and 38.00
SUPPORT : 27.50 (The low of 09 SEPTEMBER 2025 bullish white candlestick)
Notes : 1st target at 34.00 is slightly below the actual 52-week high resistance level of 34.50.

Flowers Food | FLO | Long at $13.51Flowers Food NYSE:FLO . Maker of Nature’s Own (the top-selling bread brand in the US), Wonder Bread, Tastykake, and many others, has entered my "crash" simple moving average zone. While the fall has been steep since 2022, the company is trading at a price-to-earnings of 13x (typical food industry is around 20x) and offers and 7%+ dividend. It's not a play for future growth, however, which is expected to be mild to stagnant ( based on forward annual earnings and revenue . This position is a value / dividend play given the high likelihood of lower interest rates and a certain group of investors moving out of banks and into dividend / income stocks.
So, while I wouldn't be shocked if NYSE:FLO dips into the $12 rage in the near-term, I have created a starter position in the company at $13.51. My targets are modest, although there is a blaring gap in the $27-$28 range that will likely be filled... some time.
Targets into 2028:
$14.75 (+9.2%)
$16.25 (+20.3%)

AADHAR HOUSING FINANCE ANALYSISSwing Trade :
Breakout with a good volume surge.
Can trade the breakout with a stop loss at candle low or trailing the stop loss with 10 ema or 20 ema.
Disc : My view is for educational or study purpose only.
It is not a buy/sell recommendation.

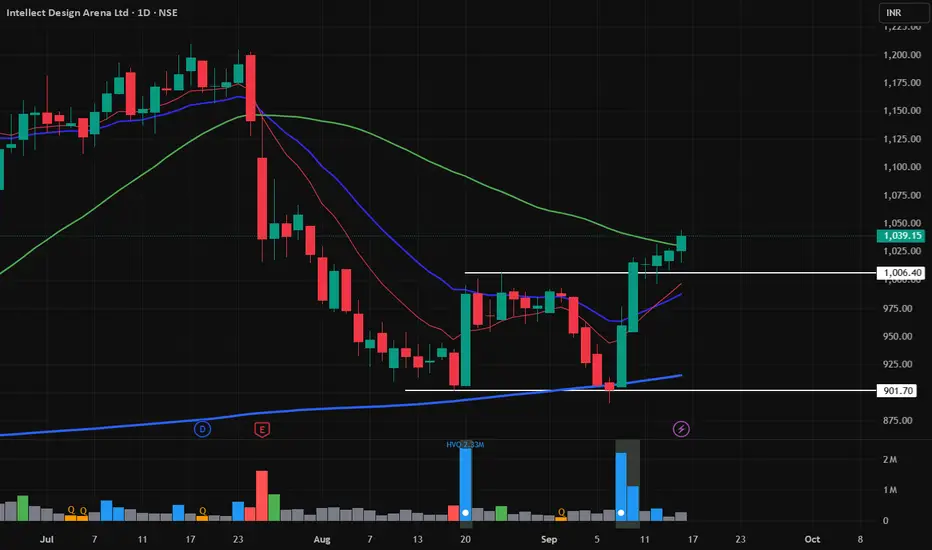
INTELECT ANALYSISSwing Trade :
Small consolidation breakout with good volumes.
Stop loss can be placed at 1000.
Disc : My view is for educational or study purpose only.
It is not a buy/sell recommendation.
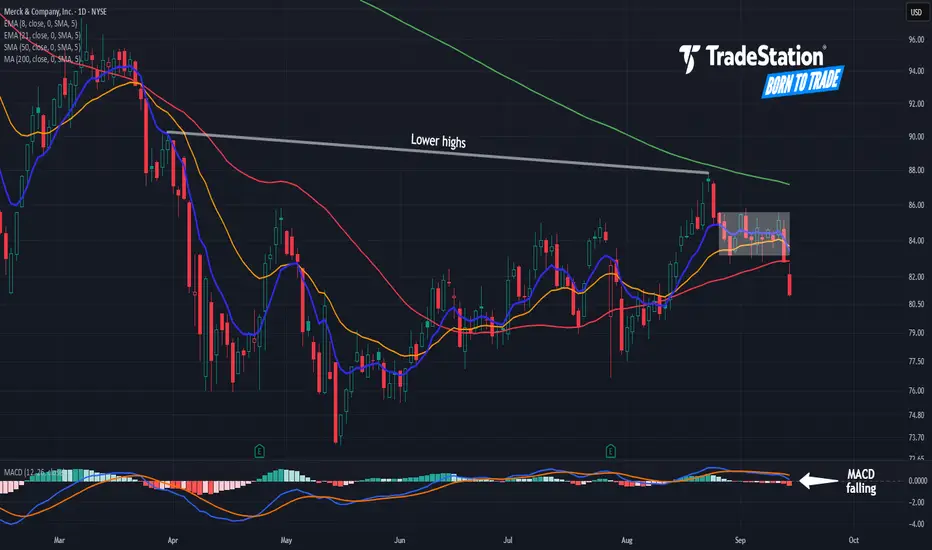
More Downside in Merck?Merck has been sliding for more than a year. Now, following a period of consolidation, some traders may see further downside risk.
The first pattern on today’s chart is the range between the August 26 high of $85.59 and the August 28 close of $83.21, where the pharmaceutical giant spent almost three weeks. It closed under support on Friday and continued lower yesterday. That may suggest that support has been broken.
Second, the 8-day exponential moving average (EMA) crossed below the 21-day EMA. MACD is also falling. Those signals could suggest the short-term trend has grown bearish.
Next, August saw a lower high relative to late March (which also featured lower peaks than previous months). That may confirm a longer-term downtrend is in effect.
Finally, MRK is back under its 50-day simple moving average.
TradeStation has, for decades, advanced the trading industry, providing access to stocks, options and futures. If you're born to trade, we could be for you. See our Overview for more.
Past performance, whether actual or indicated by historical tests of strategies, is no guarantee of future performance or success. There is a possibility that you may sustain a loss equal to or greater than your entire investment regardless of which asset class you trade (equities, options or futures); therefore, you should not invest or risk money that you cannot afford to lose. Online trading is not suitable for all investors. View the document titled Characteristics and Risks of Standardized Options at www.TradeStation.com . Before trading any asset class, customers must read the relevant risk disclosure statements on www.TradeStation.com . System access and trade placement and execution may be delayed or fail due to market volatility and volume, quote delays, system and software errors, Internet traffic, outages and other factors.
Securities and futures trading is offered to self-directed customers by TradeStation Securities, Inc., a broker-dealer registered with the Securities and Exchange Commission and a futures commission merchant licensed with the Commodity Futures Trading Commission). TradeStation Securities is a member of the Financial Industry Regulatory Authority, the National Futures Association, and a number of exchanges.
TradeStation Securities, Inc. and TradeStation Technologies, Inc. are each wholly owned subsidiaries of TradeStation Group, Inc., both operating, and providing products and services, under the TradeStation brand and trademark. When applying for, or purchasing, accounts, subscriptions, products and services, it is important that you know which company you will be dealing with. Visit www.TradeStation.com for further important information explaining what this means.
HCC ANALYSISSwing Trade :
Bullish Reversal Setup
After a good correction on weekly timeframe with low volumes , the stock took support at 200 sma on weekly timeframe.
On Daily timeframe it gave a breakout out of a small consolidation and 20 ema is breaking above 50 sma.
Stop loss can be placed at 27.4.
Disc : My view is for educational or study purpose only.
It is not a buy/sell recommendation.

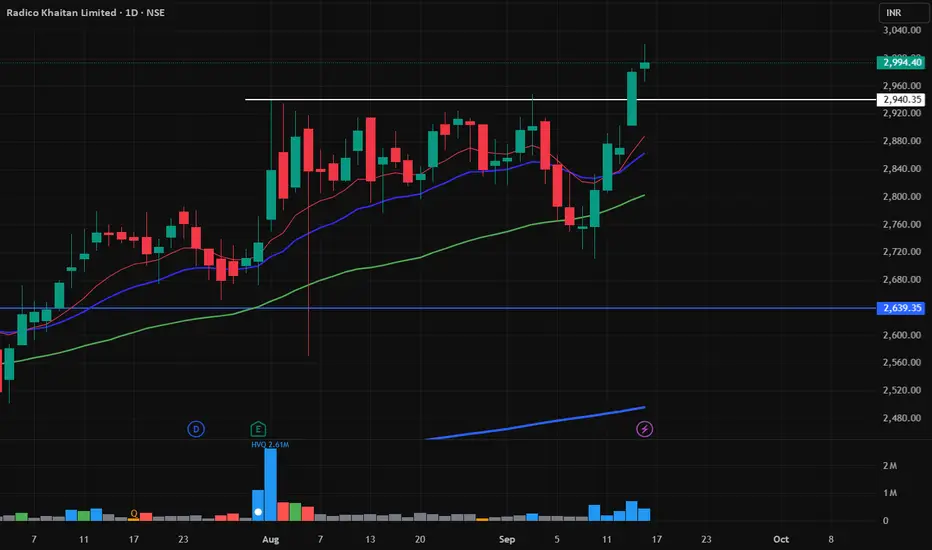
RADICO ANALYSISSwing trade :
Breakout with good volumes. Can place a stop loss at 2900 or a break below 20 ema.
Disc : My view is for educational or study purpose only.
It is not a buy/sell recommendation.
Moving Average IndicatorSnapshot of the signals provided by moving averages and the different types that can be used.

Double-Top Breakdown + Bearish MACD — Target 206Idea type: Short (breakdown) — setup confirmed by gap-down open + MACD bearish crossover
Target: 206
1) Setup — What I see
Price formed a classical double-top: two near-equal peaks with a clear neckline between them.
Break of the neckline happened on a gap-down open (strong bearish sentiment, high short interest/liquidity sweep).
MACD (12,26,9) shows a bearish crossover (MACD line crossing below signal) on the daily — momentum has turned to the downside and confirms the breakdown.
2) Primary Target:
206 — intended as the measured-move projection from the double-top pattern and reinforced by a nearby historical support zone.
Measured-move method: (Peak height) = Peak price − Neckline price. Project that distance downward from the neckline to get the target. (Use your chart’s exact peak & neckline prices to verify that this projection aligns with 206.)
