GBPNZD: Time to Buy 🇬🇧🇳🇿
GBPNZD formed an inside bar pattern, testing a key
daily horizontal support.
A bullish violation of its range with a buying imbalance signifies
a highly probable movement up.
Goal - 2.321
❤️Please, support my work with like, thank you!❤️
I am part of Trade Nation's Influencer program and receive a monthly fee for using their TradingView charts in my analysis.
Multiple Time Frame Analysis

BTC: The Key Buyer Zone Lies Even LowerThe 89,256 level remains a relevant demand zone across all timeframes — from monthly to daily. The 86,000–79,500 area is the key volume zone where a long-term buyer is most likely to appear.
Hello, traders and investors!
This analysis is based on the Initiative Analysis (IA) method.
Let’s take a look at the Bitcoin monthly chart and identify the zones where a buyer is likely to appear.
The last buyer initiative began at 74,508 and ended at 126,199.
The 50% level of this initiative — 100,353 — was already tested in November.
The key candle (marked on the chart as KC, the candle with the highest volume within the buyer initiative) sits at the base of the move.
Notably, this key candle formed as a manipulation (false breakout) of the 89,256 level.
For this reason, the 89,256 level remains highly relevant on the monthly timeframe — this is a zone where a long-term buyer may reappear.
During that manipulation, the key volume was accumulated in the 86,000–79,500 range (!).
On the weekly chart, the 89,256 level is also important — it represents the previous lower boundary of the weekly range, which is still relevant.
On the daily chart, this level remains meaningful as well, since it is an untouched target from the previous daily range (marked with a red line).
Thus, the area around 89,256 — together with the volume zone 86,000–79,500 — is a strong candidate for finding long setups.
Wishing you profitable trades!

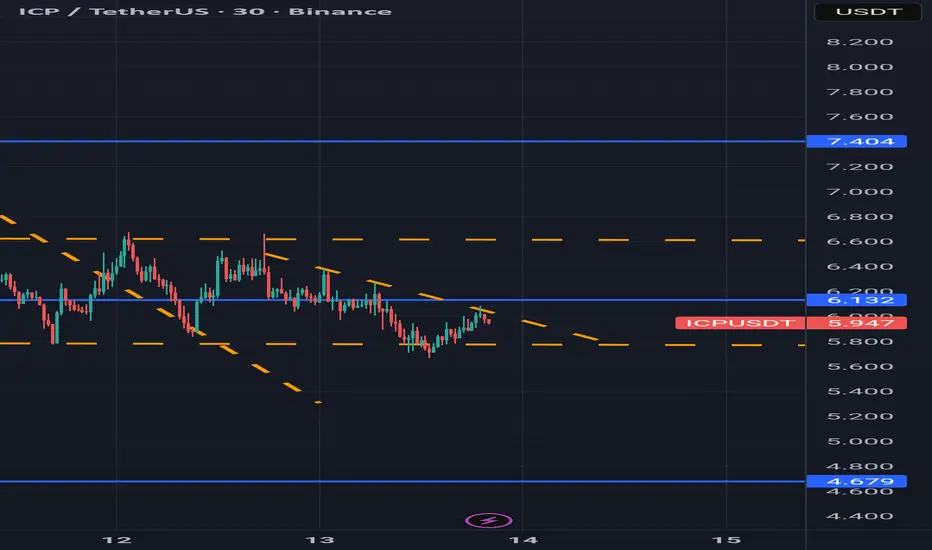
ICP range boundICP had a strong bounce off the 5.75 low and looks to be range bound between ~$5.75 and ~$6.60. It's experiencing some short term downtrend pressure at the moment, but should be moving towards high of $6.60 if the range holds.
Which way will the range break? Time Will tell.
EUR/USD - Repeat of 2015 Cycle?🔁 Is History Repeating Itself on EUR/USD?
(Monthly timeframe breakdown — impulse, consolidation, sweep, impulse, pullback… all lining up again)
Your chart highlights two major market cycles, years apart, that look almost identical in structure. Let’s walk through it clearly.
✅ 1. First Cycle (2015–2018)
A) Consolidation Phase (Orange Box)
Price moved sideways for months.
No clear direction — accumulation/distribution.
Market was building energy.
B) Sweep / Manipulation
Price dipped below consolidation lows (labelled X).
Classic liquidity grab.
Smart money entry zone.
C) Impulse Phase (Green)
Strong bullish move immediately after the sweep.
Buyers stepped in aggressively.
Market structure shifted bullish.
D) Pullback Phase (Red)
First correction after the strong impulse.
Healthy sign — market resetting before continuation.
This forms the classic 4-step macro cycle:
👉 Consolidation → Sweep → Impulse → Pullback
✅ 2. Current Cycle (2023–2025)
Your right-side circle mirrors the exact same pattern.
A) Consolidation Phase (Orange Box)
Range-bound market identical to 2015–2016.
Energy building again.
B) Sweep / Manipulation
Price runs liquidity under the range.
Same "grab the lows before reversing" behaviour.
C) Impulse Phase (Green)
Strong bullish run out of the sweep.
Again, identical structure as the previous cycle.
D) Pullback Phase (Red)
Market currently correcting.
Exactly like the 2017 correction before continuation.
🔥 3. Are We Literally Repeating the Same Playbook?
Yes — the structure is almost a 1:1 replica.
Both cycles show:
✔ Long consolidation
✔ Sweep of the lows
✔ Major bullish impulse
✔ Initial corrective pullback
This suggests that EUR/USD is following the same macro script it used last time before rallying even further.
📈 4. What This Might Mean for Traders
If history continues to rhyme:
The current pullback may be the “reset” before another bullish leg.
The last time this pattern formed, price continued higher for months.
Smart money behaviour (sweep → impulse → pullback) indicates bullish continuation is likely, unless the pullback breaks the previous swing low.
🎯 5. Bottom Line
Yes — history is repeating itself.
The same 4-stage macro cycle is unfolding again:
Consolidation → Sweep → Impulse → Pullback → (Potential continuation)
Your chart perfectly highlights the symmetry, and traders should take note:
📍 If the macro structure remains valid, EUR/USD may be gearing up for another HTF bullish continuation.

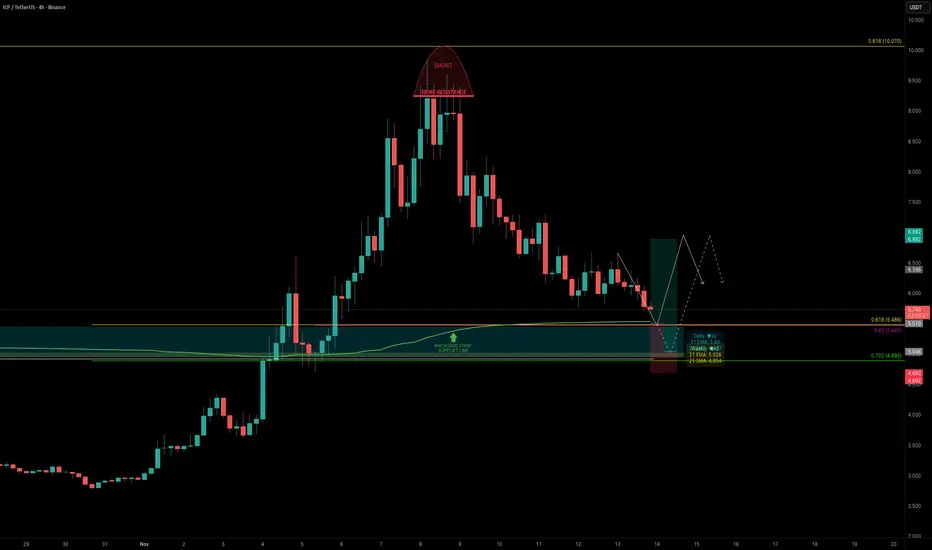
ICP — Identifying the Next High-Probability Long OpportunityICP had a great start to November, rallying over +250% in just 8 days before topping out just below the 0.618 Fibonacci retracement (~$10), right at the $3B MC resistance.
Over the past 5 days, ICP has retraced -42% from the high. The key question now: where is the next high-probability long opportunity?
Key Confluences around the $5.5 Zone
One level that stands out strongly is the $5.5 zone, where several major supports align:
0.618 Fib retracement of the entire +250% rally
0.85 Fib retracement of the smaller internal wave aligns right with the major 0.618 level
Anchored VWAP (280 day) clustering right around $5.5, adding volume-weighted support
Quarterly VWAP currently sits near $5.62
Daily 21 EMA at $5.45
Weekly 21 EMA/SMA both at around $5
$5.5 = $3B market cap
Point of Control (POC) of the past ~280 days sits around $4.9, marking it as the final major support layer below
🟢 Trade Setup Plan
Entry Zone: $5.6 – $5.0
Stop-Loss: Below POC
Targets:
TP1: $6.0
TP2: $6.9 (VWAP resistance / 0.382 Fib)
TP3: 0.618 FR
Risk/Reward: 1:2+, depending on entry precision
🔍 Indicators used
Multi Timeframe 8x MA Support Resistance Zones → to identify support and resistance zones such as the daily/weekly 21 EMA/SMA.
➡️ Available for free. You can find it on my profile under “Scripts” and apply it directly to your charts for extra confluence when planning your trades.
_________________________________
💬 If you found this helpful, drop a like and comment!
Long trade Pair: ETHUSDT
Date: Wed 12th Nov 25
Time: 6.30 pm
Session: Tokyo PM
Direction: Buyside
Timeframe: 15-min Execution
🔹 Trade Details
Field Value
Entry 3410.66
TP 3623.43 (+6.23%)
Stop 3368.96 (–1.23%)
RR 5.1: 1
🔹 Technical Context
Model: FVG → Inducement → BOS → Mitigation Entry
📝Higher-Timeframe Bias
The chart shows ETH sweeping a major HTF discount zone around 3200–3240, which aligns with Base Level 3244.28. This region acted as a Sell climax, Secondary test (Wyckoff Phase B/C), and Liquidity grab beneath all previous London and NY lows. FVG between ~0.62–0.70 retracement zone. It remained untouched, leaving a clear inefficiency target for a mitigation tap.
Before price tapped the FVG, ETH created:
A micro liquidity shelf and consecutive equal lows during Tokyo → London
Narrative:
Price swept the HTF base level around 3240, confirming bullish accumulation. Multiple session lows were engineered then taken (Tokyo → London → NY), creating strong sell-side liquidity. After displacement, ETH left a clean bullish FVG, whose price never fully mitigated. A shallow 0.25 pullback created inducement, ensuring weak hands entered early. Once the BOS printed, the price sharply retraced into the FVG, Discount Fib zone, Breaker block, and Tokyo PM session demand, creating an algorithm-driven entry.
🔹 Sentiment / Narrative Context
Liquidity vacuum above 3500 with clean inefficiencies makes buyside continuation likely.
Broader sentiment remains positive as the market left a re-accumulation range rather than a distribution. Volume aligned with bullish displacement — institutions supporting the move.
No major macro headwinds at this moment; volatility stable and favouring upward expansion.

Bitcoin - Why everyone is probably wrongYou may have noticed published ideas on tradingview.com are now calling for price action to take one direction and that direction is down. Don’t take my word for it, click on BTCUSD pair to the bottom right of this screen and then ‘ideas’ then ‘Recent’. A significant number of analysts are “short” at this time.
The number of short ideas should not be surprising, there is tens of millions of dollars in short interest around the 74-75k area waiting to be liquidated.
Two falling wedge patterns are shown on the above 1-day chart. All too easily these patterns produce false breakouts. How do you verify? Verification is made in a similar way to the recently published “How to void or validate a head and shoulders pattern” (idea linked below). We achieve validation by observing the movements of the oscillators.
1) A cross up of 20 indicates momentum is returning to the market. Look left.
2) Momentum oscillators cycle from above 80 to below 20 the majority of the time between 20 to 30 days. Look left and confirm, don’t take my word for it! At this time 26 days have passed since Stochastic RSI was above 80.
3) Considering points (1) and (2) the falling wedge now has a high probability of confirming the continued uptrend.
4) The wedge target area may be forecast by measuring the flagpole height (black circles). You can observe how accurate the first wedge target was forecast using this process. The forecast for the 2nd wedge is shown, towards the 115k area.
5) The 115k target area was first forecast from the “Is Bitcoin about to rally to 110-120k” idea (linked below) in July 2022 as price action was around $18k using the same method described above.
6) When the target is reached the bull market is over. There will be calls from all quarters informing us how price action is now going to $250k and beyond. Ignore it. The next macro long opportunity will be in 2026.
Is it possible price action continues correcting from the new all time high? Sure.
Is it probable? No
Ww
How to void or validate a head and shoulders pattern
Is Bitcoin about to rally to 110-120k

EURUSD Sells?Price is currently at an active Supply zone. Bearish price action is justified.
But I'll wait for price to sweep the recent high and mitigate on premium supply. I'll start selling from 1.16067 once confirmations are met.
NB: This is a low probability setup. Manage risk!!

AUDUSD short setup2 Supply Zones. But I'll chose the closer one for now since it swept liq(x) before bearish move.
This is a low probability setup. Manage risk effectively.

USDCHF Buys?Following CADCHF. Buys at Current Demand zone after price swept the low right above it.
The question is whether that Demand zone is still active to hold?
Manage risk effectively!!

XAU/USD 13 November 2025 Intraday AnalysisH4 Analysis:
-> Swing: Bullish.
-> Internal: Bullish.
Analysis and bias remains the same as analysis dated 20 October 2025.
Price has printed as per previous intraday expectation by printing a bearish CHoCH which indicates, but not confirms, bullish pullback phase initiation.
Price is currently trading within an established internal range, however, I will continue to monitor price with regards to depth of pullback.
Intraday expectation:
Price to continue bearish, react at either discount of 50% internal EQ, or H4 supply zone before targeting weak internal high priced at 4,380.990.
Note:
The Federal Reserve’s sustained dovish stance, coupled with ongoing geopolitical uncertainties, is likely to prolong heightened volatility in the gold market. Given this elevated risk environment, traders should exercise caution and recalibrate risk management strategies to navigate potential price fluctuations effectively.
Additionally, gold pricing remains sensitive to broader macroeconomic developments, including policy decisions under President Trump. Shifts in geopolitical strategy and economic directives could further amplify uncertainty, contributing to market repricing dynamics.
H4 Chart:
M15 Analysis:
-> Swing: Bullish.
-> Internal: Bullish.
Price did not print according to my analysis. Price instead targeted strong internal high by printing a bullish iBOS.
This could potentially indicate H4 bearish pullback phase is complete.
Price has since printed a couple of bearish CHoCH's, however, I will not mark them as such due to very insignificant depth of pullback.
Intraday expectation:
Price to indicate bearish pullback phase initiation by printing a bearish CHoCH. CHoCH positioning is demoted with a blue horizontal dotted line.
Note:
Gold remains highly volatile amid the Federal Reserve's continued dovish stance, persistent and escalating geopolitical uncertainties. Traders should implement robust risk management strategies and remain vigilant, as price swings may become more pronounced in this elevated volatility environment.
Additionally, President Trump’s tariff announcements, particularly against China, are expected to further amplify market turbulence, potentially triggering sharp price fluctuations and whipsaws.
M15 Chart:

EURNZD: Strong Bullish Confirmation 🇪🇺🇳🇿
Quick update for EURNZD.
Retesting the upper boundary of a major demand zone on a daily,
the price bounced and violated a resistance line of a falling channel
on an hourly time frame.
Probabilities are high that we will see a pullback from that.
Goal - 2.059
❤️Please, support my work with like, thank you!❤️
I am part of Trade Nation's Influencer program and receive a monthly fee for using their TradingView charts in my analysis.


GBPUSD: Testing Daily HTLKey Observations
- On the D1 TF, price is in a downtrend; however, it's currently testing a key HTL
- If price is able to hold below this level, this is a good indication of keeping my bearish bias
- However, the bullish daily bars is not a great sign for downside strength
- ATL had to be drawn multiple times, which is signaling a weaker price action and a point of concern for the downtrend strength

LONG ON BTC/USD (BITCOIN)Bitcoin has given us a retracement to the demand zone it created after it gave a change of character from down to up.
I expect bitcoin to rise to fill imbalance to the upside for about 15k-20k points.

Long trade
1Hr TF overview
📘 Trade Journal Entry
Pair: XAGUSD
Date: Thu 6 Nov 2025
Session: Tokyo → London → NY PM overlap
Direction: Buy-side Trade
Timeframe: 1 Hour
🔹 Trade Details
Entry: 48.1296
Take Profit (TP): 52.9400 (+9.94 %)
Stop Loss (SL): 47.9743 (–0.30 %)
Risk / Reward (RR): 33.30 R
🔹 Market Context
🧾The broader structure shows a reaccumulation base forming between 47.9 – 48.4 following an extended markdown in late October.
🧾Multiple Fair Value Gaps (FVGs) stacked between 48.2 – 49.0 serve as bullish continuation footprints.
🧾The KAMA (Adaptive MA) has turned upward, confirming regained momentum and transition into a markup phase.
🧾Consecutive session overlaps (Tokyo, London, NY) displayed defended lows with consistently higher lows, validating institutional accumulation.
🧾The premium liquidity objective sits within the 52.9 imbalance zone — an unmitigated HTF supply area.
🔹 Model Type
Re-accumulation → Breaker Block → FVG Continuation Model
Market structure shifted bullish after a CHOCH above 48.4.
Entry positioned within the re-test of the mid-range FVG / OB confluence zone.
Target seeks completion of the macro inefficiency left from October’s selloff.
🔹 Execution Notes
Trade executed on the retest of the bullish FVG with session volume confluence.
Stop anchored below the protected low (47.97). TP mapped just below the imbalance ceiling (52.94) for precision exit ahead of the premium liquidity pool. Entry aligns with breakout-retest structure and confirmed KAMA slope reversal.
🔹 Trade Narrative
This Silver trade captures a continuation leg out of accumulation — transitioning into a mid-cycle markup. Price action presented a classic discount entry within structural demand, supported by rising volume and session timing alignment. The 48.1–48.3 entry zone represents optimal efficiency entry within a clear bullish shift, projecting a move toward the higher-timeframe imbalance at 52.9.

Long trade
1hr TF overview
📘 Trade Journal Entry
Pair: ETHUSDT.P (Perpetual Contract)
Date: Wed 12th Nov 2025
Time: 7:00 AM
Session: London to New York Session AM
Direction: Buyside Trade
Timeframe: 15-Minute
🔹 Trade Details
Entry: 3552.98
Profit Level (TP): 3807.27 (+7.17%)
Stop Level (SL): 3530.45 (–0.63%)
Risk-Reward Ratio (RR): 11.31
🔹 Technical Context
Market Structure:
🧾Prior Consolidation Phase at top range followed by a significant markdown breaking below structural support.
🧾The secondary retest formed at the base level (3244–3200 zone) aligned with liquidity grab beneath prior lows (PDL).
🧾Subsequent shift in structure (CHOCH → BOS) on the 15M chart suggests transition from distribution to early accumulation.
Key Confluences:
🧩Fair Value Gaps (FVGs) identified within the 0.75–0.25 retracement zone, acting as re-entry and mitigation areas.
🧩Breaker Block formation confirmed following BOS, validating bullish continuation setup.
🧩Volume expansion visible around 3550 region, signalling strong buy-side interest.
🧩Kaufman Adaptive Moving Average (KAMA) providing dynamic trend support near 3475 level.
📈Target Narrative:
We assume that price aims to rebalance inefficiency toward the 3,800–3,850 liquidity zone, corresponding to prior unmitigated FVG and institutional range midpoint.
🔹 Narrative & Sentiment
The setup reflects a buyside re-accumulation model emerging from deep discount levels post-sell climax. The corrective structure within the descending wedge aligns with the Wyckoff “Spring” and “Test” phase, suggesting smart money re-entry before expansion.
Macro sentiment also supports ETH strength into mid-November amid rotational flow from BTC dominance cooldown and speculative positioning ahead of CPI data.

USDCHF LONG Market structure bullish on HTFs DW
Entry at Both Weekly And Daily AOi
Weekly Rejection at my AOi
Previous Weekly Structure Point
Daily Rejection at AOi
Previous Daily Structure Point
Daily EMA retest
Around Psychological Level 0.80000
H4 Candlestick rejection
TP: WHO KNOWS!
Entry 100%
REMEMBER : Trading is a Game Of Probability
: Manage Your Risk
: Be Patient
: Every Moment Is Unique
: Rinse, Wash, Repeat!
: Christ is King.

Long trade 📘 Trade Journal Entry
Pair: ETHUSDT.P
Date: Thu 7 Nov 2025
Session: London → New York AM
Direction: Buy-side Trade
Timeframe: 1 Hour
🔹 Trade Details
Entry: 3202.91
Take Profit (TP): 3803.73 (+18.76 %)
Stop Loss (SL): 3181.80 (–0.64 %)
Risk / Reward (RR): 28.54 R
🔹 Market Context
The structure shows a clear Selling Climax with heavy volume expansion, signalling the potential completion of the markdown leg.
🧾A Secondary Re-test at the 3200 base level confirms buyer absorption and shift in short-term order flow.
🧾The Consolidation Phase and Preliminary Stop above mark prior distribution range now serving as the target zone (premium liquidity pool).
🧾KAMA (MA) flattening suggests a transition from distribution to accumulation.
🧾Price defended the POI (Point of Interest) at ≈ approximately 3244, forming higher lows in the intraday structure — confirmation of buyside intent.
1Hr TF
🔹 Model Type
Accumulation → Re-accumulation → Continuation Model
🧾The setup follows a textbook Wyckoff Accumulation: Selling Climax → Automatic Rally → Secondary Test → Spring → Markup.
🧾The Spring formed via liquidity sweep below 3200, reclaiming structure with strong close and volume support.
🔹 Execution Notes
Entry refined at re-test of the spring low on volume tapering (sign of absorption).
Risk confined below the Selling Climax wick. Target placed at prior consolidation premium zone (≈ 3.8 k) aligning with inefficiency fill. Volume profile and session timing support entry during London–New York overlap, consistent with institutional execution windows.
🔹 Trade Narrative
This ETHUSDT setup captures a phase-transition shift from markdown into early markup.
After the Selling Climax, the market re-tested structural demand at 3200 — confirming buyer presence. The confluence of liquidity sweep, volume divergence, and EMA / KAMA flattening provides a strong foundation for a buyside reversal.
🧩The trade aims to ride the short-term expansion leg toward the higher-timeframe premium zone, capturing displaced liquidity left by prior distribution. A clean break and close above 3.4 k would further confirm continuation toward the 3.8 k objective.

Stellar's(XLM) trajectoryConsidering the price hitting the supply zone (green area) and consuming the orders in that zone along with the reaction it has shown, now if the market also consumes the supply zone (orange area) and breaks through it, we expect the continuation of the upward movement to the next levels. BINANCE:XLMUSDT

XAU Mid Buying ModelHello everyone, Welcome to the XAU-SYNDICATE...
This is my entry model for buying. so I'll wait for my zone, as soon as the price reaches my zone I'll look for a INT.IDM hunt or M15 single bullish candle close above 3916 second confirmation and plan my trade accordingly.
#XAU-SYNDICATE

AUDJPY Buy Setups. LearnThis setup has always been effective. After every sweep of liquidity to an active demand or Supply level, price often creates a Market Structure shift indicating current trend reversal, then it creates another low/high close to another Demand and supply zone newly created and breaks structure (BOS). Now price will come back to sweep the low close to Demand or Supply area and then continue moving in intended direction!
But in a case whereby there was no low or high formed before break of Structure, That's when Engineered Liquidity concept is applied. Learn and Apply!!
