XAUUSD: record January volumeHi traders and investors!
Monthly timeframe.
The trading volume in January 2026 exceeds all previous readings, which may indicate that the phase of rapid growth is coming to an end and the market is transitioning into consolidation or a correction.
On the monthly chart, two key levels stand out where long-term buying may be considered — but only if a valid buy pattern forms: 4435, the 50% level of the trading range, and 4381.
Daily timeframe.
The price has already reached the first key level at 4755 and reacted with a bounce. The next nearest daily levels where a buy pattern could be considered are 4642 and 4536.
At the same time, it is important to keep in mind that the January 30 candle is a seller candle with the largest volume in history, which formed a seller zone.
The lower boundary of this zone is 5157.
A strong short reaction may develop from this level, which should be taken into account when looking for long positions and setting targets.
Additionally, there is a price gap on the daily timeframe between 4642 and 4536, toward which the price is likely to gravitate.
Hourly timeframe.
A seller initiative is currently active. The key candle (the highest-volume candle within this initiative) has already been tested. The test level is 4948.
Short positions may be considered in the case of a manipulation of the 4948 level (false breakout), should this scenario unfold.
Profitable trades!
This analysis is based on the Initiative Analysis (IA) method.
Multiple Time Frame Analysis

Silver: record volume at the highs — selling priorityThe price corrected with a wick below the second zone (86.5–80), but ultimately held within it, stopping at 85.18.
Hi traders and investors!
Weekly timeframe
The price came close to, but did not quite reach, the lower boundary of the buyers’ initiative at 70.07 and technically may still move into this area.
At the same time, in the latest weekly candle the main volume was accumulated at the top, within the 107,000–113,000 range.
This is the largest weekly volume in history (!).
Daily timeframe
The daily chart shows a similar picture: the candle also printed record volume (!), with volume again accumulated in the upper part of the candle.
Given the overall context, buying is not a priority — it is more reasonable to focus on selling setups.
Hourly timeframe (H1)
On H1, the seller’s initiative is in control, and its range is clearly visible on the chart.
There was a test of the key initiative candle (KC on the chart).
Short positions may be considered on a manipulation (false breakout) of the test level at 86.50. An additional confluence would be price interaction with the 50% of the trading range at 88.70.
It is also visible on the hourly chart that volume has started to build around the daily level at 84.03. If volume accumulation continues, a bounce toward the 104,000–108,000 area is possible, where short positions can again be considered.
Profitable trades!
This analysis is based on the Initiative Analysis (IA) method.

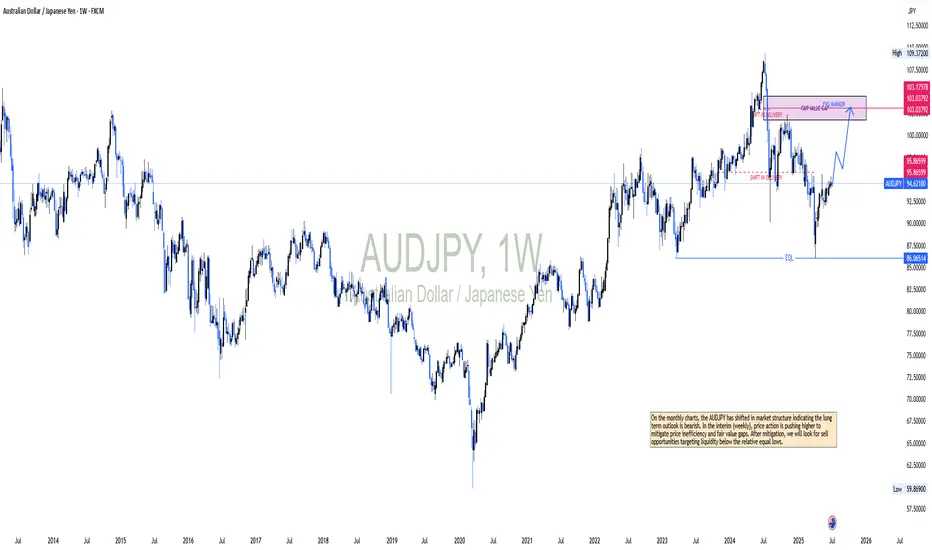
AUDJPY OUTLOOKOn the monthly charts, the AUDJPY has shifted in market structure indicating the long term outlook is bearish. In the interim (weekly), price action is pushing higher to mitigate price inefficiency and fair value gaps. After mitigation, we will look for sell opportunities targeting liquidity below the relative equal lows.
US OIL OutlookPrice is getting to supply zones. I already have a limit order above.
I'll look for sell entries when price gets to 6700 area, if none is found I'll keep buying till my big bag sell order.

US OIL SELLSOpen sell positions rn at OB asap. Am bearish for the day.
Please manage risk well. Dont risk all your money.

GBPUSD OUTLOOK FOR THE WEEKFX:GBPUSD
If you wish, you can taka a buy from that indicated "strong low" to our sell zone.
but be risk aware.

Gold Outlook Anticipating Buys from here if we get a 4hr shift in orderflow. Viewing January low as the sellside liquidity which provided the Crack in correlation, I can then use that to gauge a potential disinterest to proceed lower.
Will see how the upcoming month proceeds.

Short trade Trade Details
Entry: 82,996.41
Take Profit: 80,831.97 (2.60%)
Stop Loss: 83,240.22 (0.29%)
Risk–Reward: 8.88R
🔴 Directional Bias
Sell-side continuation following buy-side failure:
🧠 Market Sentiment
Prior sessions engineered buy-side liquidity above equal highs
London AM opened with a failure to sustain above the value
Aggressive rejection from the premium confirms the distribution is complete
Sentiment flipped decisively bearish as trapped longs were forced to exit
This reflects institutional unloading, not retail noise.
🧩 Structural Context
Clear lower high formed after buy-side sweep
Breakdown below the intraday range support
Bearish displacement confirms BOS to the downside
No bullish response on retest → sellers in control
Structure strongly favours sell-side expansion.
📊 Liquidity & Value
Entry taken after:
Buy-side liquidity taken
Return to inefficiency / FVG
Price accepted below prior value → premium distribution confirmed
Downside liquidity resting toward prior range lows
We assume this is a liquidity-driven continuation, not exhaustion.
⏱️ Session Advantage (London AM)
London is the primary distribution window
Ideal for:
Reversals after Asia manipulation
Trend continuation after NY positioning
Lack of early London bid strength validated the short bias
Session timing adds a probability edge.
❌ Invalidation Criteria
Reclaim and acceptance above London highs
Bullish displacement through the premium
Failure to expand after sell-side entry
None present at execution.
🧾 Summary
BTCUSD shows sell-side continuation sentiment following a London-session rejection from premium after buy-side liquidity was taken. Bearish BOS and acceptance below the value support further downside expansion toward resting liquidity.


Structure Under ReviewContext: BINANCE:BTCUSDT | Higher Time Frame (HTF) Fractal Read | 6M + 3M
We’re trading an HTF decision pocket where the 3M structure is attempting a higher-low , while the 6M candle is warning of a larger mean-reversion . The key is understanding which fractal is in control — because once one fractal fails, the next one activates.
---
6M: “Critical point” vs “Opportunity zone”
On the 6-month chart, the market has printed a powerful expansion leg, followed by a sharp pullback candle (classic HTF profit-taking / supply response after an impulsive mark-up). That’s not automatically bearish — it’s the market rebalancing after an aggressive premium auction.
The long-term takeaway is simple:
* Ascending bottoms on the 6M have historically been the “highest quality” opportunities because they occur at HTF discount inside a broader adoption trend.
* Structurally, anything above ~15.5k keeps the macro sequence in an “ascending bottom” regime — impatience reads this as a problem; long-horizon positioning reads it as inventory offered at a discount .
The near-term risk sits above that macro floor: HTF pullbacks can stretch further than most expect if a key pivot fails.
---
3M: Correction triggered; 0.886 is the battleground
The 3-month correction effectively began once price lost ~105.1k , confirming a transition from expansion to retracement on this fractal.
Using the Fibonacci retracement from $74,508 (previous swing low) to the ATH $126,199.63 , the market rotated down into the 0.886 region (~$80,351) — and that’s exactly where we’d expect buy-side defense if a 3M higher-low is going to form.
This is the line in the sand:
* $80,600 is the pivot that must hold to keep the 3M higher-low thesis intact.
* Acceptance below that pivot (especially on HTF closes) materially increases the probability that:
1. the 3M higher-low attempt fails, and
2. the 6M corrective fractal takes control.
Upside sequencing (if the base holds):
A constructive path is reclaiming/re-accepting successive fib shelves (treat these as *decision points*, not guarantees):
0.786 ~ 85.5k → 0.705 ~ 89.7k → 0.618 ~ 94.2k → 0.5 ~ 100.3k → 0.382 ~ 106.4k → 0.236 ~ 114.0k
Each level is a *reaction zone* where supply can reappear; the tape must prove acceptance.
---
6M: If the market hands control to the higher fractal, here’s the map
This panel is the institutional “if/then” framework: we don’t assume we’ll tag every level . We mark the levels where the auction is most likely to pause, rebalance, and reveal intent .
If the market transitions into a 6M mean-reversion leg , the key fib “discount shelves” on this timeframe become the next evaluation zones:
* 0.382 ~ 83.9k
* 0.5 ~ 70.8k
* 0.618 ~ 57.8k
* 0.705 ~ 48.1k
* 0.786 ~ 39.2k
* 0.886 ~ 28.1k
How this gets traded institutionally:
* You don’t “blind buy” every line — you audit acceptance/rejection , displacement, and follow-through at each shelf.
* Trends are fractal: a 3M failure is often the ignition for a 6M rotation . Conversely, a defended 3M base often becomes the springboard back into expansion.
---
Execution mindset
This is a location-based thesis, not a prediction:
* Above 80.6k: the market is still attempting a 3M higher-low (risk contained to the smaller fractal).
* Below 80.6k (HTF acceptance): odds shift toward a larger 6M corrective auction (bigger swings, wider risk bands).
Not financial advice.

Nasdaq (Futures) - 1,100-1,300 Ticks Swing OpportunityBullish Strength All Week, Above $26,000 - $26,200 Until Thursday Came Around. The Selling Pressure Was So Great, The Majority Of Gains Throughout The Week Vanished!
I Am Studying Obvious Levels Of Liquidity And Based Of My HTF Analysis, We Could Be In For A Continuation To The Downside With My Interest Resting Below 25365.25 Which Is Over 1,000 Ticks.
Next Weeks NWOG Will Give Me A Clearer View Of When This Delivery Can Occur.
A Premium Gap Open Could Signify One Last Short-Term Rally, Catching Those Who Has Held Onto Their Position Throughout The Weekend And Placed Their Stop Loss Above $25,940 & $26,050

Long trade 🥈 SI1! — Buy-Side Sentiment & News Analysis (1-Hour)
Date: Mon 28th Jan 2026
Session: NY Session AM
Execution Time: 3:45 pm
Trade Details
Entry: 115.270
Take Profit: 122.555 (6.32%)
Stop Loss: 114.785 (0.42%)
Risk–Reward: 15.02R
🟢 Directional Bias
Buy-side continuation/expansion:
Silver is in a clear re-pricing phase, transitioning from accumulation into sustained expansion, supported by both technical structure and macro conditions.
🧠 Market Sentiment Overview
Prior consolidation resolved decisively to the upside
Pullbacks into value were shallow and aggressively bought
Buyers showed strong acceptance above prior resistance
This reflects institutional accumulation and the continuation of a trend, not speculative exhaustion.
🧩 Structural Context
Higher-high / higher-low sequence firmly established on the 1H
No bearish CHoCH or structural failure
Break and hold above prior range highs confirms trend continuation
Structure strongly favours further upside rather than mean reversion.
📊 Volume Profile & Value
Acceptance above prior value high / POC
Volume supports higher prices — no high-volume rejection
Value migrating upward alongside price
This confirms a healthy bullish auction.
⏱️ Session Behaviour (NY AM)
Asia built the base
London extended structure
NY AM delivered continuation and expansion
NY AM is historically the strongest session for metals trend extension, adding timing confluence.
📰 News & Macro Context (Why Silver Works Here)
Precious metals bid amid:
Cooling expectations around aggressive rate hikes
Persistent inflation hedging demand
📰 Silver benefits from a dual role:
Monetary metal (real-yield sensitivity)
Industrial demand exposure (risk-on alignment)
No adverse USD or yield shock during NY AM
Gold strength provides tailwind confirmation for Silver
Macro conditions are supportive, not conflicting.
🧾 Summary
SI1! shows strong buy-side sentiment following acceptance above value and continuation of a higher-timeframe bullish structure. Shallow pullbacks, bullish FVG support, and a supportive macro backdrop favour continued upside expansion.

River to 28 ? Sellers are firmly defending the 40 level, turning it into a clear supply zone visible in recent price action.
Each attempt to push higher has been met with immediate rejection, forming consistent upper wicks and failed breakout structures.
The volume profile shows increased activity on these tests, but without sustained acceptance above, indicating distribution rather than strength.
Momentum also appears to be fading, with rallies becoming shorter and less impulsive.
If buyers cannot reclaim and hold above this area, the structure favors continuation to the downside, with 28 emerging as the next significant liquidity pocket and technical target.

SHOT ON NZD/JPYNZD/JPY has completed its retracement/correction/pullback to a major supply zone.
It has rejected that supply zone with a massive wick and has given us a bearish engulfing candle as well.
I will be selling N/J to the previous week low looking to make 150-250 pips.

NZDCAD LONG Market structure bullish on HTFs 3
Entry at both Weekly and Daily AOi
Weekly Rejection at AOi
Daily Rejection at AOi
Previous Daily Structure Point
H4 Candlestick rejection
Rejection from Previous structure
TP: WHO KNOWS!
Entry 100%
REMEMBER : Trading is a Game Of Probability
: Manage Your Risk
: Be Patient
: Every Moment Is Unique
: Rinse, Wash, Repeat!
: Christ is King.

GBPUSD M30 HTF Supply Rejection and Bearish Continuation📝 Description
FX:GBPUSD has shown a clear bearish impulse after failing to sustain above the recent intraday highs. Price is currently consolidating below multiple 30-minute Fair Value Gaps, indicating a corrective pullback within a broader bearish structure rather than a bullish trend reversal.
________________________________________
📉 Signal / Analysis
Primary Bias: Bearish below the M30 FVG
Preferred Setup:
• Entry: 1.3780
• Stop Loss: Above 1.3791
• TP1: 1.3769
• TP2: 1.3747
• TP3: 1.3725
________________________________________
🧠 ICT & SMC Notes
• Rejection from stacked M30 Fair Value Gaps aligned with descending channel resistance
• Bearish market structure maintained with consistent lower highs
• No bullish displacement or acceptance above premium zones
________________________________________
📌 Summary
As long as GBPUSD remains capped below the 1.3795–1.3820 resistance zone, bearish continuation remains the preferred scenario. The current price action is viewed as a corrective pause before a potential continuation toward deeper sell-side liquidity.
________________________________________
🌍 Fundamental Notes / Sentiment
Relative USD strength and the lack of supportive macro catalysts for the British Pound continue to pressure GBPUSD. With risk sentiment remaining cautious, downside continuation is favored in the short term.
________________________________________
⚠️ Risk Disclosure
Trading involves substantial risk and may result in capital loss. This analysis is for educational purposes only and does not constitute financial advice. Always apply proper risk management, predefined stop-loss levels, and disciplined position sizing aligned with your trading plan.

SOLUSDT M30 HTF Supply Rejection and Bearish Continuation📝 Description
BINANCE:SOLUSDT has experienced a strong bearish impulse, breaking below a key H4 balance price range. Price is now consolidating under a 30-minute Fair Value Gap, suggesting a corrective pullback within a broader bearish structure rather than a trend reversal.
________________________________________
📉 Signal / Analysis
Primary Bias: Bearish below the M30 FVG
Preferred Setup:
• Entry: 116.10 (pullback into M30 FVG / supply)
• Stop Loss: Above 116.60
• TP1: 114.89
• TP2: 113.82
• TP3: 112.17
________________________________________
🧠 ICT & SMC Notes
• Strong bearish displacement confirming sell-side dominance
• Rejection from M30 Fair Value Gap in a discount-to-premium retracement
• Clear bearish market structure with lower highs and lower lows
________________________________________
📌 Summary
As long as price remains capped below the 116.60–117.20 resistance zone, bearish continuation remains the favored scenario. The current consolidation is viewed as a pause before a potential continuation toward deeper downside liquidity.
________________________________________
🌍 Fundamental Notes / Sentiment
Weak overall crypto market sentiment, coupled with reduced risk appetite and ongoing capital rotation out of high-beta altcoins, continues to weigh on SOL. Without a strong bullish catalyst, downside pressure remains dominant in the short term.
________________________________________
⚠️ Risk Disclosure
Trading involves substantial risk and may result in capital loss. This analysis is for educational purposes only and does not constitute financial advice. Always apply proper risk management, predefined stop-loss levels, and disciplined position sizing aligned with your trading plan.

ATH AGAIN? New long setup for gold.In my opinion it's the best time to get some gold. Gold stay in very bullish trend, so for me this correction and liquidity takeover is the best chance to buy it.

Moon time for Litecoin! - $700 ?? - November 2025Wait a minute… doom for Dogecoin, boom for Litecoin?
“ You can’t have a bearish idea for Doge and a bullish one for Litecoin, idiot!”
Yeah, yeah. I’ve had my coffee, I’m ready for the unhinged piffle that’ll inevitably clutter the comments. Bring it on..
For the rest of us: facts are facts. Charts don’t lie... people do.
The Technical Story
Remember the blue line on the Dogecoin idea ? The one that looked like it had just given up on life? Now look at Litecoin.
Stop drooling. You’re not a starving tradesman staring at a bacon sandwich, you’re a paid-up member of the Litecoin faithful. Still holding this thing eight years after promising your friends it was “digital silver.” The stock market’s gone vertical, AI’s rewritten the economy, and you’re here, squinting at a 200-week moving average like it’s the face of God.
But here’s the thing… this chart actually looks good.
A clean Dragonfly DOJI printed on support. That’s not random, that’s exhaustion at the lows.
The RSI has bounced perfectly from the lower trendline of a four-year descending channel.
The Stochastic RSI just printed a bullish cross that looks eerily like the ones preceding major Litecoin rallies.
This is not Dogecoin.
What’s Different This Time?
No hype, no memes, no billionaire tweets. When nobody cares, that’s when charts get interesting.
The 200-week SMA (red) finally flatlining. That’s long-term accumulation, not another dead-cat bounce.
Market structure intact. Unlike most alt tokens, LTC has maintained higher lows since 2022, quietly building a base while everyone’s off chasing whatever AI or frog coin is trending this week.
The Forecast
Base case: A push toward $140–$150 (the upper band of RSI resistance).
Bull case: $180+ within the first half of 2026, assuming the RSI breakout holds.
Bear case: You ignore every technical confirmation, and it does nothing for another decade, but at least you can say you hodled.
Big bull case: Price action breaks resistance to complete the ascending triangle to $700
Conclusions
Litecoin, the granddad of crypto might finally be waking up from its retirement nap. While Dogecoin’s out back chasing its tail, Litecoin’s quietly tightening its laces.
If this setup holds, LTC could be one of the few alt tokens left standing when the dust settles.
If not, well… it’s back to the rocking chair and war stories about 2017.
Ww
Disclaimer
=================================================================
This isn’t financial advice. I’m not your portfolio manager, your therapist, or your mum.
If you sell your house to buy Litecoin because of this post, that’s on you.
It’s just a bloke pointing at squiggly lines saying, “That looks interesting.” If it moons, you’ll call yourself a genius. If it dumps, you’ll say the market’s rigged.
Either way, stay safe.

XAU/USD 30 January 2026 Intraday AnalysisH4 Analysis:
-> Swing: Bullish.
-> Internal: Bullish.
Price has printed as per analysis dated 22 January where I mentioned price to print bearish CHoCH to indicate bearish pullback phase initiation.
Price is now trading within an established internal range.
Intraday expectation:
Price to react at either discount of 50% internal EQ, or H4 supply zone before targeting weak internal high priced at 5,602,225.
Note:
The Federal Reserve’s renewed easing cycle, alongside a weaker U.S. dollar and persistent geopolitical tensions, continues to drive volatility in the gold market.
Traders should remain cautious and adjust risk management strategies to navigate sharp price swings.
Additionally, gold pricing is highly sensitive to U.S. policy under President Trump, where tariff measures, fiscal uncertainty, and shifting geopolitical strategy amplify market repricing risks and reinforce safe‑haven demand.
H4 Chart:
M15 Analysis:
-> Swing: Bullish.
-> Internal: Bullish.
Price has printed according to yesterday's analysis where I mentioned that price should print a bearish CHoCH to indicate bearish pullback phase initiation.
Price is currently contained within an established internal range.
Intraday expectation:
Price trade down to either M15 demand zone, or discount of 50% internal EQ before targeting weak internal high, priced at 5,602.225.
Alternative scenario: Price could potentially print a bearish iBOS as all HTF's require a pullback.
Note:
Gold continues to exhibit elevated volatility as markets digest the Federal Reserve’s ongoing dovish tilt and persistent global geopolitical tensions.
With uncertainty remaining a dominant theme across global risk assets, traders should prioritise disciplined risk management, as abrupt price swings and liquidity pockets may become increasingly common.
Furthermore, recent tariff announcements from President Trump, particularly those directed at China, have added another layer of instability to the macro landscape. These policy developments have the potential to intensify market turbulence, heighten risk‑off flows, and trigger sharp intraday reversals or whipsaw‑like behaviour in gold.
M15 Chart:

BitCoin long-term forecast 2026 dropping to $45k?Bitcoin monthly demand level is under attack. New low printed.
The yearly timeframe is trending up and the dump has started, hopefully. CRYPTOCAP:BTC can continue the dump as explained a few weeks ago.
Next stop is the monthly demand imbalance at $64k. No longs are adviced in the middle or a long-term dump.

EURUSD H1 HTF FVG Rejection and Bearish Scenario📝 Description
FX:EURUSD has reacted bearish after tapping into a higher-timeframe Fair Value Gap (H1 FVG) and failing to sustain bullish momentum. The recent impulsive downside move suggests distribution from a premium zone, with price now consolidating below key resistance.
________________________________________
📉 Signal / Analysis
Primary Bias: Bearish below the H1 FVG
Preferred Setup:
• Entry: 1.1923
• Stop Loss: Above 1.1948
• TP1: 1.1895
• TP2: 1.1867
• TP3: 1.1850
________________________________________
🧠 ICT & SMC Notes
• Rejection from H1 Fair Value Gap (premium area)
• Sell-side liquidity resting below recent lows
• Targets aligned with H1 Order Block and imbalance zones
________________________________________
📌 Summary
As long as price remains below the 1.1950 resistance and fails to reclaim the H1 FVG, bearish continuation is favored. Current structure supports a downside rotation toward lower liquidity pools and HTF demand levels.
________________________________________
🌍 Fundamental Notes / Sentiment
Ongoing USD resilience and the absence of strong bullish catalysts for the euro continue to weigh on EURUSD. Macro sentiment supports downside moves rather than sustained upside recovery in the short term.
________________________________________
⚠️ Risk Disclosure
Trading involves substantial risk and may result in capital loss. This analysis is for educational purposes only and does not constitute financial advice. Always apply proper risk management, predefined stop-loss levels, and disciplined position sizing aligned with your trading plan.

XAUUSD BullishI might be a little early, since I like to wait until the London or USA trade session , but the possibility of this happening is good. In reality, i would wait for more conformation before entering the trade, but so far everything looks good as the 15m, 1h and 4h are starting to align giving bullish signals. I just thought i should share this quick analysis as I'm trying to stay active away from home, Peace! OANDA:XAUUSD
