Iron Condor on EFA 65/66 --- 60/59balancing out portfolio with a neutral position iron condor on EFA with June 28 exp
took in credit of .26
Open


Bear call spread on XBI July expneed to add more bearish positions because I closed a few this morning
opened 86/88 bear call spread for .53 credit
86 is previous R and RSI can't seem to break above 50

Rebound EUR/USD to the upside...Strong support in play, looking for rebound as it touches support, ahead of US open

EUR/USD London Open Strategy 18th of MarchREASONS TO BUY:
4h box broke above
Above 50-78EMAs
WHAT COULD GO WRONG:
Strong resistance zone (confluence)
News


Calculating a negative open on the J200 -249 points.Based on my calculations I derive a negative open on the J200 -249 points.
The UK market finished weaker yesterday.
US markets ended mostly lower yesterday.
Tencent trading down -2% currently.
S&P and FTSE futures pointing lower.
Traders should look to profit from arbitrage opportunities between the ALSI open and the J200 open based on our caculations.

USD/JPY Yen volatility leading up to USA stock market open #3I've noticed a clear trend leading up to 6:30am pacific time USA stock market open time, I think people are hedging currencies in order to trade in different markets. You can ride it down then up more days than not check profile for more examples

USD/JPY Yen volatility leading up to USA stock market open #2I've noticed a clear trend leading up to 6:30am pacific time USA stock market open time, I think people are hedging currencies in order to trade in different markets. You can ride it down then up more days than not check profile for more examples

USD/JPY Yen volatility leading up to USA stock market open VideoI've noticed a clear trend leading up to 6:30am pacific time USA stock market open time, I think people are hedging currencies in order to trade in different markets. You can ride it down then up more days than not check profile for more examples

USD/JPY Yen volatility leading up to USA stock market open #1I've noticed a clear trend leading up to 6:30am pacific time USA stock market open time, I think people are hedging currencies in order to trade in different markets. You can ride it down then up more days than not check profile for more examples

Intel Open TrendsGreat to follow the trends in the opening trades... I think this is a good strat, just feel which way the market is going up or down and ride it 2% stop loss.


GBPUSD 1H NEW BIG 3 INDICATOROPEN AND CLOSE SIGNALS SHOWN
ABOVE 50 EMA LONG
BELOW 50 EMA SHORT
If you have any question PM me and I will be happy to help.

The Verge Trade is ON!
The Verge Trade is ON!
I wrote about a trade setup for Verge the other day.
I traded on Verge this morning entering at 4.5 cents and it has risen to 7 cents in the last 17 hours. I'm still in and watching closely. Verge did not complete the last touch of the Bulkowski Trend line but when BTC took off it was a good signal. I had mentioned the importance of BTC pricing on Verge in my post, If I were out of Verge I would consider getting in if it pulls back a good bit from 7 cents. It could go much higher from 7 cents .
Watch for a closed candle on the 4 hour chart over the FIB 0.236 line at 0.743 Cents for a short term confirmation. If Verge Closes above the upper Bulkowski Trend line somewhere between here and 10 cents then hang on to your hats.
I would close this trade if the price falls to 5.8 Cents and watch for a new entry.
Please, Don't forget to Like Agree, Comment and Follow Me, It's additional encouragement for me to share my work.
All statements and expressions I offer are my opinions, and not meant as investment advice or solicitation. Information provided is not personal investment advice. Seek guidance from a professional investment advisor before trading or investing. Trading cryptocurrencies can be a potentially profitable opportunity for investors. You should carefully consider your investment objectives, level of experience, and risk appetite. Most importantly, do not invest money you cannot afford to lose. I am not a registered investment advisor.
Wishing you success,
Isaac

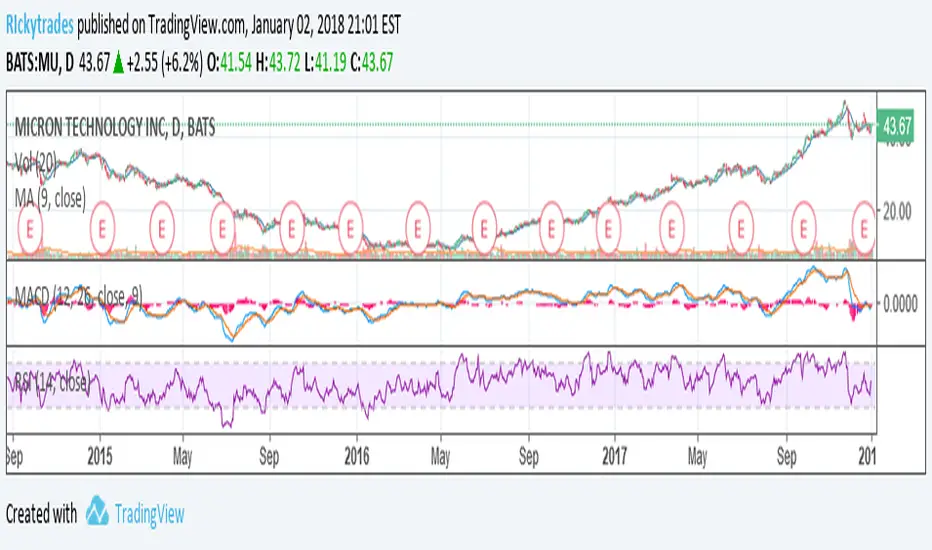
MU looking goodMU closed with a solid bullish sign.The stock closed above the 50 day moving average today. Also the RSI is still low around 40% , and MACD is about to cross the signal line for a strong buy opportunity. Plus the trend looks like a solid upward trend, which makes this stock a good buy opportunity


Bitcoin : Open and contributive discussionBitcoin, since its creation, is globally gaining in value more than any other comparable asset class. Late 2011, one bitcoin was traded at $3 ; now it's over $2700 which represents a +90 000% performance.
What is even more remarkable about this crypto-currency is its price pattern . It is evolving in exponential phases , then consolidates slowly. Four major sequences can be spotted easily, and they are described on the main chart of this article. Nevertheless there are many more sub-sequences that are also exponential.
The current upside phase is certainly the most impressing because Bitcoin pushed over $1000 and $2000, and seems on track to reach $3000 soon, if not this week. If prices repeat the past magnitude (x17), then Bitcoin could reach 3400$ before declining gently for a consolidation. But it is also different from the previous runs : it lasts longer (6 months for phases II and III ; over 2 years for current phase IV). Is it a sign of strength, or the opposite ?
I personally have only little doubts that crypto-currency will become soon or later one of the leading asset classes for investment but also trading purposes on everyday life. However, it is possible that Bitcoin won't be that currency : it seems reasonable to think that an alternative one could take the lead before the real takeoff for many reasons (from marketing, trend effect, or practical specification that make bitcoin obsolete. What I also believe is that this kind of scenario can be identified from price analysis , even though bitcoin should be studied a different way.
This article is nothing but an open discussion , thus I invite anyone who has analysis and views about bitcoin and more generally crypto-currencies to share their contribution below .

BITCOIN BTCUSD Update: Still more to comeBITCOIN BTCUSD: Update Although it's just hit the next upside target at 1947, exceeding it with an intra-day high at 1955, there is still more to come. Price action over the last week (which we were a part of on the short side at the time, see comments) has shown that Bears don't really stand a chance here. We really had a go last week - and all we succeeded in doing was to knock it back to 1615 target...the old high! A sign of a very strong stock. Case closed. No more bear attacks until 2137-2140 upside target is met now. Bulls are pushing on an open door. There are no more bears out there...for now - they're all licking their wounds and won't be out again anytime soon. Look to pick up more longs or re-enter the market as per comment. One of two entry points: The second may not get hit though, so watch how it behaves as it hits the parallel...

DXY before open - be careful hereDXY Dolar index
Low at 97.28 just 2 pips under the trigger - looks very bearish but concerned about getting sucked in before the open....need to be careful here as a chance of quick rally towards the upper parallel before coming off again. Whilst trapped under that parallel the Dollar will remain under pressure and will turn full-on bearish on a break below 97.30-97.28 after the open. Apologies. This should have been made clearer first time, not now. But for newer traders be wary of pre-market moves - we need to see volume for confirmation!
