Last XPT Options Insights & What They Mean for Precious MetalsPlatinum Options showed unusual activity last week — and it’s worth your attention.
Why focus on platinum?
It’s a traditional institutional instrument, with minimal retail presence.
Check your terminal: compare spreads in PL vs. gold or silver — you’ll see the difference.
Low liquidity → less noise → clearer signals from funds and smart money.
And here’s the key:
Platinum often leads the way.
Its moves and positioning frequently foreshadow broader precious metals trends.
🔍 What Are We Seeing Now?
Large structured plays emerged in platinum, targeting a range between 1,750 and 2,200.
Most portfolios are hedged, which tells us:
“We’re bullish long-term — but expect pullbacks before the main move.”
This isn’t speculation.
It’s strategic positioning with risk management built in.
📌 In short:
They believe in higher prices — just not in a straight line.
💡 Silver: Similar Sentiment
The same bias appears across the asset- Bullish call spreads actively traded
Targets:
Silver: $65–85
Horizon: from 16 days to March 2026
🧠 Final Takeaway:
Platinum has already spoken. Precious metals bias is bullish, but a price decline is expected.
Optionflow

NKE NIKE Options Ahead of EarningsIf you haven`t sold NKE before the previous earnings:
Now analyzing the options chain and the chart patterns of NKE NIKE prior to the earnings report this week,
I would consider purchasing the 69usd strike price Calls with
an expiration date of 2025-12-19,
for a premium of approximately $2.51.
If these options prove to be profitable prior to the earnings release, I would sell at least half of them.

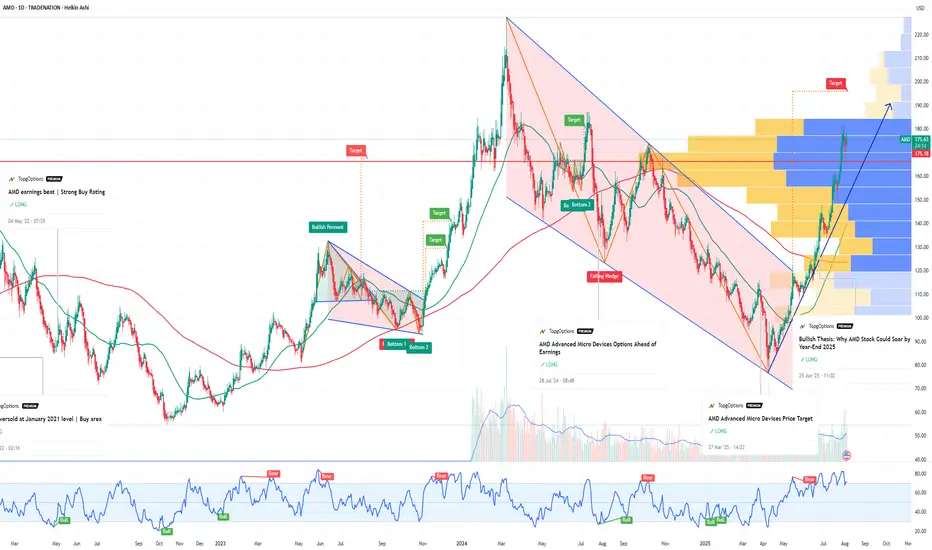
AMD Advanced Micro Devices Options Ahead of EarningsIf you haven`t bought AMD before the previous earnings:
Now analyzing the options chain and the chart patterns of AMD Advanced Micro Devices prior to the earnings report this week,
I would consider purchasing the 220usd strike price Calls with
an expiration date of 2026-9-18,
for a premium of approximately $22.15.
If these options prove to be profitable prior to the earnings release, I would sell at least half of them.
Disclosure: I am part of Trade Nation's Influencer program and receive a monthly fee for using their TradingView charts in my analysis.
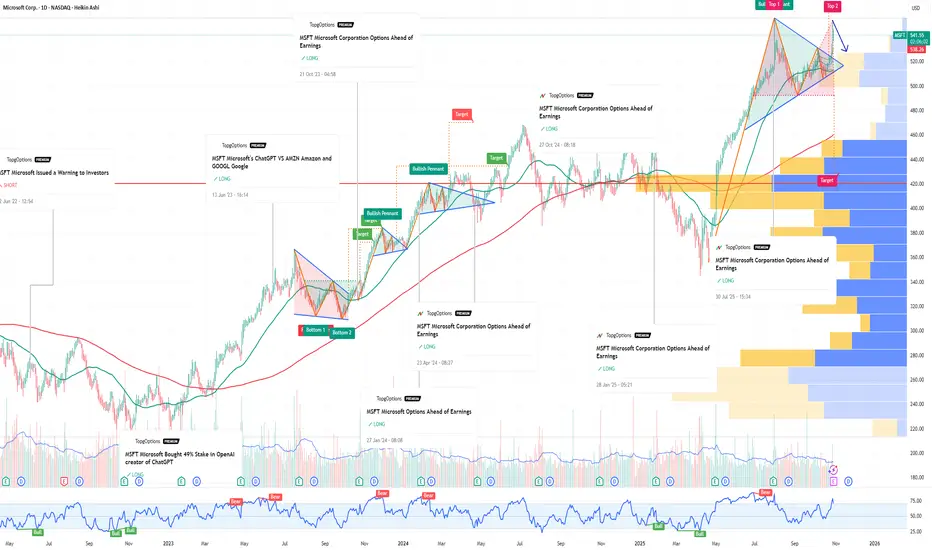
MSFT Microsoft Corporation Options Ahead of EarningsIf you haven`t bought MSFT before the rally:
Now analyzing the options chain and the chart patterns of MSFT Microsoft Corporation prior to the earnings report this week,
I would consider purchasing the 550usd strike price Puts with
an expiration date of 2025-12-19,
for a premium of approximately $26.70.
If these options prove to be profitable prior to the earnings release, I would sell at least half of them.
HPQ HP Options Ahead of EarningsIf you haven`t sold HPQ before the previous earnings:
Now analyzing the options chain and the chart patterns of HPQ HP prior to the earnings report this week,
I would consider purchasing the 23usd strike price Puts with
an expiration date of 2025-12-19,
for a premium of approximately $0.74.
If these options prove to be profitable prior to the earnings release, I would sell at least half of them.

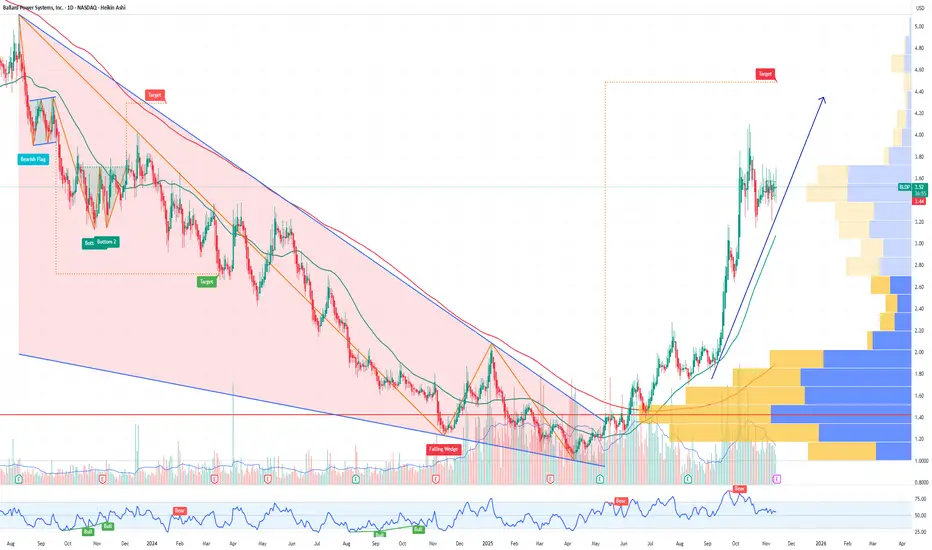
BLDP Ballard Power Systems Options Ahead of EarningsAnalyzing the options chain and the chart patterns of BLDP Ballard Power Systems prior to the earnings report this week,
I would consider purchasing the 3usd strike price Calls with
an expiration date of 2026-2-20,
for a premium of approximately $1.00.
If these options prove to be profitable prior to the earnings release, I would sell at least half of them.
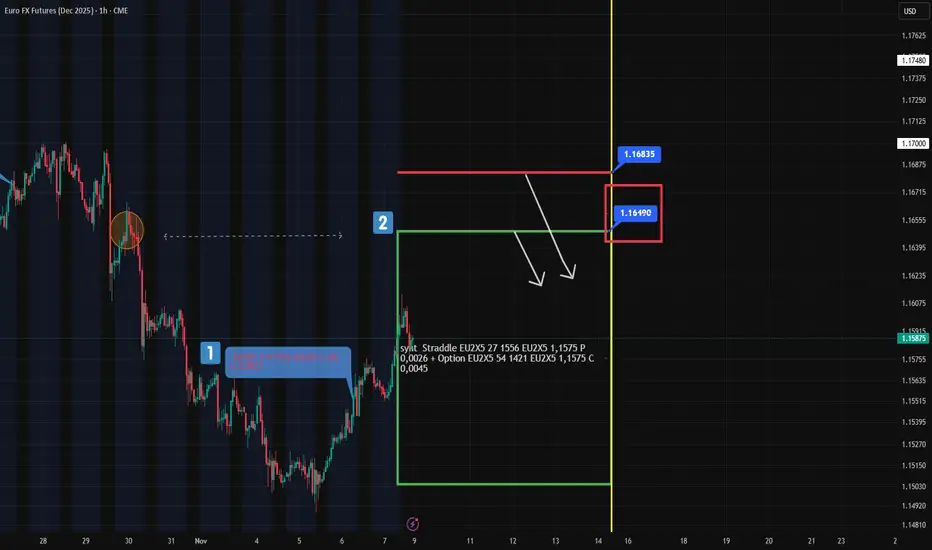
Euro Sentiment: What’s Ahead in the Next Few DaysRetail positioning tells a clear story:
70% short / 30% long on EUR/USD
→ That’s a textbook setup for a long .
The crowd is bearish — but structure favors bulls.
From a technical standpoint, we’re seeing a solid corrective move up from 1.15, with even a mini-higher high – higher low pattern forming — yes, like the ones in classic TA textbooks.
It looks not just logical… but inviting.
Now let’s look at the options market:
There’s real bullish momentum building:
1. Naked calls being bought
2. Call spreads actively traded
My focus is on two key structures:
First, the call at 1.165, entered on November 6 — now already in the money (#1 at chart)
Friday’s straddle at 1.1575 — its upper boundary aligns perfectly with the trigger level from October 29 (#2 at chart)
🎯 Confluence? Yes.
🔍 Putting It All Together:
We have fuel for further upside in EUR:
Retail overcrowded short
Technical structure improving
Options flow turning bullish
But resistance looms ahead:
1.1649 and up to 1.1683 (futures prices) are strong zones
These levels could cap the upside move and offer high-probability short setups
👉 In particular, 1.1649 stands out as an ideal zone to consider a short.
On Monday, I’ll calculate the Expected Range (ER) levels — and if it aligns with this resistance, I’ll definitely place a limit order here.
Not using ER levels yet?
Spend one minute learning them — and gain the edge most traders overlook.
If You're Not Just Hearing About Options —But Actually Diving InYou’ve moved beyond indicators and noise.
You’re stepping into the world where smart money operates.
Because options are not just tools for betting.
They’re a mirror of institutional intent — of hedges, positioning, and hidden signals.
And if you learn to listen to this market, you gain a real edge — even if you never trade an option yourself.
You’ll see what’s coming on spot Forex, gold, or indices — before the crowd notices anything.
This isn’t theory from a textbook.
It’s a practical guide forged from over 5 years of daily analysis of CME reports, exchange data, and real-world observation.
Let’s break it down — step by step.
🔍 Step 1: Can You Identify the Player by Option Delta?
Yes — and it starts with understanding delta.
Delta = Sensitivity of an option’s price to changes in the underlying asset.
0.05–0.10 (5–10%) → Deep out-of-the-money (far OTM)
0.15–0.30 (15–30%) → Moderately OTM
~0.50 (50%) → At-the-money (ATM)
>0.50 → In-the-money (ITM)
Now — who trades what, and why?
0.05–0.10 ->Tail-risk hedgers, "lottery" traders
Protection against black swans or cheap speculative bets
0.10–0.20 ->Aggressive speculators, potential insiders
Betting on explosive moves — possibly with inside conviction
0.20–0.35 -> Regular speculators, funds
Expecting moderate rallies — balanced risk/reward
0.40–0.60 - >
Institutions, hedge funds
Portfolio hedging, delta-neutral strategies
>0.60
Arbitrageurs, hedgers
Deep ITM options as synthetic positions
⚠️ Important Nuance:
Delta is not absolute.
Large players may use deep OTM options — but not for speculation.
These could be tail-risk hedges (e.g., protection against crash scenarios).
🔮 Predictive Power Isn’t Just About the Trade — It’s About the Timing
The forecast value of an individual option increases dramatically when you ask:
When did this position appear — relative to price action?
✅ Before a move? → High predictive power
❌ After a big rally? → Likely FOMO or profit-taking
✅ On a pullback? → Could signal support/resistance
IMPORTANT! Timing turns noise into signal.
📌 To be continued in the next update…

Quiet in FX Options — But Gold Is Heating Up
Over the past 24 hours, major currency options saw little of interest.
In contrast, precious metals — especially Gold — are attracting serious attention.
Let’s break down the key developments:
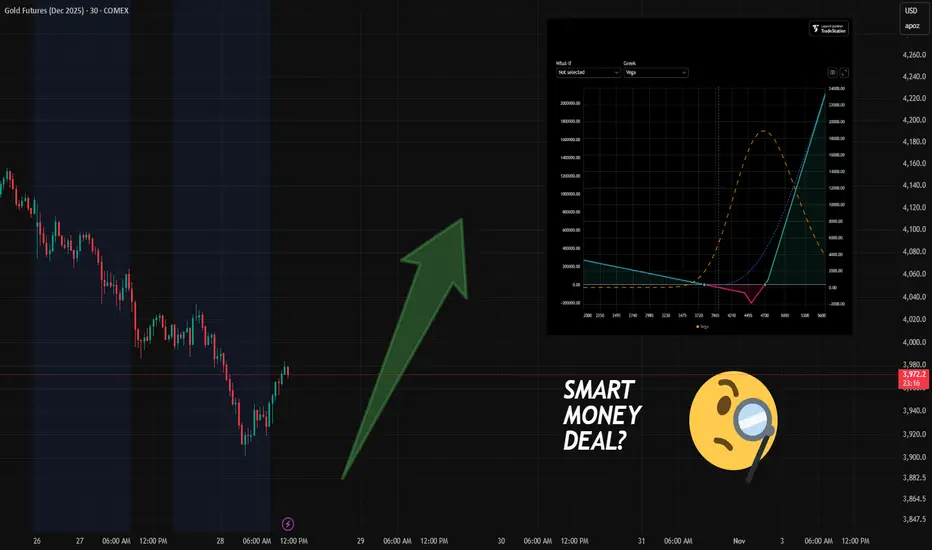
🔹 Observation #1: A New Bullish (But Hedged) Portfolio Appears
(See risk profile on screenshot.)
A new SMART option portfolio has entered the market:
Bullish bias, but with a built-in hedge — which reduces its predictive value.
If price drops below $3,800, the portfolio starts generating profit for its owner (via the hedge).
Built on the February 2025 futures contract, under an option series expiring in December 2025.
📌 Yes, it sounds confusing — and it is.
Option series expire, but futures live on.
This creates what we call "expiry risk" — a topic for another deep-dive article.
🔹 Observation #2: Put Activity at 3900 (Dec Series)
There’s growing activity in puts at the 3900 strike — moderate bullish positioning or support.
The bullish structure is hedged — not a pure directional bet.
Bearish positioning remains active.
Price has not yet shown signs of moving toward the main long setup.
I’d recommend at least 2–7 days of observation before considering any reversal trades.
📌 And here's why:
It’s rare for price to move immediately toward the target of a large, long-dated portfolio.
More often, there’s a delay of several days — especially when expiry is still far out.
Watch the flow.
Trade only when the edge is clear.
May the data-driven approach be with you!
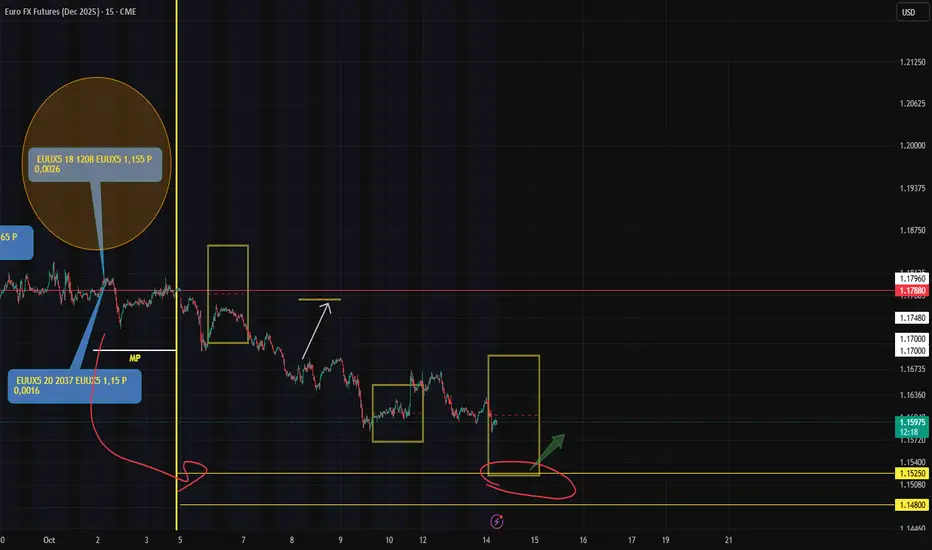
ER + Option Break-Even = Hidden Support Zone in EURA quick look at my slightly crazy trading chart for the Euro futures — here’s what matters today:
🔸 A naked put at 1.55 (circled) has seen outflows of nearly 1,300 contracts, with roughly 3,000 still open — though not all may be "naked" (some could be part of structured positions).
Important context:
This option is still out of the money (obviously), but holders have already made ~2x their initial premium and are now taking profits.
👉 So the right question is:
Why take profits now instead of waiting for further downside?
🔸 Second key point:
Today’s lower ER boundary aligns almost perfectly with the break-even level of this 1.55 put — where some open interest remains.
Now, if these are indeed naked puts (not complex hedged portfolios), then as price approaches this zone, traders will likely start buying futures to build up synthetic portfolio
📌 Result?
Potential bounce or short-term rally from this level.
Not because of bullish sentiment — but speculative logic
Gold’s outlook after Friday’s newsA question came in on TradingView about gold’s outlook after Friday’s news.
My analysis methodology is built on a holistic review of exchange data, where options flow plays a central role — something long-time followers of my posts are already familiar with.
So here’s what Friday’s options flow is quietly telling us:
🔸 The bearish put spread (on November option series ) targeting lower levels from October 8th onward is still intact — suggesting downside sentiment remains in play.
Now, let’s be realistic:
Sophisticated players can always flip this position mid-flight by adding futures to hedge — turning it into a neutral or even bullish setup if the rally continues.
After all, we’re dealing with pros with deep pockets — and they don’t like losing money.
They’ll adjust. They’ll hedge. They’ll exit clean.
🔸 Second, Friday’s CME activity leaned bearish (screen attached)— or at least, profit-taking (fixing).
We see call strikes above current price either being closed or re-sold.
Volume is present — but open interest is flat, declining, or even negative.
That tells a story:
No new conviction for higher prices.
Just closing old upside bets.
📌 Bottom line:
The flow doesn't scream "crash coming right now" — but it does whisper:
"Be careful with the longs."

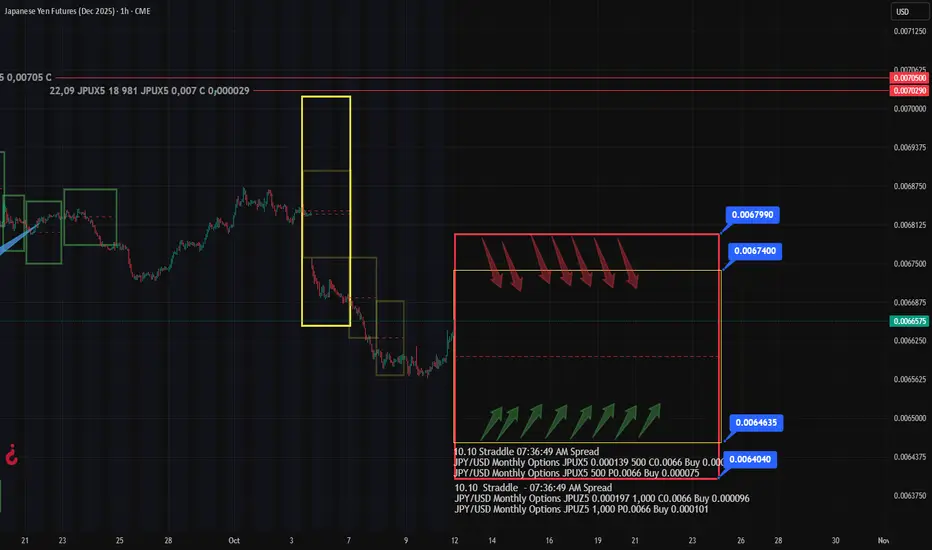
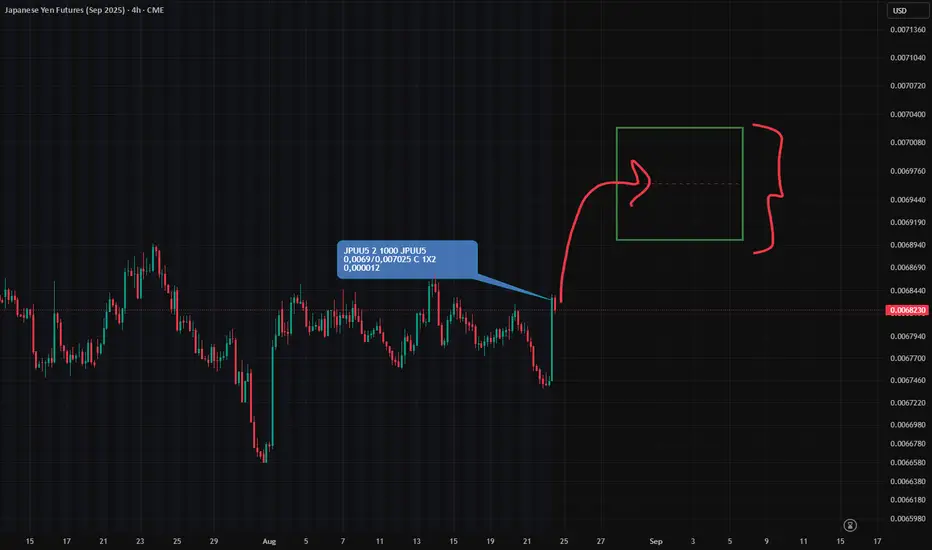
JPY Analysis & Outlook: Friday’s Options Flow Tells the StoryFriday’s trading on the options market revealed two key developments in JPY:
🔸 Two Straddles appeared in the current front-month expiry series
Plus a mid-sized Call Spread near 0.00675
Upper boundaries: 0.00674 and 0.006799 (marked on chart)
🔍 Key Takeaways:
Option traders are positioning likely for a correction in JPY futures after last week’s sharp drop.
But, Straddle isn’t a directional bet — it’s a volatility play with structure.
Call Spread is a a directional bet
As usual, when price approaches either Straddle boundary, option players will likely convert positions into synthetic calls or puts, reinforcing these levels as BE zones.
🎯 Strategic Levels:
0.00674 – 0.006799 → Potential resistance zone in the medium term
But here’s what’s interesting:
If you apply a Fibonacci retracement tool, the 61.8% level aligns almost perfectly with one of the already marked Straddle levels.
That kind of confluence?
It could attract additional downside liquidity from traders using Fib grids — especially those selling into "expected" reversal zones.
Is it a coincidence?
Sure, probably 😉
BB BlackBerry Limited Options Ahead of EarningsIf you haven`t bought BB before the prevous earnings:
Now analyzing the options chain and the chart patterns of BB BlackBerry Limited prior to the earnings report this week,
I would consider purchasing the 3.50usd strike price Calls with
an expiration date of 2025-10-24,
for a premium of approximately $0.53.
If these options prove to be profitable prior to the earnings release, I would sell at least half of them.

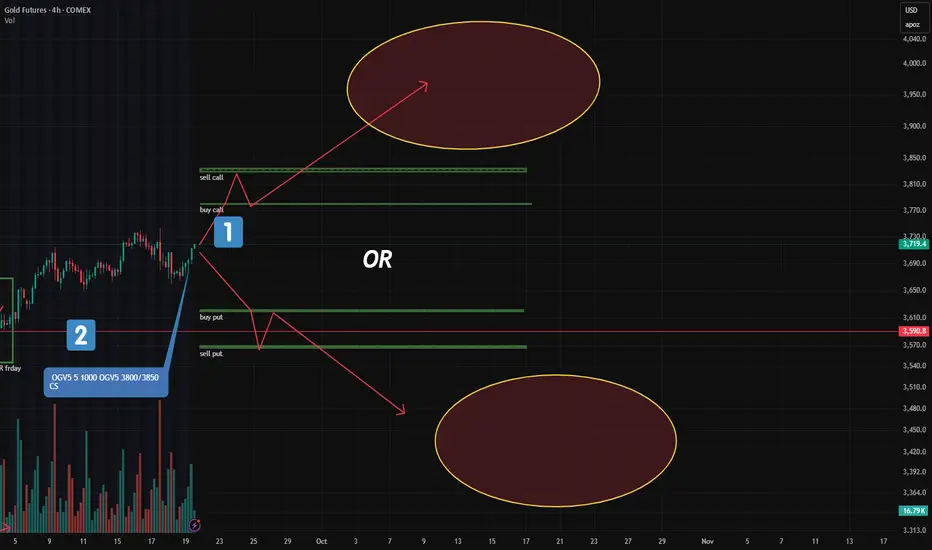
Gold: Major New Option Portfolios Signal Strong Moves AheadFriday’s CME report showed a surge in large option blocks in gold — two of them stand out.
🔹 1. "Long Condor" on December Futures (GCZ24)
This is the most significant structure added:
Targets a move below $3,620 or above $3,780
In other words: a breakout is expected, not consolidation
📌 Key point:
A "Long Condor" profits from volatility, not direction.
It wins if price moves sharply — up OR down — but loses if it stays flat.
💡 My note:
When I first encountered delta-neutral strategies like this as a Forex trader — my brain exploded.
No directional bias… yet clearly positioned for action?
That was the moment I realized: options are a different game.
🔹 2. Bull Call Spread (Oct Series): $3800–$3850
Another key play:
A classic bullish call spread at 3800/3850
Target: upside beyond current levels
But here’s the difference:
Unlike the "Long Condor", this one needs a clear upward move — and soon. Within a few days.
This isn’t about volatility.
It’s a directional bet that gold will rise.
🧠 Bottom Line:
One portfolio says: "Breakout coming — no matter which way."
Another says: "Gold goes up — and soon."
Are they aligned?
Contradictory?
Or could both win?
Trade smarter, not harder! Looking to boost your profits with valuable market insights and data-driven entry points? Join us or keep moving!
"Aha!" Moments Are Dangerous — Here’s Why You Shouldn’t Panic Just because a big options trade appears — doesn’t mean it’s a signal.
Options move every day.
Some trades are:
-Speculative
-Hedging plays
-Pure lottery tickets
Only a few carry real directional sentiment.
And learning to separate noise from signal?
That’s one of the most powerful skills a trader can develop — even if you never trade options yourself.
Let’s Look at JPY (See Chart)
On September 5, two large put portfolios appeared:
1. 0.0064 Put
2. 0.00635 Put
Both new, both with no prior open interest — so not a roll.
And yes — they’re larger than average.
To a beginner, this screams:
“JPY is going to crash — time to short everything!”
But let’s pause.
An experienced flow analyst would ask:
Is this really a bearish signal?
🔍 Here’s What the Data Says:
❗️Size ≠ Significance
Yes, the portfolios are big — but each costs ~$90K.
In institutional terms? Not massive.
❗️Delta is ~2%
That means less than 2% chance of expiring in the money.
❗️This Happens Often in JPY
Same strike (0.0064), same structure — appeared in the previous series.
Price never went near it.
No crash. No panic.
Just… nothing.
🧠 So Why Buy It?
I don’t know.
And I don’t need to.
Could be:
1️⃣A hedge for a larger book
2️⃣A counterparty agreement
3️⃣A some extra aggressive logic
But here’s what I do know:
Based on years of CME data and personal tracking —
Trades like this don’t cause market crashes.
They don’t move the needle.
They don’t change the trend.
✅ Final Takeaway:
Don’t react to the data headline.
Ask:
How likely is this to matter?
Is it priced in?
Has this happened before? Price reaction after big OTM options?
Because real edge isn’t in the "Aha!" moment —
It’s in the "Wait, let me check…" moment.

JPY "Call Butterfly" Update: Not Closed — But Sold
Yesterday’s CME data shows movement in the JPY futures call butterfly (centered at 0.00705):
The entire portfolio was re-sold — not closed.
(See arrow on chart: futures price at moment of transfer.)
🧠 What’s Going On?
Instead of unwinding the position during the dip, the market saw a transfer of ownership.
This suggests:
Another player stepped in to buy it cheaper
He believes JPY futures still has upside potential by expiry
Confidence remains — just in different hands
✅ Bottom Line:
The butterfly didn’t exit — it changed hands.
Likely moved to a more informed or confident trader.
Sentiment: moderately bullish (USDJPY - bearish), not fading.
However, from a technical standpoint, we can’t yet speak of bullish confirmation in JPY futures.
A key condition must be met first:
✅ A clear break USDJPY and close above the local low.
And in my methodology, "confirmation" means:
📌 Price must stay above (below) that level for at least 24 hours after the breakout (chart attached)

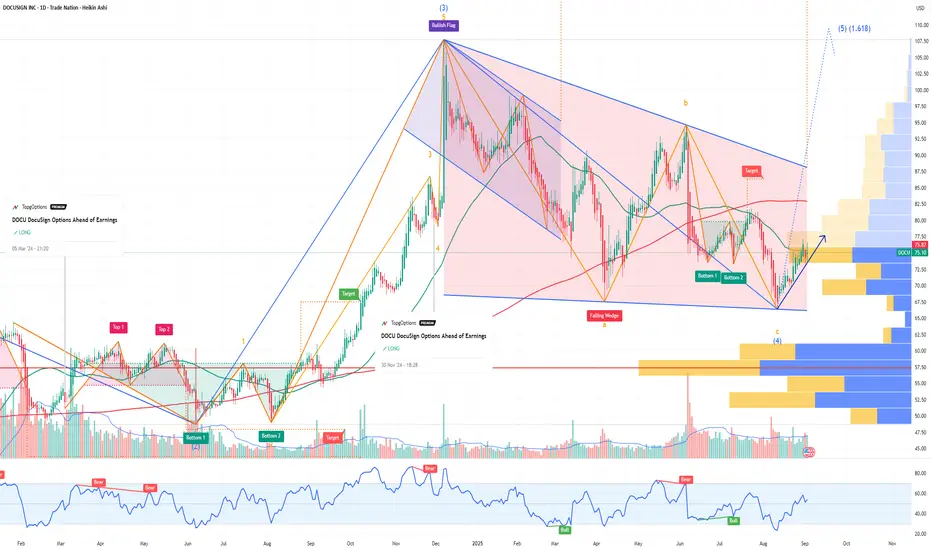
DOCU DocuSign Options Ahead of EarningsIf you haven`t bought IOT before the rally:
Now analyzing the options chain and the chart patterns of DOCU DocuSign prior to the earnings report this week,
I would consider purchasing the 76usd strike price Calls with
an expiration date of 2025-9-5,
for a premium of approximately $4.10.
If these options prove to be profitable prior to the earnings release, I would sell at least half of them.
Disclosure: I am part of Trade Nation's Influencer program and receive a monthly fee for using their TradingView charts in my analysis.
CRWD CrowdStrike Holdings Options Ahead Of EarningsIf you haven`t bought CRWD before the rally:
Now you should know that looking at the CRWD CrowdStrike options chain ahead of earnings, I would consider the $420 strike price Puts with
2026-5-15 expiration date for about
$50.95 premium.
If the options turn out to be profitable Before the earnings release, I would sell at least 50%.
Disclosure: I am part of Trade Nation's Influencer program and receive a monthly fee for using their TradingView charts in my analysis.

Just Because It’s Big Doesn’t Mean It’s SmartJPY Call Spread Breakdown: Bullish Signal — Or Just Obvious FOMO?
A new vertical call spread appeared in JPY options yesterday (per CME Globex data):
Long 0.0069 Call
Short 0.007025 Call
🎯 Target: 0.007025 — upside continuation play.
Open interest increased at both strikes → new position, not a roll.
Size? Relatively large for JPY (based on systematic observations).
⏰ When Was It Opened?
9:45 AM CT — after yesterday’s sharp rally in JPY futures.
In fact — right at the top of the move.
📌 Not before the move.
But after the impulse, on momentum.
🔍 Combining Flow + Chart Context:
Price had already spiked up.
The spread bets on further upside .
🧠 Key Takeaways:
✅ Sentiment: Bullish
❌ Predictive value: Low — nearly zero
Why?
The setup is too obvious.
No evidence of insider-like timing.
If this had been placed before the move — yes, it would matter.
But opening at the peak? That’s not edge — it’s FOMO dressed as strategy.
🚫 Will I go long JPY futures based on this?
No.
Not because I doubt the move.
But because this isn’t smart money behavior — it’s trend-chasing.
🎯 Final Lesson:
Not every large options trade is a signal.
Always ask:
When was it placed?
Why here?
Who’s behind it?
🔍 True edge isn’t in the trade itself — it’s in the context around it.
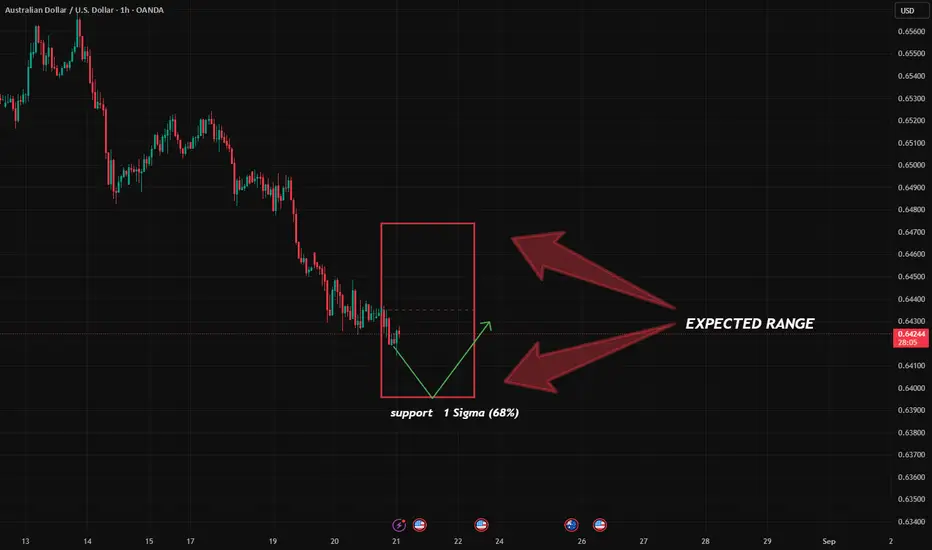
AUD Update: Volatility, Flow & The Wide Range Game
🌡 Volatility & ER Levels (Today):
Expected Range (1σ) for AUD/USD futures:
Lower bound: 0.63945 ← Key support
🧩 Options Flow: Big Portfolio Restructuring
Big news in the options pit:
A major portfolio targeting a drop to 0.64–0.63 has been restructured.
What’s left?
Put @ 0.64 (still in play)
Call @ 0.66 (new upper ceiling)
This isn’t random — it’s a shift from directional bearishness to range-bound positioning.
🧠 What’s the Sentiment?
Looks like the market is pricing in a wide sideways channel — exactly where AUD has been stuck for the past 2 months.
No strong bullish signals from COT yet.
📅 Next Catalyst: COT Report (Tomorrow)
Fresh data on institutional and retail positioning drops tomorrow.
🔍 Bottom Line:
Support at 0.63945 holds key.
Options now suggest a 0.64–0.66 range.
Wait for COT to confirm next move.
#AUD
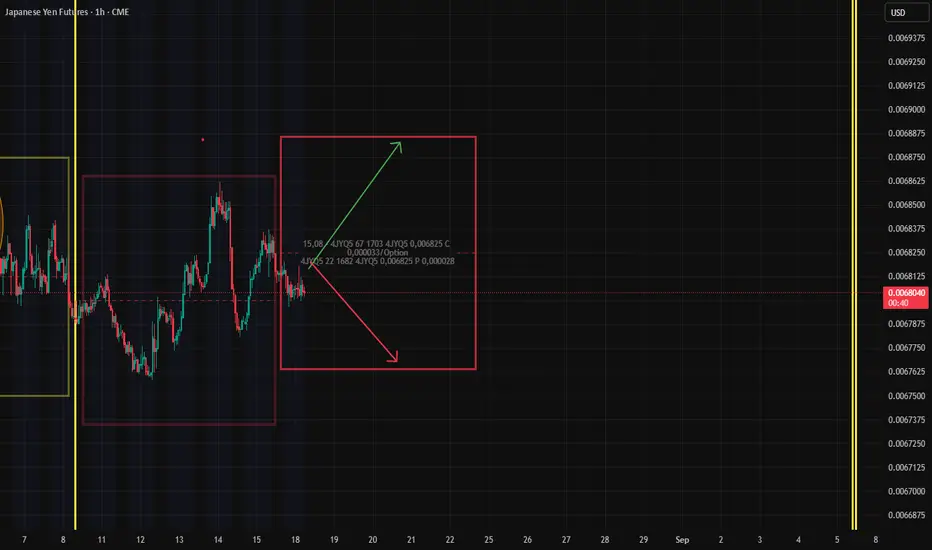
Very briefy: from Straddles to Spreads — What Options Are Saying📊 Market Pulse (CME data based): Key Flow Signals (15.08)
Gold (Oct series):
Spreads at 3650/3750 are being closed.
📉 Sentiment: moderately bearish — no strong upside expected.
AUD:
No major repositioning or fresh flow.
🟢 Sentiment remains bullish — quiet but intact.
EUR:
No insider-level activity or large block trades.
Neutral zone — no directional edge yet.
GBP:
Growing put interest at 1.35.
🟠 Sentiment: moderately bearish — but this level will act as local support IF reached.
JPY:
Another straddle live — expires Aug 22 (4-day life).
Boundaries set, setup familiar.
We know the drill: fade the edges, watch the break-even levels for LONG/SHORT opens
Why CSX Corporation CSX Could Reach $37.50 by the End of 2025If you haven`t bought CSX ahead of the previous earnings:
Now CSX Corporation CSX, a leading North American rail freight operator, is positioned for a meaningful upside in 2025, with a realistic price target of $37.50. This target is supported not only by strong fundamentals and industry tailwinds but also by recent options market activity showing significant call option interest at the $37 strike price, indicating growing investor conviction around this level.
1. Strong Options Market Signals at $37.50
Recent options data reveals a notable concentration of call open interest and volume at the $37 strike price in the CSX options chain, especially for near- and mid-term expirations.
This elevated activity suggests that institutional and retail investors are positioning for a rally toward $37–$38, reflecting confidence that the stock will surpass $35 and approach $37.50 by year-end.
The options market’s pricing and demand at this level provide a real-time, market-driven validation of the $37.50 target, adding weight to the fundamental bullish case.
2. Analyst Price Targets and Upward Revisions Support $37.50+
Several analysts have price targets ranging from $35 up to $38–$39, with recent upward revisions reflecting improving operational metrics and resilient demand.
Bank of America and Goldman Sachs, among others, have raised targets closer to or above $35, and the options market activity suggests investors expect further upside beyond these levels.
3. Operational Improvements and Network Optimization
CSX continues to address past network challenges, improving service reliability and operational efficiency, which are expected to drive volume growth in key sectors such as agriculture, minerals, and intermodal freight.
These improvements are critical for margin expansion and revenue growth, underpinning the stock’s appreciation potential.
4. Favorable Macroeconomic and Industry Tailwinds
The resilient U.S. economy and ongoing federal infrastructure investments support sustained freight demand.
Rail’s environmental advantages and cost efficiency over trucking position CSX to capture increased market share as companies seek sustainable logistics solutions.
5. Financial Strength and Shareholder Returns
CSX boasts strong free cash flow generation, enabling consistent dividend growth and share repurchases.
The company’s valuation remains attractive relative to peers, with a P/E around 15.5 and a dividend yield near 1.4%, making it appealing for both growth and income investors.
6. Technical Support and Market Sentiment
The stock has held solid support near $30–$31 and is trading near $34.60 as of mid-June 2025, showing resilience amid market volatility.
Positive sentiment from institutional investors and steady trading volumes reinforce the potential for a breakout toward $37.50.
Disclosure: I am part of Trade Nation's Influencer program and receive a monthly fee for using their TradingView charts in my analysis.

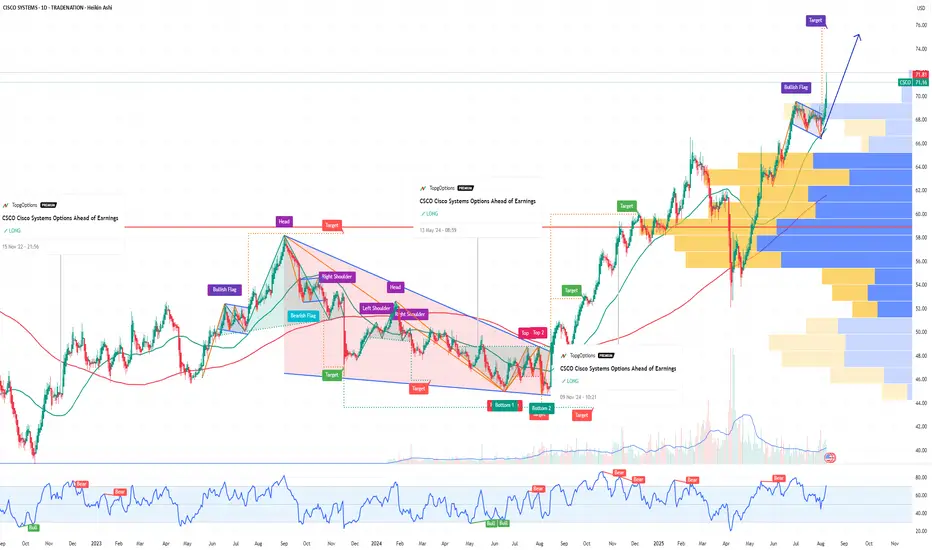
CSCO Cisco Systems Options Ahead of EarningsIf you haven`t bought CSCO before the previous earnings:
Now analyzing the options chain and the chart patterns of CSCO Cisco Systems prior to the earnings report this week,
I would consider purchasing the 75usd strike price Calls with
an expiration date of 2025-10-17,
for a premium of approximately $1.70.
If these options prove to be profitable prior to the earnings release, I would sell at least half of them.
Disclosure: I am part of Trade Nation's Influencer program and receive a monthly fee for using their TradingView charts in my analysis.