Possible Neutral Triangle Breakout – Key Level at 11.07The chart appears to show a completed neutral triangle (a–b–c–d–e), with a breakout emerging above the upper boundary at 11.07.
Wave a looks like a complex structure (possibly elongated flat or flat + zigzag).
The rest of the legs are mostly zigzag forms, consistent with triangle rules.
False breakdown below wave e followed by a strong reversal.
MACD is confirming momentum during the breakout attempt.
As long as price stays above 11.07, this breakout may be sustained. If confirmed, the next target zone could align with the height of the triangle projected upward.
Oscillators

This is freakin' huge for Altcoins!BTC.D is breaking below the monthly RSI support level, and a death cross could be forming on the monthly MACD. Buckle up!

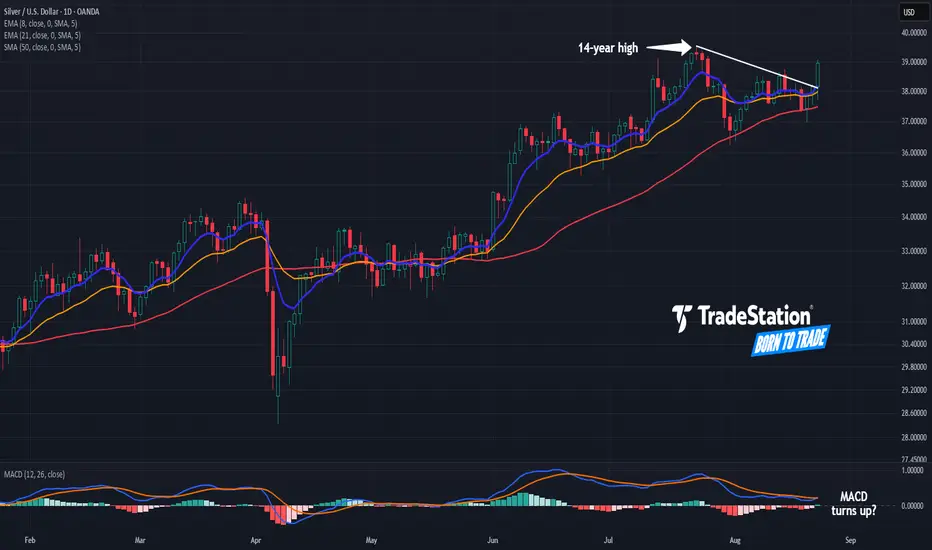
Is Silver Breaking Out?Silver hit a 14-year high last month, and now traders may think the white metal has further upside.
The first pattern on today’s chart is the series of lower highs since late July. XAGUSD pushed above that falling trendline today, potentially signaling a breakout.
Second, prices held the rising 50-day simple moving average. That may suggest its intermediate-term trend is still positive.
Short-term signals may paint a similar picture because the 8-day exponential moving average (EMA) is above the 21-day EMA. MACD could also be trying to turn higher.
TradeStation has, for decades, advanced the trading industry, providing access to stocks, options and futures. If you're born to trade, we could be for you. See our Overview for more.
Past performance, whether actual or indicated by historical tests of strategies, is no guarantee of future performance or success. There is a possibility that you may sustain a loss equal to or greater than your entire investment regardless of which asset class you trade (equities, options or futures); therefore, you should not invest or risk money that you cannot afford to lose. Online trading is not suitable for all investors. View the document titled Characteristics and Risks of Standardized Options at www.TradeStation.com . Before trading any asset class, customers must read the relevant risk disclosure statements on www.TradeStation.com . System access and trade placement and execution may be delayed or fail due to market volatility and volume, quote delays, system and software errors, Internet traffic, outages and other factors.
Securities and futures trading is offered to self-directed customers by TradeStation Securities, Inc., a broker-dealer registered with the Securities and Exchange Commission and a futures commission merchant licensed with the Commodity Futures Trading Commission). TradeStation Securities is a member of the Financial Industry Regulatory Authority, the National Futures Association, and a number of exchanges.
TradeStation Securities, Inc. and TradeStation Technologies, Inc. are each wholly owned subsidiaries of TradeStation Group, Inc., both operating, and providing products and services, under the TradeStation brand and trademark. When applying for, or purchasing, accounts, subscriptions, products and services, it is important that you know which company you will be dealing with. Visit www.TradeStation.com for further important information explaining what this means.
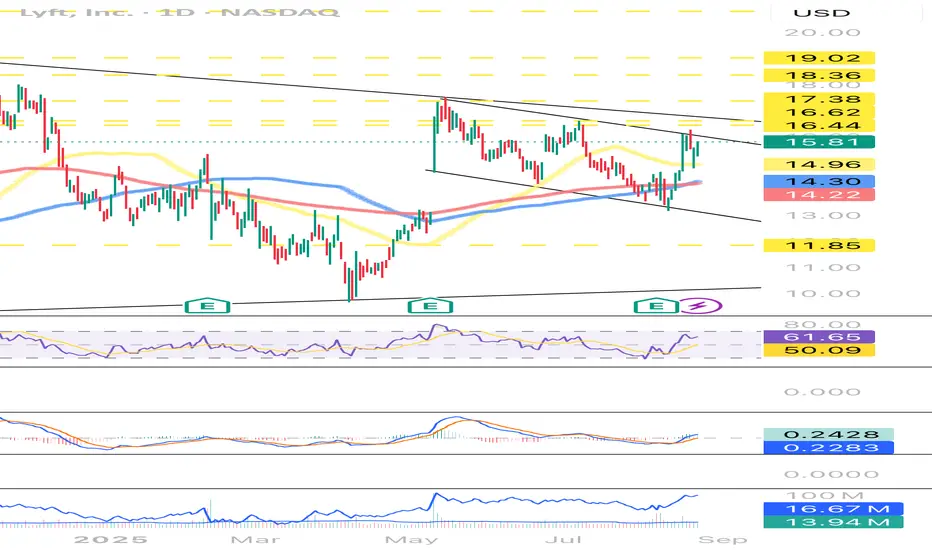
LYFT May Be Ready for a Bullish Breakout
Lift is currently sitting above the 50, 100, and 200 moving averages.
It just filled the gap it left from May earnings and since then it’s been consolidating while forming a bull flag pattern.
RSI is also trending higher but just crossed 60 leaving it room to run and MACD line has also crossed the signal line.
OBV has returned to its May levels and average volume has begun to rise a bit over the last couple of weeks potentially due to to the founders announcing they’re stepping away in Feb2025.
Until there’s a major change in buying sentiment for Lyft it’ll probably keep consolidating. Just needs some good news. Maybe those two founders stepping away could be the start.
USD/CAD Bulls Eye 200DMA RetestHaving cleared resistance at 1.3900 on Thursday, a bullish setup has presented itself in USD/CAD ahead of Jerome Powell’s speech at Jackson Hole.
Longs could be established above the level with a stop beneath for protection, targeting the 200-day moving average found today at 1.40336. The price has already backtested and bounced off 1.3900 in Asian trade, strengthening the merits of the setup. Momentum signals are firmly positive, with RSI (14) trending higher but not yet overbought, while MACD is also trending higher in positive territory above the signal line.
While market pricing for Fed rate cuts is now less rich than just a few days ago, Powell is unlikely to explicitly back a September rate cut in his speech, especially with the August payrolls report on tap early next month.
If the price were to reverse back beneath 1.3900 and hold there, the bullish bias would be invalidated, opening the door for strategies to trade the range down to support at 1.3800.
Good luck!
DS

EURUSD - Bullish Case - Hidden Divergence - Daily 0.382 FibFX:EURUSD has completed its retracement to the daily support which was previously broken and currently being retested. There is 4 hr hidden divergence on RSI indication potential bullish momentum!
My SL is below Daily higher low to capture the bullish move!

Is ALT-season coming soon?Bitcoin’s supply schedule is punctuated by four-year “ halvings ,” where miner issuance is cut in half. Historically, the post‑halving window has coincided with the strongest phase of the cycle as tightening new supply meets rising demand. Liquidity first concentrates in Bitcoin, pushing dominance higher and volatility lower relative to alts. ALT‑season tends to appear later—often after a Bitcoin top or during a prolonged consolidation—when risk appetite broadens, profits rotate into higher‑beta assets, and narratives fragment across sectors. The featured chart compares prior cycles and frames where we might be within the current one.
Where we are in the 2024 halving cycle
At this stage, Bitcoin may be close to a cyclical high—or may already have set it—but confirmation is lacking. Altcoins have rallied meaningfully, yet at a top‑down level there isn’t decisive evidence of a new, durable alt‑season. Key confirmations I’m watching:
• CRYPTOCAP:TOTAL2 breaking out of large cup-and-handle formation.
• 1/ CRYPTOCAP:BTC.D CRYPTOCAP:OTHERS trending up together (alts outperforming BTC both broadly and at the margin).
TOTAL2 — Cup & Handle setup
The weekly structure in CRYPTOCAP:TOTAL2 (crypto market cap excluding BTC) resembles a maturing cup‑and‑handle. What I’ll need to see:
A weekly close above the cup’s rim with follow‑through the next week. Moreover, we need to see a weekly close above the prior 2 highs, which currently could be a double top.
Momentum has been on the decline since the rally on alts started in earnest earlier this year...
OTHERS/BTC — rotation breadth check
This ratio (total market cap excluding the top‑10, divided by BTC) gauges whether capital is rotating into the long‑tail (more speculative / smaller ALTs).
It looks like this could have fallen below long term support which suggests the lower quality ALTs may have permanently lost value against BTC during this cycle. That would be reasonable considering there are so many coins now, many of which will likely fade into dust.
1/BTC.D — macro rotation proxy
The inverse of Bitcoin dominance (1 divided by BTC.D) visualizes altcoin outperformance over the longest available history. Here we can see a recent breakout from a downward trend channel, which is definitely auspicious!
Altcoin spotlights (examples & placeholders)
Replace with your chosen set; keep a mix of large‑caps, infra, and high‑beta to illustrate breadth.
• BINANCE:ETHBTC — let's see a new ATH! There's been a blistering rally, tripling from a rough patch earlier in 2025, but momentum still needs to improve. Also concerning is a major drop off in volume in recent years.
• BINANCE:SOLBTC — Solana had an insane 10x rally early in the cycle, but looks like it could be cooling off with the makings of a head & shoulders amidst declining volume.
• BINANCE:LINKBTC — Chainlink has seen a strong price pump in recent weeks, but like Solana appears to have fading momentum. Unless something changes, it's hard to see it moving materially higher during this cycle.
• BINANCE:XRPBTC — put up a mind blowing vertical 5x rally in late 2024 / early 2025. Like Solana and LINK, it shows declining momentum, so it could very well have peaked for the cycle.
• BINANCE:DOGEBTC — ostensibly the original meme coin, unlike the more practical ALTs we've reviewed DOGE looks to have gas in the tank. Strangely it looks best poised for a breakout given historical pricing and momentum.
Analysis recap
Unfortunately there are both bullish and bearish signals making it hard to lean one way or another right now. In summary:
BITSTAMP:BTCUSD - 2024 halving cycle
• looks close to complete, we may have already seen the top for the cycle
• prior cycles have been a few weeks longer since the halving so there could be a bit further to go
• during the past 2 cycles ALTs have topped once before (2016 cycle), and once after (2020 cycle) the Bitcoin top, which doesn't help us in predicting the outcome of the third (current) cycle.
High-level analysis
CRYPTOCAP:TOTAL2 - cup & handle -- bullish
CRYPTOCAP:OTHERS - break below long term support -- bearish
1/ CRYPTOCAP:BTC.D - breakout of downward trend channel -- bullish
Individual coin analysis
BITSTAMP:ETHUSD COINBASE:SOLUSD COINBASE:LINKUSD BITSTAMP:XRPUSD - all of these coins are technically neutral to bearish in my view, and they are heavyweights.
COINBASE:DOGEUSD - shockingly bullish! Given that this is the epitome of a meme coin, maybe it means animal spirits are lurking in the shadows. It's hard to imagine DOGE pumping without the other coins we've looked at joining the party.
Personal thoughts
I decided to take a hard look at the prospects of an ALT-season to form my own opinion, mainly because I heard someone make a dismissive statement that "ALT-season always follows a Bitcoin top", or something to that effect. I think you can see it's not nearly that simple. Personally I think the market is pretty frothy, and risk assets could take a beating in the coming months. Just in case though, I've still got the XRP moon bag!

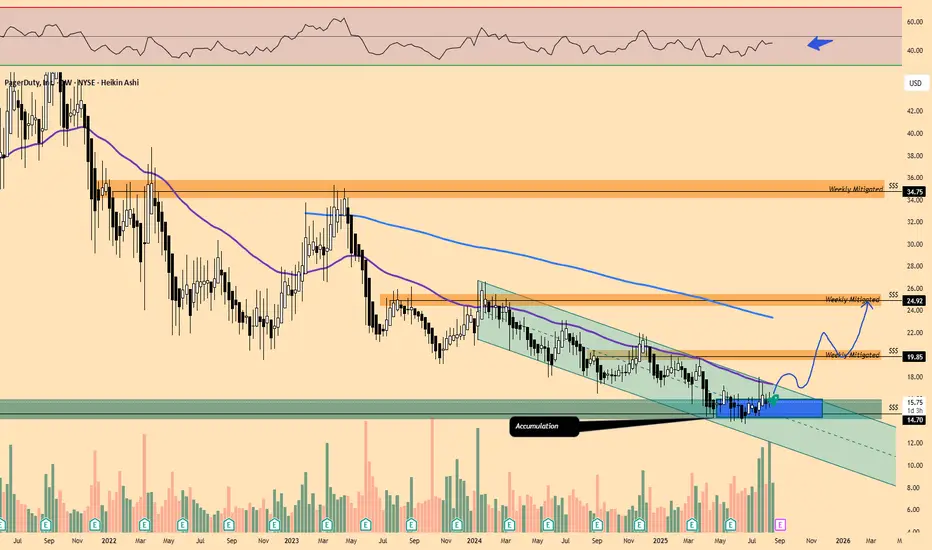
Small Cap Portfolio Trading | $PD ( PagerDuty ) Starting a new position to my #SmallCaps Stock Portfolio:
NYSE:PD (PagerDuty) @ $15.83 bringing my average cost to $15.83 per share.
Short Term Target: $25.00 / 40%+ Gain Potential
Financials:
- Last two years of Free Cash Flow Growth of 50%+ with a projection upwards
- Net income, despite being negative, has improved consistently over the last 3 years.
- Shareholders equity has remained constant over the 3 last years.
- Revenue growth has remained in an upwards trajectory over the last 5 years.
Note: Buying and placed my first order into the Weekly Demand level below 50 RSI and showing a little life in this accumulation box. Also liquidity has been swept in that area. We still have to clear $20.00 for this move to happen though.
GOLD Prediction: BearishTitle: Gold Price Prediction: Targeting 3299
Post:
Hello, TradingView community!
I wanted to share my analysis and outlook on gold prices. Based on current market trends, technical indicators, and fundamental factors, I anticipate that gold will decline to the level of 3299 shortly.
I will continue to monitor the situation closely and adjust my predictions as necessary. As always, this is not financial advice, and I encourage everyone to do their research before making any trading decisions.
Let's see how this plays out!
Happy trading!
#Gold #Trading #TechnicalAnalysis #GoldPrediction #MarketAnalysis

BTC 1H Analysis – Key Triggers Ahead | Day 18💀 Hey , how's it going ? Come over here — Satoshi got something for you !
⏰ We’re analyzing BTC on the 1-hour timeframe timeframe .
👀 On the 1-hour timeframe of Bitcoin, we can see that after hitting the $115,000 zone, it got rejected with a relatively strong red candle and is now moving toward its support at $112,700 .
⚙️ We have two key zones in the RSI : the support zone at 30 , and the resistance zone for long positions at 59.67. Breaking these levels can push Bitcoin toward its alarm zone and sensitive price area for a breakout .
🕯 The size of the red candles is getting smaller , showing reduced selling pressure , while the green reversal candles from $112,700 are closing larger and stronger than before .
💵 USDT.D on the 1-hour timeframe is moving toward its resistance at 4.46% , but the trend is weakening and the size of the buying candles is shrinking . In previous attempts to reach this zone, it faced rejection . If the 4.36% support level is lost , strong inflows could move into Bitcoin .
🔔 Our trading alarm zones are at $115,000 and $112,700 . These zones usually break with increased volume and volatility , and by watching price behavior there , we can find the best trading opportunities .
❤️ Disclaimer : This analysis is purely based on my personal opinion and I only trade if the stated triggers are activated .

NZD/USD: Powell the last hope for Kiwi bullsThe significant dovish shift from the RBNZ at its August meeting has left the Kiwi dollar on the backfoot, closing Wednesday beneath former support at .5850 and the key 200DMA. With Fed rate-cut pricing already so rich heading into Jackson Hole, only an explicit dovish shift from chair Jerome Powell may be enough to prevent a USD rally. As such, a short NZD/USD setup looks to be on the menu.
Positions could be built beneath the 200DMA with a stop either above it or .5850. A retest and rejection of the 200 would strengthen the case. The 50% fib of the April-July rally sits just above .5800, offering a potential early hurdle. A break beneath that opens the way to .5750, .5700 and .5639, all levels that saw plenty of action earlier this year and screen as potential targets depending on risk-reward.
Momentum indicators are flashing bearish across the board, favouring downside. If price reverses back above .5850 and holds, the bearish bias is invalidated.
Good luck!
DS

Why I Think GBPJPY Will Sell...Technical Analysis Hey Rich Friends,
I think GBPJPY will sell for today. This is only my technical analysis, so make sure you check the news and cross-reference any indicators you have on your chart. Here is what I am looking at:
- There has been a rejection of the previous 4H high.
- The buyers are losing steam over the last 12 hours and there is a strong red candle forming.
- The stochastic is facing down, the orange line (slow) and the blue line (fast) have both crossed below 80 and the orange line is on top.
- These are all bearish confirmations for me
Additional information:
- I will wait until price closes below 198.700 to confirm the selling trend and take my trade. I will set a pending order (sell stop) at this level.
- I will be using previous lows as my TPs and previous highs as my SL.
Good luck if you decide to take this trade.

BTC Analysis - August 20, 2025, 09:28 AM EDT 📊 Price: ~$114,016, consolidating after failing $120,000 resistance (24h).
Technical Analysis:
• Supports: $112,300, $108,000
• Resistance: $116,800, $120,000
• RSI: 46 (daily, neutral), 50 (4-hour)
• MACD: Bearish, histogram narrowing
• EMAs: Below 20-day ($117,300), above 50/200-day ($115K/$110K)
• Bollinger: Near mid-band ($115,400, daily)
Patterns:
• Ascending Channel: Retest of mid-channel ($114K–$115K, August 15–20)
• Bearish Pinbar: August 14
• Doji: August 19
On-Chain:
• MVRV Z-score: 2.2, neutral, nearing rally trigger
• Active Addresses: Up 3% (30d)
• CDD: Low, strong HODLing
• LTH Supply: 74% held >155 days
• STH Supply: Down 13% (30d), profit-taking
Fundamentals:
• M2: $107T (Feb 2025), 3.8% growth, 0.94 correlation with BTC
• ETFs: $15B inflows (2025), $0.8B weekly (August 15)
• Regulatory: GENIUS Act supports crypto (July 2025)
BTC Reserve: Exchange reserves down 10% (2025), low selling pressure.
Dominance: 61% (BTC.D), neutral, altseason if <63.2%.
Social Sentiment: 450K #BTC mentions on X, 55% bullish ( low volatility, dip-buying).
Trends: Neutral short-term, possible dip to $112,300. Long-term: $130K–$200K (2026).
Signal: Buy (60% confidence)
• Buy on dips: $112,300 or $108,000
• Stop-loss: <$108,000
• Target: $116,800 short-term, $130,000 (Q4 2025)
Disclaimer: Research before investing. #BTC

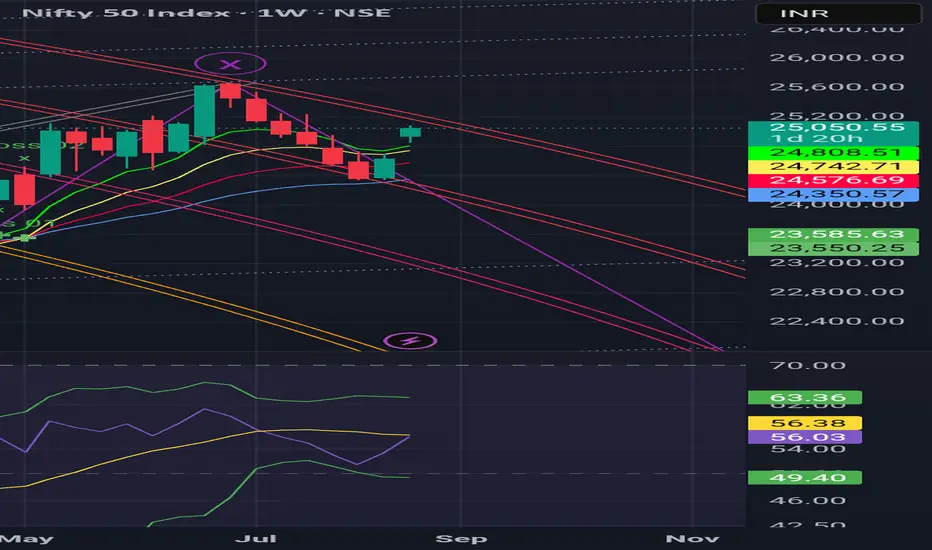
Wait till the Friday closing.There's a good chance that starting the following week, the Nifty will begin to decline even more quickly if it closes this week so that the corresponding RSI oscillator closes only a little bit near this yellow moving average line.
BTC 1H Analysis – Key Triggers Ahead | Day 17💀 Hey , how's it going ? Come over here — Satoshi got something for you !
⏰ We’re analyzing BTC on the 1-hour timeframe timeframe .
👀 On the 1-hour timeframe, we can see that Bitcoin, after losing the $115,000 support zone, moved toward its next support at $113,000 .
⚙️ Our key RSI zone is 27.89, and if this level is lost, Bitcoin will face more selling pressure. The next key RSI zone is 49.74, and breaking above this level could push Bitcoin higher .
🕯 The size of the red candles has increased, and with each rise in trading volume, selling pressure grows stronger. Step by step, as supports are lost (big money in whale wallets and unrealized positions being released), Bitcoin faces heavier selling pressure .
💵 USD.D on the 1-hour timeframe is moving upward and is facing a strong resistance around 4.5%. If this resistance is broken, Bitcoin will likely come under even more selling pressure .
🔔 Our Bitcoin alert zone is set at $113,000: if this zone is broken, Bitcoin could fall to lower support levels. Our alert zone for a long trade is $115,000, and by observing price action around these two zones, we can identify the best type of trade .
❤️ Disclaimer : This analysis is purely based on my personal opinion and I only trade if the stated triggers are activated .

AUDUSD Long OpportunityWe broke the floor but are oversold on the oscillators, we are going to enter here and see if we can catch the ride up for the retest.
if we keep dropping we will space out entries and cost average our way to secondary TP. Keep positions lights, we may use up to 5 additional entries to navigate the pull back. We will look to exit when we get overbought on the oscillators (RSI, CCI etc etc)

GBPJPY Wave Analysis – 20 August 2025- GBPJPY reversed from resistance zone
- Likely to fall to support level 198.00
GBPJPY currency pair recently reversed up from the resistance zone located between the long-term resistance level 200.00 (which has been reversing the price from October of 2024) and the upper daily Bollinger Band.
The downward reversal from this resistance zone stopped the earlier impulse wave iii of the intermediate wave (3) from the end of May.
Given the overbought daily Stochastic, GBPJPY currency pair can be expected to fall to the next support level 198.00.

S&P 500 Shows Early Signs of Momentum Loss Ahead of Jackson HoleThe S&P 500 has begun to show signs of momentum loss ahead of the Jackson Hole meeting. The number of member stocks trading above their 200-day moving average has not increased, even as the index made new highs. RSI is showing a negative divergence, and the index has slipped below its short-term yellow trendline.
In addition, crypto markets sold off early Monday, and the VIX opened the week with a gap higher, moving above its short-term downtrend. These are still only early signals and not yet concrete confirmation, but traders should be cautious of potential profit-taking ahead of Jackson Hole, where Powell may push back against expectations for rapid rate cuts.

Silver: Bulls clinging to 50DMA, bears smell opportunitySilver finds itself resting on the key 50DMA, a level traders have used as a launchpad for bullish moves on the last two occasions of testing. However, with unconvincing price action and momentum indicators turning neutral, it may be a case of third time lucky for bears on this occasion.
Silver has already broken beneath the February 2012 high of $37.46, which has acted as something akin to a dividing line for price action since first being crossed in July—a small win for bears seeking a deeper pullback. But given how often bears have attempted to break beneath the 50DMA only to see the price reverse back in their face, to bolster the case for shorts it would be preferable to see a close beneath the level before establishing bearish positions. Potential targets include $36.27 and $35.50. A stop above either the 50DMA or $37.46 would offer protection against reversal.
If the 50DMA holds firm again, the setup could be flipped with longs established above the level with a stop beneath for protection. $38.73 screens as an initial target having acted as both support and resistance in July and August.
Good luck!
DS

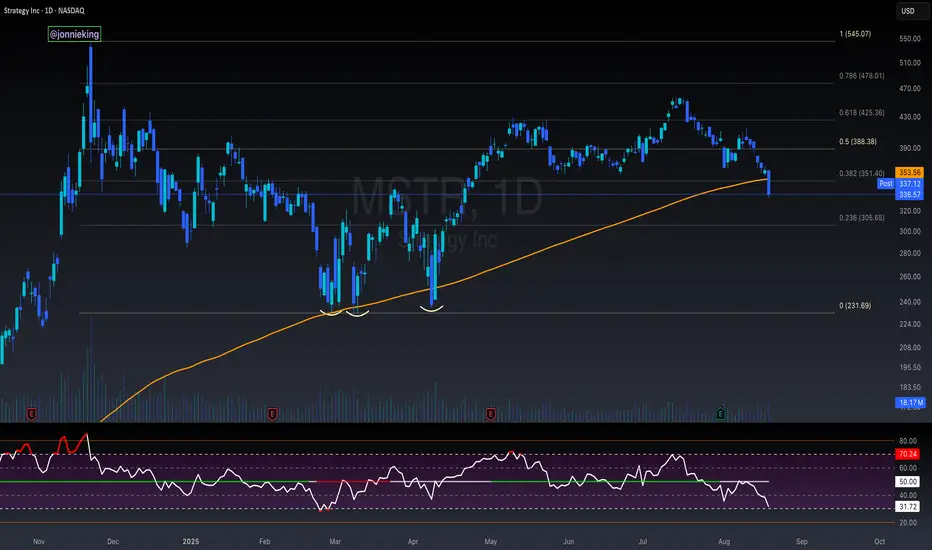
$MSTR Testing Historical Key Support at 200DMAMicroStrategy had its largest daily close below the 200DMA in the past 893 days.
Historically this support level has market key bottoms.
RSI allows for a bit more pain to the downside, but NASDAQ:MSTR should find a bottom soon.
If not, $305 is in play.
BTC 1H Analysis – Key Triggers Ahead | Day 16💀 Hey , how's it going ? Come over here — Satoshi got something for you !
⏰ We’re analyzing BTC on the 1-hour timeframe timeframe .
👀 On the 1-hour timeframe for Bitcoin, we can see that after losing the $115,000 support zone, Bitcoin is moving toward lower price levels. With increasing selling pressure, a deeper correction is likely.
⚙️ Our key RSI level is 33. If this level breaks down, short positions will gain more momentum, and the probability of entering the oversold zone will increase.
🕯 Candlestick behavior shows that bearish/red candles are larger in size and volume, initiating each corrective wave strongly. In contrast, bullish candles are smaller in size, higher in number, and have less volume, which reflects the strong dominance of sellers.
💵 USDT dominance (1-hour timeframe) has successfully broken above 4.37%. The next resistance lies at 4.50%. If this level is also broken, it will likely trigger even more selling pressure on Bitcoin.
🔔 Alarm Zone : There is no specific alarm zone right now, but by watching for pullbacks and breakouts in either direction, we can determine when to open new positions.
❤️ Disclaimer : This analysis is purely based on my personal opinion and I only trade if the stated triggers are activated .

China A50 breakout test looms at December highsChina’s A50 index appears to be on a collision course with the swing high set in December last year, motoring higher like so many other Chinese indices. If we see a clean break of the level, there’s very little technically standing in the way of a potential move back towards the blow-off highs set in October 2024.
14,409 is the level in question, with the current trajectory putting it on track to be tested as soon as Tuesday. Should we see a break and close above it, or at least a definitive bullish move, longs could be established with a stop beneath for protection.
15,000 screens as an initial target simply because it’s a round number, along with 15,079—the 23.6% fib of the September–October surge last year. Beyond that, 15,200 looks to be the last level of any significance before the October 2024 swing high of 16,322.
Of course, if the price cannot meaningfully clear 14,409, the setup could be flipped, with shorts set beneath the level with a stop above for protection. 14,185 and 13,700 screen as potential targets.
MACD and RSI (14) are both generating bullish momentum signals, favouring a bias to buy dips and topside breaks rather than selling rallies.
Good luck!
DS

BTC 1H Analysis – Key Triggers Ahead | Day 15💀 Hey , how's it going ? Come over here — Satoshi got something for you !
⏰ We’re analyzing BTC on the 4-hour timeframe timeframe .
👀 On the 4H timeframe of Bitcoin, we can see that after breaking the $117,000 zone, Bitcoin faced strong selling pressure, which aligned with the Tokyo session open.
⚙️ The key RSI level is at 26. If this level is lost, Bitcoin could face even stronger selling pressure. The current RSI is around 30, which is marking a boundary for short-trade volatility.
🕯 Both trading volume and sell orders are increasing. With stronger selling pressure, Bitcoin could see a deeper correction.
💵 USDT dominance is getting heavier and forming green candles. However, the dominance is showing weakness in its upward trend. With strong support from USDT buyers, it could trigger a deeper correction across the broader market.
🔔 It’s better not to set alert zones yet, as Bitcoin is currently in a decision-making area, building a new structure. Once this new structure forms, our alert zones will become clearer.
❤️ Disclaimer : This analysis is purely based on my personal opinion and I only trade if the stated triggers are activated .
