RSI Indicator LIES! Untold Truth About RSI!
The Relative Strength Index (RSI) is a classic technical indicator that is applied to identify the overbought and oversold states of the market.
While the RSI looks simple to use, there is one important element in it that many traders forget about: it's a lagging indicator.
This means it reacts to past price movements rather than predicting future ones. This inherent lag can sometimes mislead traders, particularly when the markets are volatile or trade in a strong bullish/bearish trend.
In this article, we will discuss the situations when RSI indicator will lie to you. We will go through the instances when the indicator should not be relied and not used on, and I will explain to you the best strategy to apply RSI.
Relative Strength Index analyzes the price movements over a specific time period and displays a score between 0 and 100.
Generally, an RSI above 70 suggests an overbought condition, while an RSI below 30 suggests an oversold condition.
By itself, the overbought and overbought conditions give poor signals, simply because the market may remain in these conditions for a substantial period of time.
Take a look at a price action on GBPCHF. After the indicator showed the oversold condition, the pair dropped 150 pips lower before the reversal initiated.
So as an extra confirmation , traders prefer to look for RSI divergence - the situation when the price action and indicator move in the opposite direction.
Above is the example of RSI divergence: Crude Oil formed a sequence of higher highs, while the indicator formed a higher high with a consequent lower high. That confirmed the overbought state of the market, and a bearish reversal followed.
However, only few knows that even a divergence will provide accurate signals only in some particular instances.
When you identified RSI divergence, make sure that it happened after a test of an important key level.
Historical structures increase the probability that the RSI divergence will accurately indicate the reversal.
Above is the example how RSI divergence gave a false signal on USDCAD.
However, the divergence that followed after a test of a key level, gave a strong bearish signal.
There are much better situations when RSI can be applied, but we will discuss later on, for now, the main conclusion is that
RSI Divergence beyond key levels most of the time will provide low accuracy signals.
But there is one particular case, when RSI divergence will give the worst, the most terrible signal.
In very rare situations, the market may trade in a strong bullish trend, in the uncharted territory, where there are no historical price levels.
In such cases, RSI bullish divergence will constantly lie , making retail traders short constantly and lose their money.
Here is what happens with Gold on a daily.
The market is trading in the uncharted territory, updated the All-Time Highs daily.
Even though there is a clear overbought state and a divergence,
the market keeps growing.
Only few knows, however, that even though RSI is considered to be a reversal, counter trend indicator, it can be applied for trend following trading.
On a daily time frame, after the price sets a new high, wait for a pullback to a key horizontal support.
Your bullish signal, will be a bearish divergence on an hourly time frame.
Here is how the price retested a support based on a previous ATH on Gold. After it approached a broken structure, we see a confirmed bearish divergence.
That gives a perfect trend-following signal to buy the market.
A strong bullish rally followed then.
RSI indicator is a very powerful tool, that many traders apply incorrectly.
When the market is trading in a strong trend, this indicator can be perfectly applied for following the trend, not going against that.
I hope that the cases that I described will help you not lose money, trading with Relative Strength Index.
❤️Please, support my work with like, thank you!❤️
Oscillators

Finding a section to start tradingHello, traders.
If you "Follow", you can always get new information quickly.
Please also click "Boost".
Have a nice day today.
-------------------------------------
The BW indicator included in the TS - BW indicator is an indicator expressed by synthesizing the MACD, StochRSI, CCI, PVT, and superTrend indicators.
When the BW indicator
- records a high point, it is time to sell, and
- When it records a low point, it is time to buy.
The BW indicator in the price candle section is the same as the BW indicator included in the TS - BW indicator, but it is an indicator that is expressed in the price candle when a horizontal line is formed at the highest or lowest point.
If you look at the position of the BW indicator expressed in the price candle section, you can know when to proceed with a trade.
I think you can be confident about starting a trade by referring to the status of the MS-Signal (M-Signal on 1D, 1W, 1M charts) indicator that can confirm the trend.
If you add the HA-Low, HA-High indicators here, you can create a more detailed trading strategy.
Have a good time.
Thank you.
--------------------------------------------------
- Big picture
It is expected that a full-scale uptrend will start when it rises above 29K.
The section that is expected to be touched in the next bull market is 81K-95K.
#BTCUSD 12M
1st: 44234.54
2nd: 61383.23
3rd: 89126.41
101875.70-106275.10 (overshooting)
4th: 13401.28
151166.97-157451.83 (overshooting)
5th: 178910.15
These are points where resistance is likely to occur in the future.
We need to check if these points can be broken upward.
We need to check the movement when this section is touched because I think a new trend can be created in the overshooting section.
#BTCUSD 1M
If the major uptrend continues until 2025, it is expected to start forming a pull back pattern after rising to around 57014.33.
1st: 43833.05
2nd: 32992.55
-----------------

How to read mean returns (Expand the indicator)Mean returns is a trend detection and overextension indicator. It oscillates around the value of 0. The mean return line in reality is the orange one as well as the blue one. The difference is in the number of data points into the past that they consider. Since the value of those lines is the expected value of the returns in period t, then if it's over 0 the expectation is that returns will be positive, as previously the price has been trending higher. The opposite being true as well.
Meanwhile, the red and green line represent the expected upwards and expected downwards returns. That means you only take the expected value for the days in which the return was positive or negative accordingly. Therefore, if the mean returns are over the expected upwards returns the price is likely to be overextended, and vice versa.
Other adjustments were made to consider the current candle. This code will remain private, as it took a lot of effort to invent. I hope you are able to understand the math. If you can't, I hope this at least allowed you to read the meaning of the indicator through this.

The Mechanics Of Trading - Part XII - 6-4-24 FlagsPart XII
I started this video because a friend asked me for help determining trends on multi-interval (time frames) and asked how I look at trading across multiple intervals. Asking how to best setup/use price trends to capture the best trade setups.
Essentially, it comes down to three key components...
A. Initial reversal/impulse waves should be traded lightly (if at all). They are the "potential price reversal setups" that are usually the most dangerous for traders (and often fairly short in length).
B. Looking for the second wave to form provides traders with the opportunity to catch the bigger Wave-3. This wave forms after the impulse (Wave-1) and a corrective wave (Wave-2), which must stay below any previous ultimate high or above any previous ultimate low.
C. Wave-3, and Wave-5 if applicable, are where traders can flex their muscles related to trade size using the techniques I present to try to capture the MEAT (Sweet Spot) of any trend.
Remember, after Wave-3, you must prepare for the potential end of a trend setup where volatility is likely to increase and risks become a bit more elevated.
I go over multiple techniques in this video.
Fibonacci techniques and Fibonacci Price Theory
Anchor Bars (breakaway bars)
Using Fibonacci Retracements to identify key support/resistance levels for trending
Stochastics
RSI
Wave formations (ZigZag)
and Others
This video is designed as an instructional video to help you incorporate usable techniques into your own trading style.
Hope you enjoy.

The Mechanics Of Trading - Part XI - SPY Flagging ExamplePart XI
I started this video because a friend asked me for help determining trends on multi-interval (time frames) and asked how I look at trading across multiple intervals. Asking how to best setup/use price trends to capture the best trade setups.
Essentially, it comes down to three key components...
A. Initial reversal/impulse waves should be traded lightly (if at all). They are the "potential price reversal setups" that are usually the most dangerous for traders (and often fairly short in length).
B. Looking for the second wave to form provides traders with the opportunity to catch the bigger Wave-3. This wave forms after the impulse (Wave-1) and a corrective wave (Wave-2), which must stay below any previous ultimate high or above any previous ultimate low.
C. Wave-3, and Wave-5 if applicable, are where traders can flex their muscles related to trade size using the techniques I present to try to capture the MEAT (Sweet Spot) of any trend.
Remember, after Wave-3, you must prepare for the potential end of a trend setup where volatility is likely to increase and risks become a bit more elevated.
I go over multiple techniques in this video.
Fibonacci techniques and Fibonacci Price Theory
Anchor Bars (breakaway bars)
Using Fibonacci Retracements to identify key support/resistance levels for trending
Stochastics
RSI
Wave formations (ZigZag)
and Others
This video is designed as an instructional video to help you incorporate usable techniques into your own trading style.
Hope you enjoy.

The Mechanics Of Trading - Part X - EOD 2 Min ES RecapPart X - End Of Day 2 Min ES Recap
I started this video because a friend asked me for help determining trends on multi-interval (time frames) and asked how I look at trading across multiple intervals. Asking how to best setup/use price trends to capture the best trade setups.
Essentially, it comes down to three key components...
A. Initial reversal/impulse waves should be traded lightly (if at all). They are the "potential price reversal setups" that are usually the most dangerous for traders (and often fairly short in length).
B. Looking for the second wave to form provides traders with the opportunity to catch the bigger Wave-3. This wave forms after the impulse (Wave-1) and a corrective wave (Wave-2), which must stay below any previous ultimate high or above any previous ultimate low.
C. Wave-3, and Wave-5 if applicable, are where traders can flex their muscles related to trade size using the techniques I present to try to capture the MEAT (Sweet Spot) of any trend.
Remember, after Wave-3, you must prepare for the potential end of a trend setup where volatility is likely to increase and risks become a bit more elevated.
I go over multiple techniques in this video.
Fibonacci techniques and Fibonacci Price Theory
Anchor Bars (breakaway bars)
Using Fibonacci Retracements to identify key support/resistance levels for trending
Stochastics
RSI
Wave formations (ZigZag)
and Others
This video is designed as an instructional video to help you incorporate usable techniques into your own trading style.
Hope you enjoy.

The Mechanics Of Trading - Part IX - ES Breakdown To SupportPart IX
I started this video because a friend asked me for help determining trends on multi-interval (time frames) and asked how I look at trading across multiple intervals. Asking how to best setup/use price trends to capture the best trade setups.
Essentially, it comes down to three key components...
A. Initial reversal/impulse waves should be traded lightly (if at all). They are the "potential price reversal setups" that are usually the most dangerous for traders (and often fairly short in length).
B. Looking for the second wave to form provides traders with the opportunity to catch the bigger Wave-3. This wave forms after the impulse (Wave-1) and a corrective wave (Wave-2), which must stay below any previous ultimate high or above any previous ultimate low.
C. Wave-3, and Wave-5 if applicable, are where traders can flex their muscles related to trade size using the techniques I present to try to capture the MEAT (Sweet Spot) of any trend.
Remember, after Wave-3, you must prepare for the potential end of a trend setup where volatility is likely to increase and risks become a bit more elevated.
I go over multiple techniques in this video.
Fibonacci techniques and Fibonacci Price Theory
Anchor Bars (breakaway bars)
Using Fibonacci Retracements to identify key support/resistance levels for trending
Stochastics
RSI
Wave formations (ZigZag)
and Others
This video is designed as an instructional video to help you incorporate usable techniques into your own trading style.
Hope you enjoy.

The Mechanics Of Trading - Part VIII - Learning PatiencePart VIII
I started this video because a friend asked me for help determining trends on multi-interval (time frames) and asked how I look at trading across multiple intervals. Asking how to best setup/use price trends to capture the best trade setups.
Essentially, it comes down to three key components...
A. Initial reversal/impulse waves should be traded lightly (if at all). They are the "potential price reversal setups" that are usually the most dangerous for traders (and often fairly short in length).
B. Looking for the second wave to form provides traders with the opportunity to catch the bigger Wave-3. This wave forms after the impulse (Wave-1) and a corrective wave (Wave-2), which must stay below any previous ultimate high or above any previous ultimate low.
C. Wave-3, and Wave-5 if applicable, are where traders can flex their muscles related to trade size using the techniques I present to try to capture the MEAT (Sweet Spot) of any trend.
Remember, after Wave-3, you must prepare for the potential end of a trend setup where volatility is likely to increase and risks become a bit more elevated.
I go over multiple techniques in this video.
Fibonacci techniques and Fibonacci Price Theory
Anchor Bars (breakaway bars)
Using Fibonacci Retracements to identify key support/resistance levels for trending
Stochastics
RSI
Wave formations (ZigZag)
and Others
This video is designed as an instructional video to help you incorporate usable techniques into your own trading style.
Hope you enjoy.

The Mechanics Of Trading - Part VII - 2 Min ES TrendingPart VII - Applying Success/Failure & Fibonacci Price Theory
I started this video because a friend asked me for help determining trends on multi-interval (time frames) and asked how I look at trading across multiple intervals. Asking how to best setup/use price trends to capture the best trade setups.
Essentially, it comes down to three key components...
A. Initial reversal/impulse waves should be traded lightly (if at all). They are the "potential price reversal setups" that are usually the most dangerous for traders (and often fairly short in length).
B. Looking for the second wave to form provides traders with the opportunity to catch the bigger Wave-3. This wave forms after the impulse (Wave-1) and a corrective wave (Wave-2), which must stay below any previous ultimate high or above any previous ultimate low.
C. Wave-3, and Wave-5 if applicable, are where traders can flex their muscles related to trade size using the techniques I present to try to capture the MEAT (Sweet Spot) of any trend.
Remember, after Wave-3, you must prepare for the potential end of a trend setup where volatility is likely to increase and risks become a bit more elevated.
I go over multiple techniques in this video.
Fibonacci techniques and Fibonacci Price Theory
Anchor Bars (breakaway bars)
Using Fibonacci Retracements to identify key support/resistance levels for trending
Stochastics
RSI
Wave formations (ZigZag)
and Others
This video is designed as an instructional video to help you incorporate usable techniques into your own trading style.
Hope you enjoy.

The Mechanics Of Trading - Part VI - 2 Min ES ChartPart VI
I started this video because a friend asked me for help determining trends on multi-interval (time frames) and asked how I look at trading across multiple intervals. Asking how to best setup/use price trends to capture the best trade setups.
Essentially, it comes down to three key components...
A. Initial reversal/impulse waves should be traded lightly (if at all). They are the "potential price reversal setups" that are usually the most dangerous for traders (and often fairly short in length).
B. Looking for the second wave to form provides traders with the opportunity to catch the bigger Wave-3. This wave forms after the impulse (Wave-1) and a corrective wave (Wave-2), which must stay below any previous ultimate high or above any previous ultimate low.
C. Wave-3, and Wave-5 if applicable, are where traders can flex their muscles related to trade size using the techniques I present to try to capture the MEAT (Sweet Spot) of any trend.
Remember, after Wave-3, you must prepare for the potential end of a trend setup where volatility is likely to increase and risks become a bit more elevated.
I go over multiple techniques in this video.
Fibonacci techniques and Fibonacci Price Theory
Anchor Bars (breakaway bars)
Using Fibonacci Retracements to identify key support/resistance levels for trending
Stochastics
RSI
Wave formations (ZigZag)
and Others
This video is designed as an instructional video to help you incorporate usable techniques into your own trading style.
Hope you enjoy.

The Mechanics Of Trading - Part VPart V - Deploying Success/Failure Techniques
I started this video because a friend asked me for help determining trends on multi-interval (time frames) and asked how I look at trading across multiple intervals. Asking how to best setup/use price trends to capture the best trade setups.
Essentially, it comes down to three key components...
A. Initial reversal/impulse waves should be traded lightly (if at all). They are the "potential price reversal setups" that are usually the most dangerous for traders (and often fairly short in length).
B. Looking for the second wave to form provides traders with the opportunity to catch the bigger Wave-3. This wave forms after the impulse (Wave-1) and a corrective wave (Wave-2), which must stay below any previous ultimate high or above any previous ultimate low.
C. Wave-3, and Wave-5 if applicable, are where traders can flex their muscles related to trade size using the techniques I present to try to capture the MEAT (Sweet Spot) of any trend.
Remember, after Wave-3, you must prepare for the potential end of a trend setup where volatility is likely to increase and risks become a bit more elevated.
I go over multiple techniques in this video.
Fibonacci techniques and Fibonacci Price Theory
Anchor Bars (breakaway bars)
Using Fibonacci Retracements to identify key support/resistance levels for trending
Stochastics
RSI
Wave formations (ZigZag)
and Others
This video is designed as an instructional video to help you incorporate usable techniques into your own trading style.
Hope you enjoy.

The Mechanics Of Trading - Part IVPart IV - Decision Making (A vs B)
I started this video because a friend asked me for help determining trends on multi-interval (time frames) and asked how I look at trading across multiple intervals. Asking how to best setup/use price trends to capture the best trade setups.
Essentially, it comes down to three key components...
A. Initial reversal/impulse waves should be traded lightly (if at all). They are the "potential price reversal setups" that are usually the most dangerous for traders (and often fairly short in length).
B. Looking for the second wave to form provides traders with the opportunity to catch the bigger Wave-3. This wave forms after the impulse (Wave-1) and a corrective wave (Wave-2), which must stay below any previous ultimate high or above any previous ultimate low.
C. Wave-3, and Wave-5 if applicable, are where traders can flex their muscles related to trade size using the techniques I present to try to capture the MEAT (Sweet Spot) of any trend.
Remember, after Wave-3, you must prepare for the potential end of a trend setup where volatility is likely to increase and risks become a bit more elevated.
I go over multiple techniques in this video.
Fibonacci techniques and Fibonacci Price Theory
Anchor Bars (breakaway bars)
Using Fibonacci Retracements to identify key support/resistance levels for trending
Stochastics
RSI
Wave formations (ZigZag)
and Others
This video is designed as an instructional video to help you incorporate usable techniques into your own trading style.
Hope you enjoy.

The Mechanics Of Trading - Part IIIPart III
I started this video because a friend asked me for help determining trends on multi-interval (time frames) and asked how I look at trading across multiple intervals. Asking how to best setup/use price trends to capture the best trade setups.
Essentially, it comes down to three key components...
A. Initial reversal/impulse waves should be traded lightly (if at all). They are the "potential price reversal setups" that are usually the most dangerous for traders (and often fairly short in length).
B. Looking for the second wave to form provides traders with the opportunity to catch the bigger Wave-3. This wave forms after the impulse (Wave-1) and a corrective wave (Wave-2), which must stay below any previous ultimate high or above any previous ultimate low.
C. Wave-3, and Wave-5 if applicable, are where traders can flex their muscles related to trade size using the techniques I present to try to capture the MEAT (Sweet Spot) of any trend.
Remember, after Wave-3, you must prepare for the potential end of a trend setup where volatility is likely to increase and risks become a bit more elevated.
I go over multiple techniques in this video.
Fibonacci techniques and Fibonacci Price Theory
Anchor Bars (breakaway bars)
Using Fibonacci Retracements to identify key support/resistance levels for trending
Stochastics
RSI
Wave formations (ZigZag)
and Others
This video is designed as an instructional video to help you incorporate usable techniques into your own trading style.
Hope you enjoy.

The Mechanics Of Trading - Part IIPart I
I started this video because a friend asked me for help determining trends on multi-interval (time frames) and asked how I look at trading across multiple intervals. Asking how to best setup/use price trends to capture the best trade setups.
Essentially, it comes down to three key components...
A. Initial reversal/impulse waves should be traded lightly (if at all). They are the "potential price reversal setups" that are usually the most dangerous for traders (and often fairly short in length).
B. Looking for the second wave to form provides traders with the opportunity to catch the bigger Wave-3. This wave forms after the impulse (Wave-1) and a corrective wave (Wave-2), which must stay below any previous ultimate high or above any previous ultimate low.
C. Wave-3, and Wave-5 if applicable, are where traders can flex their muscles related to trade size using the techniques I present to try to capture the MEAT (Sweet Spot) of any trend.
Remember, after Wave-3, you must prepare for the potential end of a trend setup where volatility is likely to increase and risks become a bit more elevated.
I go over multiple techniques in this video.
Fibonacci techniques and Fibonacci Price Theory
Anchor Bars (breakaway bars)
Using Fibonacci Retracements to identify key support/resistance levels for trending
Stochastics
RSI
Wave formations (ZigZag)
and Others
This video is designed as an instructional video to help you incorporate usable techniques into your own trading style.
Hope you enjoy.

The Mechanics Of Trading - Part IPart I
I started this video because a friend asked me for help determining trends on multi-interval (time frames) and asked how I look at trading across multiple intervals. Asking how to best setup/use price trends to capture the best trade setups.
Essentially, it comes down to three key components...
A. Initial reversal/impulse waves should be traded lightly (if at all). They are the "potential price reversal setups" that are usually the most dangerous for traders (and often fairly short in length).
B. Looking for the second wave to form provides traders with the opportunity to catch the bigger Wave-3. This wave forms after the impulse (Wave-1) and a corrective wave (Wave-2), which must stay below any previous ultimate high or above any previous ultimate low.
C. Wave-3, and Wave-5 if applicable, are where traders can flex their muscles related to trade size using the techniques I present to try to capture the MEAT (Sweet Spot) of any trend.
Remember, after Wave-3, you must prepare for the potential end of a trend setup where volatility is likely to increase and risks become a bit more elevated.
I go over multiple techniques in this video.
Fibonacci techniques and Fibonacci Price Theory
Anchor Bars (breakaway bars)
Using Fibonacci Retracements to identify key support/resistance levels for trending
Stochastics
RSI
Wave formations (ZigZag)
and Others
This video is designed as an instructional video to help you incorporate usable techniques into your own trading style.
Hope you enjoy.

Trading with RSI: The Bad, The Good and Even BetterIn this video I explain how to use RSI (Relative Strength Index) to make trading decisions. You'll learn how to properly use RSI oversold condition, combining low timeframe price action signals with high level context analysis.
Besides of explaining three different strategies (the bad, the good and even better) I'll do back-testing on historical data to demonstrate how those strategies translate into real trading results.
Disclaimer
I don't give trading or investing advice, just sharing my thoughts.

1-Indicator Strategy For Beginners...The Stochastic Hey Rich Friends,
Happy Wednesday!
I wanted to share one of my top 3 favorite indicators with you.... The Stochastic (STOCH). As a leading (vs lagging) indicator, it is perfect for beginners because you can find entry and exit signals with only a few key details.
Adding the STOCH to your chart:
1. Search the indicators for "STOCHASTIC" and click once to add to your chart. The only thing that I modify is the thickness of the lines but feel free to make further changes to your liking.
2. Make sure that the "indicators and financial values" option is ON. Right-click your scales, select labels, and make sure "indicators and financial values" is checkmarked.
Entry signals for a buy:
- The STOCH is facing up
- The fast line (blue) is above the slow line (orange)
- The STOCH has crossed above the 20% level, from oversold, back into the blue-shaded area
Exit the trade or take profit once the STOCH has crossed back below the 80% level, from overbought, into the blue-shaded area.
Entry Signals for a sell:
- The STOCH is facing down
- The slow line (orange) is above the fast line (blue)
- The STOCH has crossed below the 80% level, from overbought, back into the blue shaded area
Exit the trade or take profit once the STOCH has crossed back above the 20% level, from oversold, into the blue-shaded area.
I hope that this video helps someone become a more independent and profitable trader. Let me know in the comments if you try this strategy!
Peace and Profits,
Cha

Don't Get Duped by the RSIWhy This Popular Indicator Can Lead You Astray
The Relative Strength Index (RSI) is a common technical analysis tool used by traders to gauge whether an asset is overbought (priced too high) or oversold (priced too low). It analyzes price movements over a specific period (often 14 days) and displays a score between 0 and 100. Generally, an RSI above 70 suggests an overbought condition, while an RSI below 30 suggests an oversold condition.
While the RSI seems straightforward, there's a crucial catch: it's a lagging indicator. This means it reacts to past price movements rather than predicting future ones. This inherent lag can sometimes mislead traders, particularly when markets are volatile or trending strongly.
Here's how the RSI's lagging nature can be deceptive:
Overbought Traps: The RSI might reach overbought territory (above 70) during a strong uptrend. However, instead of signaling an imminent reversal, the price could keep climbing, potentially reaching new highs. This can lure traders into believing a correction is coming (based on the high RSI) only to miss out on further gains.
Oversold Deceptions: Conversely, the RSI might dip into oversold territory (below 30) during a downtrend. This could be interpreted as a buying opportunity, anticipating a bounce back. But, in a strong downtrend, the price may continue to fall, and the RSI might stay oversold for extended periods.
How to Use the RSI More Effectively:
Despite its limitations, the RSI can still be a valuable tool when used strategically:
Confirmation Tool: Combine the RSI with other technical indicators or chart patterns for confirmation. For example, an RSI divergence (where the RSI moves in the opposite direction of the price) might strengthen a potential reversal signal.
Identify Trending Markets: The RSI can help identify the strength of a trend. During strong uptrends, the RSI may frequently reach overbought levels without signaling an immediate reversal. Conversely, in downtrends, the RSI may stay oversold for extended periods.
Identify Overbought/Oversold Conditions: While not a precise timing tool, the RSI can indicate when an asset might be nearing extreme price levels, potentially due for a correction. However, be cautious about chasing these signals blindly.
Beyond the RSI:
Remember, the RSI is just one piece of the puzzle. Always consider other factors like market sentiment, news events, and overall price trends when making trading decisions.
Here are some additional tips:
Don't rely solely on technical indicators. Develop a comprehensive trading strategy that considers both technical and fundamental analysis.
Backtest your strategies. Test your trading ideas using historical data to see how they would have performed in different market conditions.
Start small and manage your risk. Don't invest more than you can afford to lose, especially when using potentially deceptive indicators.
By understanding the limitations of the RSI and using it strategically, you can improve your technical analysis skills and make more informed trading decisions.

Double EMA Strategy...For Beginners Hey Rich Friends,
Happy Monday! It's a new week which means many new opportunities to get into the market...but it doesn't mean that you have to take all of them.
Make sure you focus on finding the best setups by sticking to your plan and following your confirmation checklist. The best out of 25 will give you a good idea of your win/loss ratio.
If you are still struggling to find a SIMPLE strategy that works for you, try using this Double EMA strategy that I apply to my trades. Let me know what you think and if it works for you!
Today we will cover:
1. How to use EMAs on Tradingview
2. Double EMA Strategy
3. Feel confident taking a buy or sell in Forex trades
4. Trade with the trend
Peace and Profits,
Cha

Where to Put Your TP and SL | Learn in 10 MinutesHey Rich Friends,
This quick video will explain how I easily find my TP and SL for my Forex Trades. I've noticed how many new traders struggle with this, so hopefully this video will help. Here is what I do:
1 . Identify the overall trend of the market.
It is important to understand that a Selling market will look like a roller coaster going up, have more red candles and it will continue to create Lower Highs and Lower Lows. A Buying market will look like a roller coaster going down, have more green candles, and continue to create Higher Highs and Higher Lows. This is very important.
2 . Collect my confirmations for the potential trade. Here are some questions I ask myself:
- What color is the current candle?
- Are the candles above or below my EMAs?
- Have the EMAs crossed?
- Is my Momentum indicator facing up or down? Is it positive or negative?
- Is my Stochastic facing up or down? Is the Indicator's financial value above 50?
These are the answers you should get:
- Bullish/Buying: Green, Above, Up, Over, Higher, and Positive
- Bearish/Selling: Red, Below, Down, Under, Lower and Negative
3. Enter the market at Market Execution or set a Pending Order.
4. Choose my TP and SL using the Long position tool for buying and the Short position tool for selling.
Buys: Place TP above previous high and SL below the previous low
Sells: Place TP below previous low and SL above the previous high
- Peace and Profits, Cha

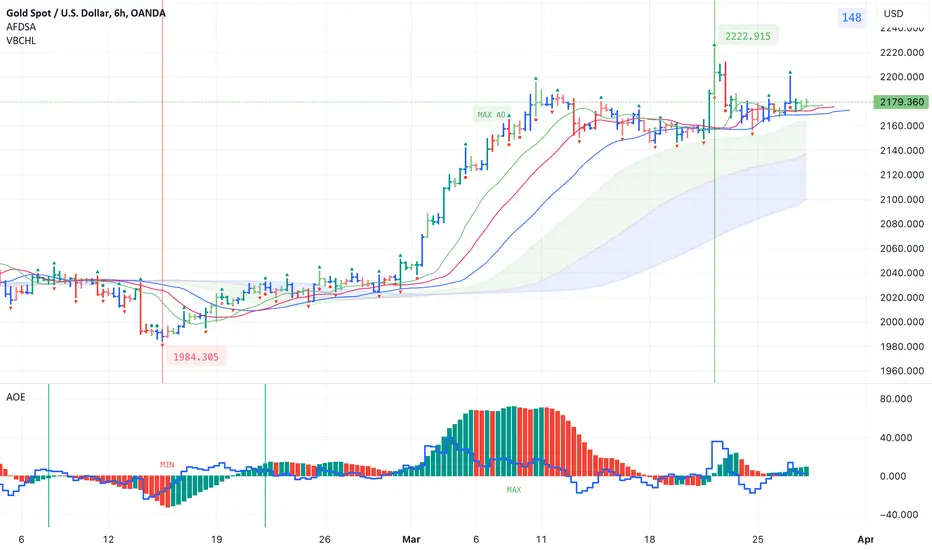
Indicators for trading using Bill Williams' Profitunity strategyI published 3 indicators for trading using Bill Williams' Profitunity strategy. For each indicator, I have added a visual and detailed description in English and Russian. In this post I will briefly describe these indicators and how I use them together.
AFDSA indicator (Alligator + Fractals + Divergent & Squat Bars + Signal Alerts)
Includes Williams Alligator, Williams Fractals, Divergent Bars, Market Facilitation Index, Highest and Lowest Bars, maximum or minimum peak of the Awesome Oscillator, and signal alerts based on Bill Williams' Profitunity strategy:
Bullish and Bearish Divergent Bar Signal + Squat Bar + Green Bar + Fake Bar + Awesome Oscillator Color Change + AO Divergence.
Crossing the green line (Lips) of an open Alligator.
Formation of a fractal.
Signal about the breakdown of the last upper or lower fractal.
Signal about the appearance of a new maximum or minimum peak of AO in the interval of 140 bars from the last bar.
I also added an Alligator display for the higher timeframe, for example, if the chart timeframe is 1 hour, then the higher timeframe will automatically be 4 hours, if the chart timeframe is 4 hours, then the higher timeframe will be 1 day, etc.
AOE Oscillator (Awesome Oscillator + Bars count lines + EMA Line)
Includes the Awesome Oscillator with two vertical lines at a distance of 100 and 140 bars from the last bar to determine the third Elliott wave by the maximum peak of AO in the interval from 100 to 140 bars according to Bill Williams' Profitunity strategy. Additionally, a faster EMA line is displayed.
I also added display of the AO line for the lower timeframe instead of the EMA line if the Moving Average Line values (method, length and source) are equal to the Awesome Oscillator values in the indicator settings. For example, if the chart timeframe is 1 day, then the lower timeframe will automatically be 4 hours, if the chart timeframe is 4 hours, then the lower timeframe will be 1 hour, etc.
VBCHL indicator (Visible bars count on chart + highest/lowest bars, max/min AO)
The indicator displays the number of visible bars on the screen, including the prices of the highest and lowest bars, the maximum or minimum value of the Awesome Oscillator. The values change dynamically when scrolling or changing the scale of the chart, but with a delay of several seconds, so this feature is included in a separate indicator so as not to slow down the work of other indicators.
Indicator settings
In the AFDSA indicator I use the following settings:
By default, the Squat Bar is colored blue, and all other bars are colored to match the Awesome Oscillator color, except for the Fake bars, which are colored with a lighter AO color. But I also enable the display of "Green" Divergent bars in the "Green Bars > Show" field.
I enable the display of Alligator for higher timeframes in the "Alligator for higher timeframe > Enable" field.
In the indicator style settings, I disable the display of the highest and lowest bars, maximum and minimum AO peak labels, because these labels are also displayed by the VBCHL indicator depending on the number of visible bars in the chart window.
Only after opening a position, I enable all additional alerts in the “Enable all additional alerts” field (after changing this field, you need to re-create the alert for the current chart): crossing the green line of an open Alligator, formation of a fractal, appearance of a new maximum or minimum AO peak.
In the settings of the AOE oscillator, I enable the display of the AO line for the lower timeframe instead of the EMA line, setting the same values in the fields for the Moving Average Line (method, length and source) and Awesome Oscillator.
In the VBCHL indicator settings, I only enable the simple display text style for labels in the "Simple display text style for labels" field.
As a result, when analyzing the current chart, I immediately see all the signals on the chart, the location of the bars relative to the Alligator on the higher timeframe and changes in the Awesome Oscillator on the lower timeframe. And thanks to the VBCHL indicator, I quickly select the desired timeframe for analyzing the 5-wave Elliott impulse, focusing on the interval of 140 bars, and immediately see whether there is divergence between the maximum AO peak and the following lower AO peak in this interval.
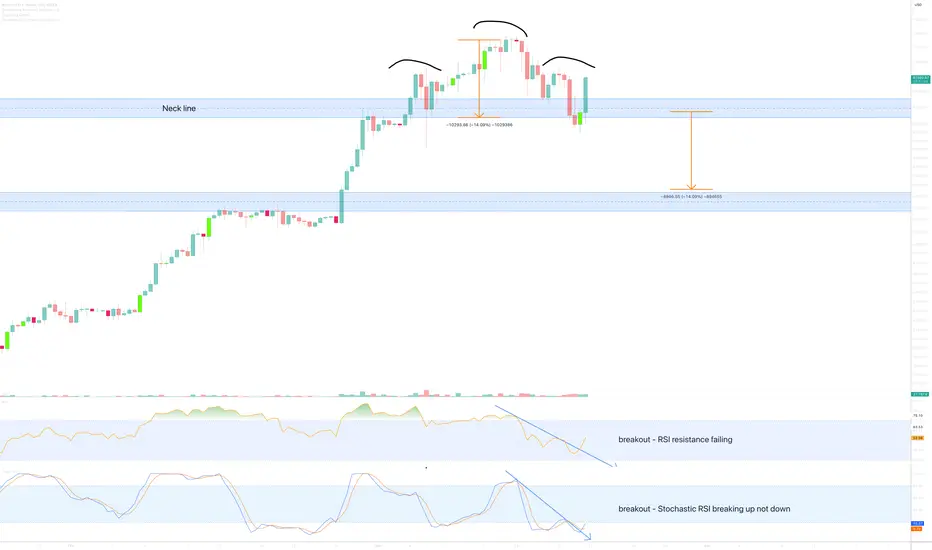
How to tell if a Head & Shoulders pattern is voidThere’s been a number of messages today informing me of the lower time frame head and shoulders pattern.
Traders are sometimes caught out with falsely identified head and shoulders patterns, and then the market runs in the opposite direction of that expected as the error is realised causing a energetic surge in price action as traders closes short positions.
How do you identify valid from void?
The last lower time frame (12hr examples used here) head and shoulders pattern printed in March 2022. There was a couple of leading indications this neckline would confirm as resistance at the time of the breakout:
1) RSI confirmed failed support (black circle)
2) Stochastic RSI is crossing down 80. Very bearish.
12hr head and shoulder March 2022
Now lets look above on the current 12hr chart (main chart)
1) RSI resistance is failing, a breakout is evident.
2) Stochastic RSI is crossing up not down! Very bullish.
There you have it. While many traders identify the price action of a head and shoulders pattern in isolation it is an expensive error to ignore what the oscillators are doing at the time of the print.
In almost all of the ideas published by Without Worries, if you look udder the main chart idea you’ll notice “Oscillators” as one of the selected indicators for use in the study. Now you know why!
Ww
HOW-TO: Accumulation Strategy 2024What if instead of buying a stock, crypto, currency only once and holding until we are in profit, we split our strategy capital and buy several times, until the total is in profit ? Yes, that is DCA you’d say. Ok, but what if instead of buying at predetermined intervals, we bought at oversold RSI, or on a double bottom, for example ? That’s the idea behind the Accumulation Strategy, which I’m going to explain in detail in this article.
█ Simple Example
The strategy comes with several features, and the easiest way to explain them is through examples.
The Max Active Deals input allows to limit how many times the strategy can trigger a buy in a trade, just like the pyramiding setting. It can go up to 100.
In this example, the strategy has 10 max active deals. and is using the RSI feature to buy when RSI crosses below a configurable threshold, here 25.
Note: to get stronger signals, the RSI time frame has been set to 1 hour, since the chart is in a 30 min time frame.
In this trade, the strategy bought 8 times (yellow arrows) before selling at take profit, but it could have bought twice more.
█ Take Profit Feature
Customisable in the input tab, this feature allows you to set one or multiple take profit(s). You can set the value in either %, pips, or Auto mode.
To create multiple targets, increase the Number of take profit and set the Step between each TP.
In our previous example, instead of just one, I set 3 TPs with 1% value and a step of 1. The strategy will sell progressively at a quantity split even at each take profit, until the last TP is hit.
Note: Using multiple take profit is often used to improve risk management in trading.
█ Built-in Entry Options
The strategy comes with several built-in indicators, such as the RSI that we’ve seen, but here’s the list:
MTF RSI cross, RSI divergences
MTF Stochastic cross
MTF Bollinger Bands cross
Top & Bottoms
Double Top & bottoms
Higher/Lower Lows/Highs
Custom External Entries
If you want to use ANY external indicator from the TradingView library and use it as an entry signal, you can!
For example, let’s use the Squeeze Momentum Indicator by Lazybear. After adding it to the chart, we select the first plot which is the histogram. Then we select the condition “crossover” and “0”. It will create a buy when the histogram turns green.
█ Trend Filters
In trading, we try to avoid going against the global trend.
The strategy comes with several built-in trendlines, MTF, or you can use ANY external trendline from the TV library.
The strategy offers other built-in filters such as volume, overbought in range/trending market, or flat market entry filters.
█ Stop Loss
The stop loss can be turned on/off. You can set the value in either %, pips, ATR or Auto mode.
Note: When to use a Stop Loss? Using a stop kind of defeats the purpose of the strategy, but it can be useful if you plan to trade highly volatile and risky coins (remember LUNA ?) That is why the option is there.
█ How to use the strategy
The indicator access is unlocked by subscribing on my website. See the links below this article.
█ Setting up a strategy
You can set up a strategy on your own chart in just one click using the preconfigured charts I will share below, or you can simply add the indicator yourself and play with the settings.
Backtesting
Backtesting is automatically done in the Strategy Tester Tab.
Creating Alerts
Once you have your strategy setup on the chart:
1 - Set the alert message in the indicator inputs (scroll to the bottom, you will find an “alert’ section)
2 - Save your chart and do not touch it anymore unless you want to update your alert (optional but recommended)
3 - Create an alert on Cyatophilum Accumulation Strategy, using the option “alert() function calls only” (this is really important!)
Only one alert is needed to handle all the strategy events! (entry, take profit, stop loss, etc.) Even a free TradingView user can create a strategy!
Automation
The subscription that I offer also comes with Automation bots using the Binance spot trading API .
Important: if you wish to automate your strategies, make sure your TradingView account has access to alert webhook notifications .
That’s it for this tutorial!
Pretty easy right? No, I know it can get complicated at first. 😣
That is why I make preconfigured charts. Once you have access, click on the chart link, then click “copy”, then “save” your “layout” to get your own chart that you can use and edit. Enjoy!
█ Preconfigured charts
BTC/USDT
Chart: www.tradingview.com
ETH/USDT
Chart: www.tradingview.com
BNB/USDT
Chart: www.tradingview.com
MATIC/USDT
Chart: www.tradingview.com
EGLD/USDT
Chart: www.tradingview.com
