Where will the trend end? TD Trend Factor and TD PropulsionBITFINEX:BTCUSD
Dear friends!
I continue describing Thomas DeMark’s technical tools. I have already explained such tools as:
1. TD Retracements
2. TD Lines of demand and supply
3. TD D-Wave
4. TD Sequential and TD Combo
Today, I am going to deal with TD Trend Factor and TD Propulsion. These are two independent technical tools that in combination help you quite accurately identify the trend reversal moment and potential targets. But first, I’d like to unveil a small secret of DeMark. Following long experiments with Fibonacci numbers, DeMark found out the two most important of them. These are 0.382 and 0.618. By subtracting one from the other and dividing the result by 4, he found the value of 0.059.
Later, for many years using this number in practice to calculate levels of support and resistance, he came to the conclusion that the most frequent ratio that occurs in trading is 0.0556. Therefore, when calculating the resistance levels, an upward percentage of 0.0556 * 100% = 5.56% is used. When calculating the support levels, a downward percentage of 100% - 5.56% = 94.44% is used to analyze micro-movements or prices whose count goes more than two digits after the decimal point, DeMark suggests using a coefficient with a shifted decimal point, i.e. 0.556% and 99.444%, respectively.
TD Trend Factor basically aims at identifying the trend reversal level and confirming its relevance. To do this, we first need to find out the reference point.
For a bearish trend, it is determined by the following conditions:
1. Identify the bar that marks the peak of the bullish trend
2. If the high bar above the previous bar, the starting point is at this bar’s high
3. If the high bar closes below the previous bar, the reference level is the closing price of the bar with the peak.
To explain it better, I’ll give an example:
The above chart presents Bitcoin all-time high. Its peak is at 19891 USD. You see that this bar’s close is lower than the previous bar’s close, so, the reference level is the high bar’s close.
This level is at 18960 USD. So, based on this level, we shall build the levels of TD Trend Factor for a bearish trend. The simplest way is to calculate them in Excel.
Therefore, I’ve got the following calculations:
18960*94.44% = 17905
17905*94.44% = 16910
16910*94.44% = 15970
You can be calculating in this way until the result is close to 0. With rounding to integers, there are the following levels
18 960
17 906
16 910
15 970
15 082
14 244
13 452
12 704
11 997
11 330
10 700
10 105
9 544
9 013
8 512
8 039
7 592
7 170
6 771
6 394
6 039
5 703
5 386
5 087
4 804
4 537
4 284
4 046
3 821
3 609
3 408
3 219
3 040
2 871
2 711
Eventually, as the history has proven, the low of the bearish trend came at 3215.2 USD, that is just a few dollars below one of the levels indicated above.
You might say that this is a coincidence but try to carry out this experiment on other trends and you will see that it works.
If we analyze the earlier history BTCUSD price chart, we’ll see that the TD Trend Factor levels of the downtrend had excellently worked out before that (see the chart above). In addition, it is clear that the lower the price is moving, the thicker becomes the grid. This construction fully matches to the market behavior; in a bearish correction, the deeper the price falls, the stronger the resistance becomes and the shorter is the range of price swings.
For a bullish trend, the same rules are applied, only in vice versa. .
To find a reference levels, we need identify the bar that marks the low of the bearish trend and:
1. If the low bar closes below the previous close, the reference level is at the low.
2. If the low bar closes higher than the previous close, the reference level is the low bar’s close.
I’ll explain on the example.
The above chart represents the low at 3215.2 USD that we have already marked before.
If we zoom it in, we’ll see that the close is a little higher than the previous bar’s close, so the reference level will be set based on condition 2, at 3283.4 USD.
The levels will be calculated in the same way, only the coefficient will be 105.56% instead of 94.44%.
Finally, there are following levels:
3 283
3 466
3 659
3 862
4 077
4 303
4 543
4 795
5 062
5 343
5 641
5 954
6 285
6 635
7 004
7 393
7 804
8 238
8 696
9 179
9 690
10 228
10 797
11 397
12 031
12 700
13 406
14 152
14 938
15 769
16 646
17 571
It makes no sense to mark all the levels in the chart, but to estimate the relevance of the calculated levels, I’ll mark the closest ones to the recent price movements.
As you see from the above chart, the calculated zones serve not only as strong resistance levels, but as a support as well.
How to use TD Trend Factor
TD Trend Factor is a supplementary tool, used to confirm signals, it doesn’t provide any buy or sell signals by itself. So, you need to use it together with other DeMark's tools:
TD Retracements
TD Lines of demand and supply
TD D-Wave
TD Sequential and TD Combo
And other DeMark's indicators that I haven’t yet described.
One of these tools is TD Propulsion.
The indicator is designed to send signals of the trend extension or exhaustion. This tool consists of two parts. The first element is TD Propulsion Up and TD Propulsion Down,these indicate entry points. The second part is TD Propulsion Up Target and TD Propulsion. As you can guess by the name, these are trend targets. So, let us see how this indicator is built and how it can be employed in practice.
Thomas DeMark says that to confirm a bullish trend, we need to do the following:
1. Identify the points of X and Y – the low and the high of last growth wave in they bullish trend.
2. Identify the Z point – the lowest level of the bearish correction, following the growth wave XY.
If this level is lower than 23.2% of the correction size, than the points of X and Y are correct; if this is not so, one needs to rearrange the borders of the wave.
Next, we shall identify the TD Propulsion Up level
To do it, we use a simple formula:
A = Z+(Y-X)*0.236, , so, in the given example, this is:
A = 12730.6 + (17171 - 5400.2)* 0.236 = 15508.5 USD.
This level marks the first resistance level in the trend continuation. As a rule, this level is not broken out when the trend reverses. Next, we shall find out the level of TD Propulsion Up Target.
To do it, we use a simple formula:
A = Z+(Y-X)*0.472, so, in the given example, this is:
A = 12730.6 + (17171 - 5400.2)* 0.472 = 18286.4 USD.
This level is potential buy zone. As you see from the chart above, this level is very close to the real one and the trend reversed only after just a little more than a thousand of dollars,
I will describe this situation in more detail a little later. Now, I’d like to explain how to analyze a bearish trend with TD Propulsion.
Here, you build everything in a similar way, just like when using other DeMark's tools. For the further analysis, I found out clear borders of the downward wave. They are marked with the points of X and Y in the above figure.
Now, let us look at the start of the bullish correction and the level where it finishes. This is point Z in the chart. You see that this level exceeds the level of 23.2% of the correction, and so, the wave itself and point Z are suitable to calculate the TD Propulsion Down.
To do this, I use the following formula:
A = Z-(X-Y)*0.236, so, in the given example, this is:
A = 4384- (6485.8-3215.2)* 0.236 = 3612.14 USD. This level is TD Propulsion Down.
Next, I identify D Propulsion Down Target.
The formula is:
A = Z-(X-Y)*0.472, so, the there is the following result:
A = 4384- (6485.8-3215.2)*0.472 = 2840.27 USD.
As you see from the above chart, the A level has worked out. As I’ve already written above, this level may signal either the trend continuation or its reversal. And the way how the price goes through this level, very difficult and slowly, is the trend reversal sign. In addition, I should note that both in the first case, when we identified the bullish trend reversal, and in this situation, level A works out. Therefore, it can be applied as a low-risk trading strategy to set the intermediate targets when analyzing the Bitcoin future price movements. To see the full capacity of these tools, we need to study their application together with other DeMark's tools on a real example.
As an example, I will analyze the moment when the trend was reversing at 3215.2 USD. It is clear from the above chart that TD Propulsion Down A level exactly matches to the TD Trend Factor level at 3612.1 USD. When, following the Z point, the BTC price was moving down, it is clear that this level provides a strong support. In addition, the TD Trend Factor level at 3466 USD is not broken out. The price rebounds from it like a rubber ball.
A buy signal here is the bullish Setup (remember TD Sequential and TD Combo). This signal is marked with a red arrow in the above chart. It is confirmed by a typical rebound from the TD Trend Factor level at 3466 USD and the bar closing above level A. After this combination, one could have already entered a long with a short stop beyond level 3466 USD.
You already know what happened next. The risk/profit ratio for such a trade is perfect. Now, for a fair experiment, let us try to find out an entry point in the current market. First, let us build the TD Trend Factor support and resistance levels.
There is already a clear high with the peak at 13764 USD. We see that this high bar closes above the previous bar’s close. So, the reference level will be at the highest high of 13764 USD. Next, we multiply each level and the product of each multiplication by *94.44%.
There are the following values:
12 999
12 276
11 593
10 949
10 340
9 765
9 222
8 709
8 225
7 768
7 336
6 928
6 543
6 179
In the above chart, I marked these levels and I have noted that the last bar closes above the previous bar’s close; and its low at 9728.2 is close to the TD Trend Factor level at 9765, which itself is a bullish signal. For the Bitcoin price prediction, based on this signal, I may already assume a reversal and point Z to calculate the levels of TD Propulsion.
It is clear from the above chart that the Z point is a little lower than the level of 23.2% of the correction from the wave XY with the coordinates on the price scale of 3405.3 and 13764. Therefore, the Z point is relevant for this wave. So, we can calculate TD Propulsion Up (A) and TD Propulsion Up Target (B), according to the coordinates and the formula studied above:
A = 9728.2 + (13764 – 3405.3) * 0.236 = 12172.85 USD.
A = 9728.2 + (13764 – 3405.3) * 0.472 = 14617.51 USD.
Next, I attach the TD Sequential indicator and select the timeframe where setups are worked out most accurately on the historical data. For the BTCUSD pair, the indicator performs the best in the five-day timeframe.
As a result, you see that the BTCUSD is now in a bullish setup, where the fifth bar is formingg, out of nine in total. It means that before a the bitcoin trend could reverse and a bearish trend should starts, there at least four bar more to be formed in the bullish trend, not counting the currently forming bar, that is, there are more then four weeks ahead. In addition, there is a strong support level at the Z level at 9728 USD, below which, one might set stop losses, and the first target for ta take profit is at 12172.85 USD, the second target profit is at about 14617 USD.
Besides, I can define the possible BTCUSD scenarios and suggest an adequate response to a particular market situation.
The chart above outlines three possible scenarios for the BTC future trend.
1. The first scenario, a pessimistic one suggests that the BTC ticker shouldn’t break through the A level and rebounds downside. This is a clear trend reversal sign. We should take the profits and enter short trades with a stop above the A level.
2. The second scenario is neutral. According to it, the ticker should break through the A level and stop close to the B level. In this case, we will take the profit at the B level and expect either the reversal below the A level to enter shorts, or reaching the B level to enter new longs.
3. The third scenario is the most optimistic and the least possible, in my opinion. The ticker breaks through the levels of A and B with large volumes and without strong delays. In this case, we should just follow the trend, moving the stops, covering the TD Trend Factor levels, calculated before, based in the low of the bearish trend.
Here, I am about to finish describing Thomas DeMark's tools, TD Trend Factor and TD Propulsion, but I am not finishing writing about his studies. In my next training article, I will deal with more unique tools by the famous trader and explain how to apply DeMark's indicators to cryptocurrency trading.
Subscribe not to miss the continuation!
I wish you good luck and good profits!
Oscillators

Super set of oscillators by Thomas DeMark!Dear friends!
I continue describing oscillators developed by Thomas DeMark.
In my previous articles, I have already explained such tools as
TD REI and TD POQ (look here ).
In this post I’ll continue describing technical tools developed by Thomas DeMark.
TD DeMarker I
I’d like to start with the TD DeMarker I indicator. It is similar to TD REI and aims to distinguish between trend and non-trend movements in the market, and then, having determined the trend, it searches for reversal points depending on how the indicator reacts to oversold and overbought levels.
Its calculation technique is very simple. TD DeMarker I compares the current and the previous trading day’s highs according to the following algorithm:
1. Calculate the TD DeMarker I numerator
• If the current bar’s high is higher or equal to the previous bar’s high, the difference is calculated and added to the numerator.
• If the current bar’s high is lower than the previous day’s high, then zero value is assigned to that bar. Next values of the difference between the highs for each bar are added to the numerator over a series of 13 consecutive bars.
• If the current bar’s low is equal or less than the previous price bar’s low, then the difference between the previous day’s low and the current low are the numerator.
• If the low of the current bar’s is greater, a zero value is assigned to the nominator at this bar. The next values of the difference between the lows for each bar are added to the numerator over 13 consecutive bars.
2. Calculate the denominator of TD DeMarker I equation
• You add the value in the denominator to the sum of the differences between the lows in the same period.
3. Calculate TD DeMarker I = divide the numerator by the denominator.
• As a result, we get a value that will move in the range from zero to 100 in the form of a fluctuating 13-period line. At the same time, the overbought zone will be above 60, and the oversold zone will be below 40.
Now, let’s find out how this indicator’s signals are interpreted
A buy signal should satisfy the following conditions:
1. DeMarker I must not be below 40 for more than 13 bars
2. The bar’s close at the signal level should be lower than the low of one or two bars ago
3. The bar’s close at the signal level must be lower than the previous bar’s open or close.
4. The open of the next bar following the assumed reversal bar must be less than or equal to the close of any of the two previous bars.
5. The asset must be trading higher than at least one of the two previous closes.
As an example, I’ll take the BTCUSD market situation that has recently occurred. It is clear from the above chart that the BTCUSD was in the overbought zone (above 60) from the start till the end of May. Afterwards, the price rolled down below 40 and the indicator entered the oversold zone.
Immediately after that, we look for a point where the bar features the low before price exits the oversold zone.
Finally, when the price went beyond the oversold zone on June 13, we can easily identify the low in the period when the ticker had been below 40, according to TD DeMarker I.
Now, we can analyze the continuation pattern based on the above conditions.
1. The DeMarker I indicator was below the level of 40 for not more than 13 bars - in our case it was only 5 days;
2. The bar’s close under the red arrow is lower than the previous bar’s low (blue dots are above than the red dotted line).
3. The close of the bar below the arrow is lower than the previous bar’s open and close (blue dots are far lower than the previous bar).
4. The next bar’s open following the reversal bar is equal to the previous bar’s close (there are no gaps).
5. The asset is trading higher than the previous bars’ close levels. Furthermore, when the indicator exited the overbought zone, the price had been already trading above all the previous bars’ close levels.
Therefore, one could have safely entered a buy trade at the current level when the new bar of June 14 opened (I marked it with a red cross in the chart).
As we already know, this signal reached the target and provided the opportunity to gain on the BTCUSD movement up to the high at 14 000 USD.
I should note that when a buy signal is not confirmed, that is, the five conditions above are not met, there is still a signal, but it is a sell signal. Although such a sell signal cannot be as strong, it can be a confirmation for bearish signals of other indicators.
There is a good example in the chart above. It displays bitcoin’s all-time high at 20 000 USD.
After the DeMarker I had been in the overbought zone for quite a long time, it moved into the oversold zone, and so, we start counting and see how long the price will be in this zone.
Finally, there is the following situation:
1. DeMarker I was not below the level of 40 for more than 13 bars, in this case it was 12. So, this condition is satisfied.
2. The close of the bar under the red arrow is lower than the previous bar’s low (blue dotetd line is below the red dotted line). This condition is also satisfied
3. The close of the bar under the arrow is lower than the previous bar’s open and close. This condition is also met.
4. The open of the bar following the reversal bar is equal the close of the previous bar (there are no gaps). This condition also confirms the bullish scenario.
5. The asset is trading above the previous close levels. This condition is not met.
It is clear from the above chart the bar following the oversold zone (marked with a red arrow) went down lower than the close levels of the previous two bars, and, moreover, it was trading below the close level of the two bars preceding the reversal bar.
Therefore, the last condition is not satisfied, and so, we have the reasons to assume that there is a real reversal of the bullish trend.
Now, let us study the sell signals.
The following conditions must be met:
1. A sell signal should meet the following conditions:
2. The indicator must be above level 60 for at least six bars.
3. The signal bar’s close must be above the previous bar’s open and close.
4. The open of the bar following the signal must be equal or higher than the close of any of the two previous bars.
5. The asset must be trading below one of the previous close levels.
As soon as all these conditions are satisfied, it can be interpreted as a sell signal.
TD DeMarker II
The above chart presents an example of the Bitcoin bullish trend reversal in December 2017, after which there started a long-tern bearish trend. Let us analyze this situation as a bearish signal. When the bar marked with a red cross was forming, the DeMarker I indicator leaves the overbought zone and goes below level 60. Therefore, it is the case for looking for a sell signal within the zone, where the price was above level 60 (the zone is highlighted with green in the chart).
The red arrow highlights the bar that closed higher than the highs of the previous two bars, and so, higher than the previous bar’s open and close (in the chart, it is marked by the purple dotted line on December 17 that is above the green line). The next bar, following the one with the red arrow, also meet the condition and opens above the close of the second-last bar. Finally, there is the trend reversal signal and the opportunity to take the profit on December 20 (it is the bar marked with the red cross in the chart). However, this indicator, like other technical tools, may send false signals. To filter the entry signal, it is recommended to apply TD DeMarker II as a supplementary tool.
TD DeMarker II
Unlike the TD REI and TD DeMarker I, which compare the price highs and lows with those of one bar ago, TD DeMarker II analyzes a number of price ratios to measure the pressure of buyers and sellers.
Let us study the calculation formula of the TD DeMarker II.
Calculate the numerator:
1. Calculate the difference between the current bar’s high and the previous bar’s close.
2. Add the result to the difference between the current bar’s close and its low.
3. Distract the previous value from the current bar’s high
4. Sum up all the values. If there is negative result, assign a zero value to it.
Calculate the denominator:
1. Add the difference between the current bar’s low and the previous bar’s close to the numerator.
2. Add the result to the difference between the current bar’s high and its close (this value defines the selling pressure).
The buy and sell signals of this indicator work under the same conditions as for the TD DeMarker I, so, I won’t enumerate them again. I have already many times mentioned that, if multiple buy or sell signals are at the same place, the signal becomes much stronger. As it is clear from the above chart, a buy signal sent by the TD DeMarker II (green cross) matches to the one sent by the TD DeMarker I (red cross), which in combination confirms the sell signal and enhances it.
TD Pressure
DeMark suggests that the price action is directly affected by the supply/demand ratio. As the price change is often preceded by a change in trading volume, DeMark suggests measuring the speed of changing in the trading volume along with the speed of price changes. In addition, according to DeMark, these parameters are more important for the current bar, rather than for the complete bars. In general, these values determine the buying pressure on the market, which is calculated by subtracting the current bar’s open from the its close and dividing the result by the price range of this bar.
The result is multiplied by the trading volume of the current period and is added as a progressive total to the indicator value.
Finally, we have an indicator that shows buying pressure. For example, if the bar’s open is equal to its low, and the bar’s close is equal to its high, then the trading volume will be on side of buyers, and the indicator will display a strong rise of buying pressure. And vice versa, if the bar’s open and close coincide, even a greater trading volume won’t affect the indicator, as the market will be balanced, and the bulls’ power will be roughly equal to that of bears.
The indicator’s band moves from 0 to 100%, and the overbought and oversold zones, like for the indicators, described above, are the zones above 60 and below 40 respectively. The buy and sell signals sent by this indicator are interpreted in the same way as those sent by TD DeMarker I and II. Besides, this indicator is also a confirming one, and when it coincides with other signals, it confirms the indicated direction.
You see in the above chart that the signal sent by the TD pressure (yellow cross) matches to the signals sent by the DeMarker I and the DeMarker II (red and green crosses respectively), which means that the sell signal is true.
TD Rate of change (TD ROC)
TD ROC is an integral component of TD Alignment but can also be used in isolation as an overbought/oversold indicator.
It is thought to be quite simple and is determined by dividing the close of the current price bar by the close of twelve price bars earlier.
Although it is pretty simple, this indicator is quite efficient. According to Thomas DeMark, the bears’ zone is below 97.5. Bulls zone is above 102.5. Therefore, when the indicator is in a narrow band between 97.5 and 102.5 the market is in balance.
So, this indicator helps you identify the market sentiment at any moment.
But this is not its primary advantage. You can employ this indicator in technical analysis and draw the common patterns and trend lines. The chart above shows how a triangle worked out. A strong momentum, marked with a red arrow, draws the indicator beyond the triangle, which means that the market lost balance and started moving in the bullish trend.
Next, after the triangle was broken out and the bullish trend started, we build trend lines according to the common rules; in the bullish trend, the trend is outlined along the support line (red line), in the bearish trend -along the resistance lines (green line).
It is clear from the chart above that the breakout of these lines and entering the bear zone send a sell signal (red cross) in early July. Afterwards, we build the trend line along the resistance levels sand expect until the price breaks it through and enter bullish zone. Finally, in the mid-July, there is such a buy signal, marked with green cross in the chart.
Next, there is a strong growth in the bullish trend that is marked with the red trend line. The breakout of this line sends a signal to take profit, and entering bearish zone again signals the trend weakness.
As you see from the chart above, the indicator broke through the green trendline in late July but it hasn’t entered the bullish zone, and so, there has been no buy signal so far.
Another signal that really matters when using this indicator is the signal of convergence and divergence.
These signals are rarely sent by this indicator, but they are usually quite accurate, especially in long-term timeframes.
There is a clear divergence in the above chart. When the price is growing, the indicator is declining, which signals the trend exhaustion. In early July, the price couldn’t break through the previous high, thus confirming the direction of the indicator (marked with a circle).
Finally, as I have already said, the indicator went down below the trend line, which sends a strong sell signal; however, as you know, the bearish correction didn’t work out, so, for an accurate forecast, it important to employ all the DeMark's tolls together.
TD Alignment
Just for this purpose, to combine all the tools together, the TD Alignment indicator was developed.
TD Alignment is a composite indicator that combines the following five TD oscillators to measure buying and selling pressure:
1. TD DeMarker I
2. TD DeMarker II
3. TD Pressure
4. TD Rate of Change
5. TD Range expansion Index (this indicator is described here)
Each of these indicators has its own distinct method of measuring overbought/oversold conditions. TD Alignment is based on the values of all the above indicators according to the principle, where the final result is determined of the number of indicators in an oversold condition, overbought and equilibrium.
In addition, to calculate the TD Alignment, there were defined the following overbought/oversold zones:
Overbought/Oversold
1. TD DeMarker I - 60/40
2. TD DeMarker II - 60/40
3. TD Pressure - 82/12
4. TD Rate of Change - 101/99
5. TD Range expansion Index - 40/-40
Therefore, when the TD DeMarker enters the oversold zone, 1 is added to the total result. If the indicator enters the equilibrium zone, between 60 -40, a zero value is assigned, if it is below 40, 1 is subtracted from the total value.
Based on the same principle, all the indicators are calculated, and finally, there is the TD Alignment value that is moving between -5 and +5. -5 is reached when all the indicators are in the oversold zone, and +5 is associated with the case when all the indicators are in the overbought zone.
Unfortunately, I failed to find the TD Alignment in free access, so I had to write everything on my own. I must admit there may be errors in calculations, nonetheless, it performs quite well during testing. As you see, the main benefit of this indicator is showing the cases when the market reaches the extremes of the overbought/oversold zones.
In the above chart, I highlighted these levels from +4 to +5 and from -4 to -5.
When the indicator reaches this zone, it is obvious that the price will start correction soon and so you should take a corresponding decision on either taking profit or entering a trade. In addition, the indicator shows the market sentiment currently dominating; if it is above zero, bullish sentiment is dominating, if it is below zero, the market is bearish.
Buy or sell signal here must meet the same 5 conditions, described for TD DeMarker at the beginning of the article, the only difference is that you need to count the number if bars above or below zero.
Based on my own experience, I would add one more condition, the sixth one, to be met for entering a buy or a sell trade. A buy/sell signal is confirmed when the TD Alignment indicator breaks through zero level (red dots) only provided that the indicator hit the overbought/oversold zone before.
In the above chart, I tried to illustrate that, after the indicator hits green or red zone, i.e. overbought or oversold zone, the sixth condition is satisfied. So, when the indicator breaks through or rebounds from the zero level, there is a buy or a sell signal (according to the market sentiment, I marked the entry signals with green and red arrows). A red thumb down marks the levels where the market doesn’t reach the zones indicated above, and so, the condition is not met and the buy or sell signal is false; I marked false signal with the red crosses in the chart.
However, not everything is that perfect, because this indicator is rather sensitive and so, it sends quite many false signals. That is why, I do not recommend employing this indicator alone, rather, it should be used together with other DeMark's tools so that it will be more efficient.
I will describe other useful DeMark's indicators and explain how to apply them to BTCUSD trading in my next articles.
Subscribe not to miss the continuation!
I wish you good luck and good profits!

How to filter good and bad entry signals? TD REI and TD POQBITFINEX:BTCUSD
Dear friends!
I continue describing Thomas DeMark’s technical tools.
Today, I am going to deal with more DeMark’s technical tools, TD REI and TD POQ that are included in the group of indicators TD Oscillators.
Major problem of all oscillators
The main problem that DeMark sees in the use of oscillators is that average traders exaggerate the value of the divergence of the indicator with the price position.
As a rule, people, who do not understand how an indicator works and based on what principle it alternates, do not care what the composition and the recommended interpretation of this indicator might be. They try to interpret its vague signals that aren’t basically signals and must be confirmed by other indicators. A good example is a famous indicator, RSI.
In May, this indicator showed a bearish divergence in the daily timeframe (see the chart above) and, according to all rules, the trend should have reversed, and the price should have started declining. According to DeMark, the main problem in interpreting such signals is that users do not take into account the time that the indicator is in the overbought and oversold stages. DeMark notes that if the indicator is in the overbought or oversold zone for more than 6 bars, this indicates the strength of the trend, which means that this signal is false.
It is clear from the above chart that the two overbought zones lasted for more than 6 bars, which indicates the trend’s strength, and so, the oscillator’s correction in these cases will be a false sell entry signal.
The number of bars may be different for other oscillators. Everything depends on the indicator’s parameters and the peculiarities of its composition. Therefore, in each particular case for each timeframe, one should perform an own analysis of the number of bars in the overbought or oversold zones.
To facilitate the analysis of all these parameters, DeMark developed his own series of oscillators that will described below.
Introduction to TD REI indicator
First, I’d like to write about TD REI, or Range Expansion Index. This indicator is designed to filter out false signals when the price is trading in the range or in a strong trend, it should send a reversal signal only if the market sentiment really changes.
Before I present the charts with this indicator, I want to pay tribute to its developer @ e2E4mfck. The matter is that the TD indicators are not available in the Tradingview standard library, therefore, I had to look for those that were published in the public library and only thanks to such enthusiastic programmers can you get acquainted with these wonderful tools by DeMark.
So, you see the TD REI indicator in the chart above, at its bottom. The TD REI oscillator typically produces values of -100 to +100 with 45 or higher indicating overbought conditions and -45 or lower indicating oversold. Besides, the TD REI counts the number of bars, and, if the price is in the overbought or oversold area for more than 6 bars, the indicator shows this and indicates a strong trend.
On the other hand, this indicator is more responsive to the price changes, and, while the RSI is still in the overbought area, or in the neutral area, the TD REI has already a few times entered the oversold area, thus sending a buy signal (in the above chart, all buy signals on the indicator are marked by circles, and by green flags on the price chart.
It stands to reason that this indicator is much more complicated than it may seem, based on the above example. It also has many peculiarities, which I will describe later.
First, I’d like to describe its mathematical model, so that you can understand the indicator’s signals.
Mathematical model of TD REI indicator
The TD REI value is calculated by adding the respective differences between the current day’s high and the high two days earlier and the current day’s low and the low two days earlier.
To make it clearer, the calculation formula looks like this:
X = (H – H2) + (L – L2), where
H is the current high
H2 is the high two days earlier
L is the current low
L2 is the low two days earlier.
Besides, two conditions must be met:
Condition 1
• the current day’s high must be greater than or equal to the low five or six days ago,
or
• the high two days earlier must be greater than or equal to the close seven or eight days ago.
Condition 2
• the current day’s low must be less than or equal to the high five or six days ago
or
• the low two days earlier must be less than or equal to the close seven or eight days ago.
If neither of the conditions is met, a zero value is assigned to that day’s bar.
If both conditions are met, then there will be a different formula:
TD REI = (Y / (H5 - L5)) x 100
Where:
Y = (Sum X1 next… X5)
H5 is the high over a five-day period
L5 is the low over a five-day period
Differently put, TD REI a kind of shows the price movement, adjusted to a trading range over the five days.
TD REI filter for signals
Like any other indicator, TD REI is not a Grail and sends false signals too. To filter out these false signals, Thomas DeMark suggests using the TD POQ indicator, (Price Oscillator Qualifier).
To be fair, I must note that this indicator can be used together with any oscillator, based on the price action, (for example, MACD, RSI).
TD POQ conditions to validate the TD REI signals:
Buy signal:
1. TD REI has been in the oversold condition (below -40) for six or more bars;
2. The last complete bar should close below than the previous bar
3. The current bar’s open should be equal or lower than the highs of the previous two bars;
4. The market should be trading above the open price and break through the high iver the last two days.
Sell signal:
1. TD POQ has stayed in the overbought condition (above + 40) for six or more bars;
2. The last complete bar should close higher than the previous bar’s close
3. The current bar’s open should be equal or higher than the low for over the last two days
4. The market should be trading lower than the opening price and break through the low of the last two bars.
To explain how you can use the TD POQ to filter the entries, I’ll describe the examples of a buy and a sell signal.
Buy signal:
1. It is clear from the chart above that the first condition is satisfied, the price has been in the oversold area for more than 6 bars.
2. The last complete bar closed lower than the previous bar’s close (green dots below the red ones in the chart)
3. The current bar opens lower than the highs of the two previous bars (the current opening price is the same as previous bar’s close, it is market with green dots; and it is lower then the two yellow dotted lines)
4. When the price breaks through the highs of of the last two bars, there is a buy signal (it is marked with the red cross).
As you see from the chart, there is a reliable early signal to enter a trade.
I must note that the TD REI is a good supplementary tool for other Thomas DeMark's indicators. It is clear from the above chart that the signal perfectly matches to the start of a bullish set, indicated by TD Sequential (the developer is @andyhitchman) on the five-day timeframe (but it also matches on the shorter timeframes).
Sell signals
Now, let us analyze the sell signal on the example of the BTCUSD all-time high.
First, I’d like to note that the TD REI indicator, starting from 8000 USD recorded on November 20th, 2017 (in the BTCUSD price chart) was in the overbought condition for more than 30 bars and has never sent a false sell signal! In my opinion this fact alone is the evidence of the TD REI efficiency.
Now, let us analyze the sell signal produced on December 19th.
1. As I’ve already said that the indicator had been in the overbought zone for than 6 bars before the signal emerged. We can put a check.
2. The last candlestick closed as a doji, the closing price is almost equal to the previous bar’s close. This condition is NOT fully met, so we need an additional confirming signal.
3. In the above chart, you see that the current bar, of December 19th, opens lower than the high of the previous two days, so, we also put a check.
4. The market broke through the lows of the previous two bars and is trading lower (I marked the breakout with the red cross).
Therefore, as there is not a fully confirmed signal, it is important to employ this indicator with other Thomas DeMark’s tools.
For example, in the previous article (see here), I described a good tool, TD Propulsion.
In that article, we defined the TD Propulsion Up Target level for the bullish trend at level 18286.4 USD.
If we attach it to the present chart and add the calculations of the TD Sequential indicator, we shall see that this very bar closes lower than the TD Propulsion Up Target level, and at the same level, a bearish set up starts, based on the TD Countdown indicator.
Both these signals are confirming signals and, finally, suggest sell trades.
Analysis of the BTCUSD current market situation
Now, let us analyze the current BTCUSD price trend. In the previous article, when I was writing about the TD Trend Factor and TD Propulsion indicators, I finally outlined three possible scenarios for bitcoin trading.
At that time, it was difficult to determine the BTCUSD future trend.
Remember, there were three scenarios:
1. BTC price should rebound from level 12172.9 USD and go down
2. The price should rebound from level 14202.4 USD and be trading flat with a possible decline in future
3. The BTCUSD should continue moving up.
Now, if I apply the TD REI with the TD POQ filter to this chart, the situation becomes clearer.
As you see from the above chart, the last TD REI signal satisfies all the four conditions of the TD POQ filter (the overbought condition continues longer than six bars, the last bar’s close is higher than the previous bar’s close, the current bar’s open is higher than the lows of the two previous bars and the lows of those bars have been broken through).
In addition, as the fourth condition suggests, the market was trading lower than the reversal bar’s open (blue dots). Therefore, the first scenario, a more pessimistic one, becomes more likely. As I wrote in the previous article, the BTCUSD price is likely to hit the TD Propulsion Up level (level A). In fact, the market has already worked out this target so far, having not reached just a few dollars. Considering the bullish set up on the five-day timeframe, according to the TD Countdown, the btcusd may be trading flat for some more time. The BTCUSD may even try to hit level again 12172.9 USD, but, in general, it is not enough to invest your entire deposit into entering a buy trade.
As experience proves, the combination of TD REI signal and the TD POQ is a strong signal and I don’t recommend ignoring it. The BTC price is likely to rebound and continue its downward correction, according to the pessimistic scenario. After all, it doesn’t suggest that the bullish trend will necessarily end. However, my overview of the TD REI indicator won’t be complete if I don’t describe a situation, when the TD POQ filter doesn’t work.
The above chart represents such an example. You see that the TD REI has been in the overbought area for a long time, however the reversal bar (marked with the red arrow) doesn’t satisfy the last condition, the bar doesn’t break through the lows of the previous two bars. It is clear from the above chart, that the price hasn’t reached the level, marked with blue dots.
It suggests that the sell signal is false, and so, when the indicator reaches the oversold area, one might use this opportunity and enter a new buy trade, to increase the bullish position (I marked the buy zone with a green flag in the chart).
In case of a bearish trend and an unconfirmed buy signal, one may act in a similar way. However, you must always bear in mind that it is better to employ DeMark’s tools together. Only when all the indicators send the same signal, you can avoid trading mistakes and safely put entries.
I am not finishing writing about Thomas DeMark's oscillators. In my next educational posts, I am going to describe such indicators as:
TD DeMarker,
TD Pressure,
TD Range expansion Index,
TD Rate of Change.
Subscribe not to miss the continuation!
I wish you good luck and good profits!
Mikhail @Hyipov
________________________________________
like!
Subscribe!
Leave a comment!

My favorite indicatorsIndicators. They make us feel good, they comfort us, we love to expect too much from them then call them useless when they fail to predict the future.
Or at least some people do. I myself find indicators comforting, or should I say they bring me relief. They can make every thing smoother, they throw numbers at us. The number is either above our threshold or below, the answer is binary. They give us certainty which is something we all crave in this seemingly random continuous dynamic flow of prices.
I am going to start with the indicators I always use, and then present a few of my favorite ones and describe what they do and what I think of them.
1- Fibonacci
Sometimes it gets called an indicator, sometimes it does not. Indicator or not there is not 1 buy or sell I do that does not involve a retracement, extension, or at least the measuring tool.
I trust my eyes alot, but if I was to trust them to know if we are at 50%, more, or less, my judgements would be all over the place.
The definition of a fib retracement that is given is a tool that allows analysts to find areas of support.
It helps me see where we are and where to enter a trend. 23,6% and below is too early for me, 38,2% is often a nice one.
Fib extensions let me see how far we really have gone, and helps with finding targets, or when to look for reversal.
Depends on the context on various timeframes, this includes alot of things, depends my goals, and the pair or commodity.
2- Average True Range (ATR)
I use this one all the time. This indicator measures how much the price has been moving in the past specified number of candles, including gaps.
"It was created to allow traders to more accurately measure the daily volatility of an asset by using simple calculations."
I want to know how volatile the market is to help find out how "active" the pair is and other things, and to help define stop loss, entry, target.
If I am looking at a trend on the H4 and D1 timeframes and I want to ride it I will not want to buy a pullback of 1 H1 ATR. And target more than this too.
It can also be used to note how expensive - in spreads - a pair is: if the spread is 20% of the daily ATR, it will be pretty hard to day trade it.
Now, the ones I do not use often.
a- Moving Averages
Moving averages are indicators that go on the chart and show what the average price for a certain period & timeframe is over time.
The smooth out noise, and provide indications to determine what the direction of the trend is.
There are several types of moving averages: Simple, Exponential, Smoothed.
I do not use them.
First of all my eyes are trained to detect trends and find what I want to see in the price quickly.
Second, I am interested in vertical moves, both for going with or against the trend, am I so picky that the price clearly is past MAS.
Third, once I identified something I like I will do a full analysis of it, very detailled, precise, using MAS would be ridiculous.
b- Relative Strength Index, MACD, and Stoch
Ah one of scammy "vip educators laptop on the beach lifestyle" & novice investors favorite.
Those momentum indicators show strength, with alot of lag, and poor precision, the MACD also has additional info I will not get into.
Some bad unprofitable market participants use it for "oversold" readings, meaning they will consistently buy in downtrends.
I look at them sometimes mainly because I think they look good. They look "professional", and they can be conforting, seeing divergence triggers the rewarding center.
But I would not seriously incorporate them in my activities.
c- The Commitment of Traders
It is a report that shows the open interest of participants in the futures market.
A simplified version such as in the example below can help make decisions to buy long or short contracts.
While imperfect (a big hedger with a small speculative position has all counted as "commercial") and general, it can help with one's study of a commodity.
For example, gold was over-shorted at the bottom in August 2018.
d- Average Directional Movement (ADX)
This indicator that was designed for commodity daily charts can be used for about everything, and it shows the strength of a trend.
It does so by measuring the amount of price movement in a single direction.
Wilder suggests that a strong trend is present when ADX is above 25 and no trend is present when below 20.
I think it is better than the RSI or worse Stoch & MACD. In particular in the following example with the smoothed version (25 DI length), otherwise it can be all over the place.
I see how it could be used with an alert (when value > 25) to warn an investor a trend might be happening. Also to help filter consolidations many want to avoid, if the eyes are not trained yet to a naked chart, or if the investor is not disciplined.
e- STDEV & Implied Volatility
Standard Deviation is a statistical calculation used to measure the variability.
Implied volatility is a metric that captures the market's view of the likelihood of changes in a given security's price.
The VIX is a market index that tries to project the expected volatility (downwards because that's all they care about) in the stock market.
I do not care much about those values. ATR + Fib + Measuring tool etc are better.
f- Bollinger Bands
These bands envelop the price using a moving average (20SMA) and standard deviations away from it.
"When the bands tighten during a period of low volatility, it raises the likelihood of a sharp price move in either direction."
It is supposed to help visualise tight periods before a big move. And the price often stays between the bands (that's not very helpful).
Sometimes when the price really gets tight with BB it really hits the eyes (Bitcoin), the small range and then the massively expanding one.
I do not really see the use for it. Bollinger Band users blind much? I have no use for them but they sure look pretty.
g- Volume for Stocks & Crypto
Good luck using volume with Forex. Volume tells us how much activity has happened. Did the price go up with only a few buyers? Or were there a whole lot of them?
Is a support strong: Many participants are watching it? Or only a few = not that strong.
There is a whole lot you can deduce with volume, but it is not the holy grail either. I rarely use it because the Forex market is OTC and we do not have that data, and with futures, it is rarely that useful.
h- On Balance Volume (OBV)
OBV rises when volume on up down is bigger than volume on down days. Its creator thought that volume precedes price.
It was designed to help detect bottoms with divergence, and spot smart money (big institutions) buying while dumb money (retail) was selling.
I doubt it will make the dumb money (that all think they are this special wonderboy) outsmart the dumb money.
Retail investors are likely to call bottoms every 2 weeks and chase bottoms and get giga rekt in the biggest bear market ever.
Maybe a good idea to go short when there are bullish signals in the future? I can already picture greedy and overexcited "investors" chasing every single "signal" they see. There will be many pullbacks in the big downtrend.

Bill Williams - Three Wise MenA tutorial on the "Three wise men" strategy by Bill Williams. This strategy was introduced in his book, "Trading Chaos". I highly recommend reading the book before actually using this strategy.

RSI Static Supports and Resistances on Multi time framesRSI Static Supports and Resistances on Multi time frames.
educational

Evolution of MACDMoving Average Convergence Divergence – MACD
The most popular indicator used in technical analysis, the moving average convergence divergence (MACD), created by Gerald Appel. MACD is a trend-following momentum indicator, designed to reveal changes in the strength, direction, momentum, and duration of a trend in a financial instrument’s price
Historical evolution of MACD,
- Gerald Appel created the MACD line,
- Thomas Aspray added the histogram feature to MACD
- Giorgos E. Siligardos created a leader of MACD
MACD employs two Moving Averages of varying lengths (which are lagging indicators) to identify trend direction and duration. Then, MACD takes the difference in values between those two Moving Averages (MACD Line) and an EMA of those Moving Averages (Signal Line) and plots that difference between the two lines as a histogram which oscillates above and below a center Zero Line. The histogram is used as a good indication of a security's momentum.
Mathematically expressed as;
macd = ma(source, fast_length) – ma(source, slow_length)
signal = ma(macd, signal_length)
histogram = macd – signal
where exponential moving average (ema) is in common use as a moving average (ma)
fast_length = 12
slow_length = 26
signal_length = 9
The MACD indicator is typically good for identifying three types of basic signals;
Signal Line Crossovers
A Signal Line Crossover is the most common signal produced by the MACD. On the occasions where the MACD Line crosses above or below the Signal Line, that can signify a potentially strong move. The standard interpretation of such an event is a recommendation to buy if the MACD line crosses up through the Signal Line (a "bullish" crossover), or to sell if it crosses down through the Signal Line (a "bearish" crossover). These events are taken as indications that the trend in the financial instrument is about to accelerate in the direction of the crossover.
Zero Line Crossovers
Zero Line Crossovers occur when the MACD Line crossed the Zero Line and either becomes positive (above 0) or negative (below 0). A change from positive to negative MACD is interpreted as "bearish", and from negative to positive as "bullish". Zero crossovers provide evidence of a change in the direction of a trend but less confirmation of its momentum than a signal line crossover
Divergence
Divergence is another signal created by the MACD. Simply, divergence occurs when the MACD and actual price are not in agreement. A "positive divergence" or "bullish divergence" occurs when the price makes a new low but the MACD does not confirm with a new low of its own. A "negative divergence" or "bearish divergence" occurs when the price makes a new high but the MACD does not confirm with a new high of its own. A divergence with respect to price may occur on the MACD line and/or the MACD Histogram
Moving Average Crossovers , another hidden signal that MACD Indicator identifies
Many traders will watch for a short-term moving average to cross above a longer-term moving average and use this to signal increasing upward momentum. This bullish crossover suggests that the price has recently been rising at a faster rate than it has in the past, so it is a common technical buy sign. Conversely, a short-term moving average crossing below a longer-term average is used to illustrate that the asset's price has been moving downward at a faster rate and that it may be a good time to sell.
Moving Average Crossovers in reality is Zero Line Crossovers, the value of the MACD indicator is equal to zero each time the two moving averages cross over each other. For easy interpretation by trades, Zero Line Crossovers are simply described as positive or negative MACD
False signals
Like any forecasting algorithm, the MACD can generate false signals. A false positive, for example, would be a bullish crossover followed by a sudden decline in a financial instrument. A false negative would be a situation where there is bearish crossover, yet the financial instrument accelerated suddenly upwards
What is “MACD-X” and Why it is “More Than MACD”
In its simples form, MACD-X implements variety of different calculation techniques applied to obtain MACD Line, ability to use of variety of different sources, including Volume related sources, and can be plotted along with MACD in the same window and all those features are available and presented within a single indicator, MACD-X
Different calculation techniques lead to different values for MACD Line, as will further discuss below, and as a consequence the signal line and the histogram values will differentiate accordingly. Mathematical calculation of both signal line and the histogram remain the same.
Main features of MACD-X ;
1- Introduces different proven techniques applied on MACD calculation, such as MACD-Histogram, MACD-Leader and MACD-Source, besides the traditional MACD (MACD-TRADITIONAL)
• MACD-Traditional, by Gerald Appel
It is the MACD that we know, stated as traditional just to avoid confusion with other techniques used with this study
• MACD-Histogram, by Thomas Aspray
The MACD-Histogram measures the distance between MACD and its signal line (the 9-day EMA of MACD). Aspray developed the MACD-Histogram to anticipate signal line crossovers in MACD. Because MACD uses moving averages and moving averages lag price, signal line crossovers can come late and affect the reward-to-risk ratio of a trade. Bullish or bearish divergences in the MACD-Histogram can alert chartists to an imminent signal line crossover in MACD
The MACD-Histogram represents the difference between MACD and its 9-day EMA, the signal line. Mathematically,
macdx = macd - ma(macd, signal_length)
Aspray's contribution served as a way to anticipate (and therefore cut down on lag) possible MACD crossovers which are a fundamental part of the indicator.
Here come a question, what if repeat the same calculations once more (macdh2 = macdh - ma(macdh, signal_length), will it be even better, this question will remain to be tested
• MACD-Leader, by Giorgos E. Siligardos, PhD
MACD Leader has the ability to lead MACD at critical situations. Almost all smoothing methods encounter in technical analysis are based on a relative-weighted sum of past prices, and the Leader is no exception. The concealed weights of MACD Leader are such that more relative weight is used in the more recent prices than the respective weights used by the components of MACD. In effect, the Leader expresses more changes in average price dynamics for the recent price movement than MACD, thus eventually leading MACD, especially when significant trend changes are about to take place.
Siligardos creates two less-laggard moving averages indicators in its formula using the same periods as follows
Indicator1 = ma(source, fast_length) + ma(source - ma(source, fast_length), fast_length)
Indicator2 = ma(source, slow_length) + ma(source - ma(source, slow_length), slow_length)
and then take the difference:
Indicator1 - Indicator2
The result is a new MACD Leader indicator
macdx = macd + ma(source - fast_ma, fast_length) - ma(source - slow_ma, slow_length)
• MACD-Source, a custom experimental interpretation of mine,
MACD Source, presents an application of MACD that evaluates Source/MA Ratio, relatively with less lag, as a basis for MACD Line, also can be expressed as source convergence/divergence to its moving average. Among the various techniques for removing the lag between price and moving average (MA) of the price, one in particular stands out: the addition to the moving average of a portion of the difference between the price and MA. MACD Source, is based on signal length mean of the difference between Source and average value of shot length and long length moving average of the source (Source/MA Ratio), where the source is actual value and hence no lag and relatively less lag with the average value of moving average of the source . Mathematically expressed as,
macdx = ma(source - avg( ma(source, fast_length), ma(source, slow_length) ), signal_length)
MACD Source provides relatively early crossovers comparing to MACD and better momentum direction indications, assuming the lengths are set to same values
For further details, you are invited to check the following two studies, where the first seeds were sown of the MACD-Source idea
Price Distance to its Moving Averages study, adapts the idea of “Prices high above the moving average (MA) or low below it are likely to be remedied in the future by a reverse price movement", presented in an article by Denis Alajbeg, Zoran Bubas and Dina Vasic published in International Journal of Economics, Commerce and Management
First MACD like interpretation comes with the second study named as “P-MACD”, where P stands for price, P-MACD study attempts to display relationship between Price and its 20 and 200-period moving average. Calculations with P-MACD were based on price distance (convergence/divergence) to its 200-period moving average, and moving average convergence/divergence of 20-period moving average to 200-period moving average of price.
Now as explained above, MACD Source is a one adapted with traditional MACD, where Source stands for Price, Volume Indicator etc, any source applicable with MACD concept
2- Allows usage of variety of different sources, including Volume related indicators
The most common usage of Source for MACD calculation is close value of the financial instruments price. As an experimental approach, this study will allow source to be selected as one of the following series;
• Current Close Price (close)
• Average of High, Low, and Close Price (hlc3)
• On Balance Volume (obv)
• Accumulation Distribution (accdist)
• Price Volume Trend (pvt)
Where,
-Current Close Price and Average of High, Low, and Close Price are price actions of the financial instrument
-Accumulation Distribution is a volume based indicator designed to measure underlying supply and demand
-On Balance Volume (OBV), is a momentum indicator that measures positive and negative volume flow
-Price Volume Trend (PVT) is a momentum based indicator used to measure money flow
3- Can be plotted along with MACD in the same window using the same scaling
Default setting of MACD-X will display MACD-Source with Current Close Price as a source and traditional MACD can be plotted eighter as a companion of MACD-X or can be selected to be plotted alone.
Applying both will add ability to compare, or use as a confirmation of one other
In case, traditional MACD Is plotted along with MACD-X to avoid misinterpreting, the lines plotted, the area between MACD-X Line and Signal-X Line is highlighted automatically, even if the highlight option not selected. Otherwise highlight will be applied only if that option selected
4- 4C Histogram
Histogram is plotted with four colors to emphasize the momentum and direction
5- Customizable
Additional to ability of selecting Calculation Method, Source, plotting along with MACD, there are few other option that allows users to customize the MACD-X indicator
Lengths are configurable, default values are set as 12, 26, 9 respectively for fast, slow and smoothing length. Setting lengths to 8,21,5 respectively Is worth checking, slower length moving averages will lead to less lag and earlier reaction to price actions but yet requires a caution and back testing before applying
Highlight the area between MACD-X Line and Signal-X Line, with colors emphasising the direction
Label can be added to display Calculation Method, Source and Length settings, the aim of this label is to server only as a reminder to trades to be aware of settings while they are occupied with charts, analysis etc.
Here comes another question, which is of more importance having the reminder or having the indicators with multi timeframe feature? Build-in Multi Time Frame features of Pine is not supported when labels and lines introduced in the script, there are other methods but brings complexity. To be studied further, this version will be with labels for time being.
EPILOGUE
MACD-X is an alternative variant of MACD, the insight/signals provided by MACD are also applicable to MACD-X with early and clear warnings for the changes in the trend.
If MACD is essential to your analysis, then it is my guess that after using the MACD-X for a while and familiarizing yourself with its unique character and personality, you will make it an inseparable companion to other indicators in your charts.
The various signals generated by MACD/MACD-X are easily interpreted and very few indicators in technical analysis have proved to be more reliable than the MACD, and this relatively simple indicator can quickly be incorporated into any short-term trading strategy

EURUSD 19 AUGUST 2020 RSI to ID accumulation in uptrend.RSI has recently become part of my style. I spent over a year learning how to identify the actions of smart money using volume. Understanding where something is and why its doing what its doing does not require RSI or any other indicator other than volume. I highly recommend that if this is a profession you truly want to pursue, you must spend some time understand volume. Volume is what moves price. With volume, you can very precisely see wether or not buying or selling is active or not. This is arguably the most important thing to understand in the markets and about 99% of people don't, including "experts"... and its actually not that hard.
Imagine volume as energy.
Energy can be stored (accumulated) and/or released (distributed).
If you haven't familiarised yourself with Richard Wyckoff's accumulation and distribution schematics please DDgo them (or google). If you follow me and look and my analysis (thank you very much by the way!) you are probably already familiar with the way I explain things and how I swear by VSA/Wyckoff.
RSI settings are slightly adjusted to increase sensitivity. I find these setting very reliable for signalling particularly on the 15 minute and in Forex (still working out some settings with digital).
I highlighted the areas of accumulation/re-accumulation. What is critical to understand is that we are only using the 1 hour to judge the condition of the trend (bearish or bullish) and not for entry. The 5 and 15 are used for entry because the smaller time frames convey greater detail. Within those two times frames you can begin more of a range analysis versus a trend analysis (will build on that concept in another chart).
Once RSI is below the median line (50 level or a MA) in a positively identified up trend, you can start looking for phase "A" ( selling climax, preliminary support, automatic rally and secondary test). once these are identified the trading range has been established and you can begin looking for phases "C" and "D" for a possible no supply entry after a spring ( or on the spring if you are really good with your risk management).
Again, use RSI for your trend analysis to identify these critical pullback areas and never chase.

Trend playing with RSII have never been fan of RSI, however after 1,5 years of trading, I decided to give it a shot and find out, whether this famous indicator could be useful for me or not.
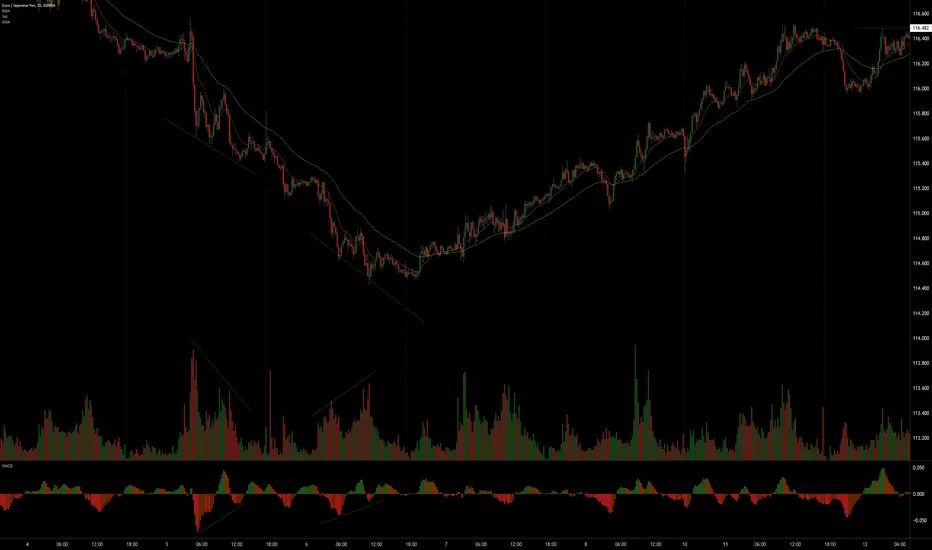
First of all I was certain, that I will be using this indicator only on higher time frames, I was testing it on 15 minutes TF, but for me, there was just too much "noise" and I found out, that RSI on 1hr is best setup for me. And I found one pattern, that is constantly repeating in TRENDING market and I found this pattern very, very useful.
I still think, that best trading advice is "trend is your friend" and I remember when I was always trying to catch bottoms or tops and I always got stopped out and miss continuation of dominant trend. This pattern on RSI is good indication, that trend isn´t finished yet and now you have a chance to get on the "train".
This pattern is simple : UPTREND CYCLE: bearish divergence -> bullish divergence -> new swing high -> repeat.
DOWNTREND CYCLE: bullish divergence -> bearish divergence -> new swing low -> repeat
Of course, you just can´t trade based on this pattern, I am using it with eliott waves, so if I see finished correction or 5-wave reversal and I am also seeing that trend divergence, I will always bet on trend continuation. You also can´t predict any take profit with this pattern, but as a trend follower, it works perfectly.

How to use the Oscar OscillatorOSCAR Oscillator by GenZai
Green line is the Oscar Rough
Red line is the Oscar
By default based on the 8 last candles and smoothed using RMA
Purple line is the Slow Oscar
By default based on the 16 last candles and smoothed using WMA
HOW TO USE
Exit signaling
This indicator can be used as an exit indicator when line cross each other.
Entry signaling
When the green line crosses up, it indicates a long entry
When the red line crosses up, it indicates a short entry
Overbought/Oversold
When the indicator crosses the dashed grey lines it indicates Overbought Oversold
Slow Oscar Add-on
This is an Add-on to the orignal Oscar indicator
Can be hidden if you want the original experience of the Oscar indicator.
Can be used as a confirmation indicator by looking at the direction of the slope to verify is your are trending long or trending short.
Can be used as a baseline to confirm signals given by Oscar
Can be used to tweak your signals and test different settings.
Stock or Forex?
The program was originally written for stocks, but works equally well with the Forex market.
How this indicator is calculated ?
This is the formula we use to calculate the Oscar:
let A = the highest high of the last eight days (including today)
let B = the lowest low of the past eight days (including today)
let C = today's closing price
let X = yesterday's oscillator figure (Oscar)
Today's "rough" oscillator equals (C-B) divided by (A-B) times 100.
Next we "smooth" our rough number (let's call it Y) like this:
Final oscillator number = ((X divided by 3) times 2), plus (Y divided by 3).
SETTINGS:
You can choose between different smoothing options:
RMA: Moving average used in RSI. It is the Adjusted exponential moving averages (also known as Wilder's exponential moving average)
SMA : Simple moving average
EMA : Exponential moving average
WMA : Weighted moving average
The Script can be found here:

ETHUSD 4H RSI 80-20 TRADING STRATEGY SHORT TRADERSI 80-20 TRADING STRATEGY SHORT TRADE RULES
1 - Find Highest candle in the last current 50 bars.
2 - That High candle coupled with RSI above 80 level.
3 - Wait for a new Swing HIgh but RSI is lower - DIVERGENCE.
4 - ENTER on breakout candle close below 1st candle's low.
5 - Stop Loss above new swing high.
6 - EXIT with a 1 to 3 risk reward Take Profit.
Add RSI to chart
Adjustments:
14 period, to 8.
70 and 30 lines, to 80 and 20.
This indicator comes standard on most trading platforms. You’ll just need to make the adjustments above.
Step 1 - Find the currency pair that is showing a high the last 50 candlesticks. (OR low depending on the trade)
The 80-20 Trading strategy can be used for any period. This is because there are reversals of trends in every period. This can be a swing trade, day trade, or a scalping trade. As long as it follows the rules, it is a valid trade. We also have training for building a foundation before a forex strategy matters. In this step, we only need to ensure it is the low or the high of the last 50 candles.
Step 2 - Using the RSI Trading Indicator:
When we find 50 candle high, it needs to be coupled with RSI reading 80 or higher. (If it’s low it needs to be combined with the RSI reading 20 or lower.). We have a reading that hit the 80 line on the RSI and was the high the last 50 candles.
Once we see that we had a high, the last 50 candles, and the RSI is ABOVE 80, we can move to the next step. Remember that this strategy is a reversal strategy. It is going to break the current trend and move the other direction.
Step 3 - Wait for a second price (high candle) to close after the first one that we already identified.
The second price high must be above the first high. Although, the RSI Trading indicator must provide a lower signal than the first. Remember that divergence can be seen by comparing price action and the movement of an indicator. If the price is making higher highs, the oscillator should also be making higher highs. If the price is making lower lows, the oscillator should also be making lower lows. If they are not, that means price and the oscillator are diverging from each other. Which is why it’s called “divergence.”
Just because you see a bullish or bearish divergence, doesn’t mean you should automatically jump in with a position. We have rules in place that will capitalize on this divergence so that we can make a significant profit. Keep in mind, that this step may take time to develop. It is very important to wait for this second high because it gets you in a better trade making position.
Price goes up/RSI goes down. That is the Divergence. Remember that our example is a current uptrend looking to break to the downside. If this was a 50 candle low, we would be looking at the exact opposite of this step.
Step 4 - How to Enter the Trade with the RSI Trading Strategy.
The way you enter a trade is very simple. You wait for the price to head in the direction of the trade and wait for a candle to close below the first candle that you identified that was previously 50 candle high.
Step 5 - Once you make your entry, place a stop loss.
To place your stop, bump back 1 to 3 time periods and find a reasonable, logical level to put your stop. You are looking for prior resistance or support.
We placed our stop below this support area. That way if the trend continued and did not break, it could hit this level and bounce back up in our direction.
Step 6 - I recommend you follow at least a 1 to 3 profit vs. risk level. This will ensure that you are maximizing your potential to get the most out of the strategy.
You can adjust as you wish. Keep in mind that most successful strategies that identify breaks of a trend use a 1 to 3 profit vs. risk level.

EURUSD identifying dist. with RSI/15 min (ref.)RSI @ 7
oversold @ 75
Overbought @ 25
VWMA @ 100
Avoid selling into support (strength)
Avoid buying into resistance (weakness)

Overbought to Oversold - Keep It Simple, Stupid!After exploring the depths of profit taker heaven and stop loss hell, after combining many different indicators, finding correlations with momentum, trend, volatility, you name it... After trying to adjust the strategies to different assets, asset classes, market conditions... After finding out that each of these steps are way more difficult than I thought and will require much more rigor and a start from scratch...
I remembered the golden rule of strategy...
"Keep it simple, stupid!"
When others are buying like rabid dogs, you sell...
When others are selling like mad monkeys, you buy...
When others are greedy, you are fearful... When others are fearful, you are greedy...
So, we trade from overbought to oversold. No profit takers, no stop losses, no optimization for a specific stock or time frame or asset class, no correlation with other indicators... Just overbought to oversold.
Win rate of 90+%, profit factor of over 5.0, compared to holding the stock indefinitely with a loss of 80%.
Happy trading!

Kyber Network (KNC USDT) - Breakdown of Recent Trades I recently took two discretionary positions on KNC/USDT. In this analysis I've documented my thought process and execution sequentially from left to right in the call outs.
In these trades I used several methods of analysis.
1. Chart Patterns
My first trade entry was predicated upon a Rectangle Top Pattern I identified KNC forming. Rectangle Tops occur during bullish up trends and when the overall market is bullish, as altcoins currently are, they have a high probability of breaking to the upside.
2. Trend Analysis
Fundamental to my trading strategy is trading in the direction of the overall trend. Trading against the dominant trend is like stepping over dollars to pick up pennies. Using the Daily and 4HR time frame, I identified that KNC was above my Base Line indicator, therefore confirming a bullish trend and that I should be trading to the long side.
3. Target Measurement
For my initial trade I used Bulkowski's measurement method for Rectangle Tops, measuring the difference from Resistance to Support and adding that to Resistance. This proved to be successful, however my first trade ended up running quite a bit beyond my target. For this reason I used my primary method of profit taking, 50/50. I take 50% of my profit at a pre-determined level and allow the rest of my position to run to take advantage of powerful trends.
4. Indicator Support
Utilizing my ICYSbot indicator and strategy to help supplement entry and exit conditions.
5. Patience and Risk Management
I used a position sizing strategy where a pre-determined percentage of my account is at risk should my trade hit the stop loss. In this case, I personally used 2% risk per trade. I also did not rush these trades, I let price evolve and the trend emerge as it did. I attached no personal bias or feelings toward the trade.
Overall, quite happy with these trades. I hope this post was helpful in providing insight into how I view the markets and trade execution. Thank you for your support.
Trade safely!

Awesome OscillatorThe Awesome Oscillator (AO) is displayed as a histogram showing the market momentum based on a comparison of the simple moving average (SMA) of the last 5 price bars median to the simple moving average of the last 34 price bars median.
MEDIAN PRICE = (HIGH+LOW)/2
AO = SMA(MEDIAN PRICE, 5)-SMA(MEDIAN PRICE, 34)
When the momentum of the past 5 bars is weak compared to that of the 34 bar period, the AO displays this shift as a red bar. When the recent 5 bar momentum is stronger, the AO displays the shift as a green bar. The AO displays these shifts by a series of red and green bars. Series of red bars indicate declining bias. Series of green bars indicates rising bias.
Related to the AO are Zero Line Cross Over , Twin Peaks Patterns , and Price/Momentum Divergence . When the AO is added to other technical indicators, such as Divergent Bars and Bollinger Bands, traders are able to assess which way a stock is likely to move. The AO can help see what is coming!
Zero Line Cross Over
When the AO crosses over the zero line, moving from above the zero line to below the zero line, this is a declining bias indicator. A rising bias is indicated when the AO crosses over the zero line, moving from below to above.
Twin Peaks
The Twin Peaks pattern indicates a declining bias when the AO forms a series of green and red bars where each transition from green to red (a peak) is smaller than the previous peak.
A rising bias is indicated when the AO forms a series of green and red bars where each transition from green to red (a peak) is larger than the previous peak.
Price/Momentum Divergence
Declining Bias - When the AO shows declining momentum and, during the same time period the price of the stock is showing a rising trend (higher highs and higher lows), there is divergence that is forecasting an eventual decline in the price. When momentum weakens, price may still rise for a period however, without momentum the price will snap back because there is not enough buying volume to maintain the upward price momentum. Imagine a rubber band stretched between the two ends of the “V” formed by the two trend lines.
In the chart example above, you can see the strong divergence between rising price and declining momentum. The price ended up snapping back in line with the AO and then continued to move lower.
Rising Bias - When the AO shows rising momentum and, during the same time period the price of the stock is showing a declining trend (lower lows and lower highs), there is divergence that is forecasting an eventual rise in the price of the stock. When momentum strengthens, price may still decline for a period however, eventually increasing momentum will push the price higher.

The Holy Grail of RSI - How to use RSI Effectively 4 BIG PROFITSHello Traders,
This video explains how I use RSI to generate big returns in the Forex market. RSI has always been one of my favorite leading indicators I use when looking for confirmations. I highly recommend it. Take a few minutes to watch my video and learn how to use it effectively for intraday trading.
Trade Safe - Trade Well
~Michael Harding


BTCUSD 4 hour RSI signalling RSI sensitivity at 7
Instead of 70/30, levels are set at 80/20.
Using RSI as an adjunct/signal tool. Note the volume anytime RSI breaks the 20 level. You can set an alert at 20/30. Whenever price breaks this level you will be alerted and there may be a potential long situation setting up.
RSI can convey divergences between price and volume.
Also can be used as a final confirmation. for example, you are about to enter long but notice RSI hovering around the 50 level: Middle of range, not ideal.
Takes patience but there are opportunities off of the 20 RSI if you understand volume.
practice*

EURUSD 1H RENKO CHART STRATEGY #2The second simple Renko Trading Strategy system is an indicator based strategy that uses price-momentum divergence to identify trend reversals.
Renko Trading Strategy #2
For this Renko trading strategy, we only need to use the RSI indicator. We can use a 14- period or a 20-period RSI indicator. So, use the same period as the ATR 14 or 20 Renko brick size.
After we spot the momentum divergence an entry signal is triggered once we get a reversal. On the Renko chart, a trend reversal is set in motion once the brick changes color. In this case, when we spot a bearish divergence, enter a short position after the brick turns red.
For bullish divergence, wait for the brick to turn green.
We exit our profitable trade once another reversal pattern is formed in the opposite direction of our trade. As a method to protect our account balance and not lose too much, you can place your SL above and below the swing point developed after your entry.
A lot of the noise inherent in regular time-based charts are eradicated. So, if you trade with Renko charts, spotting divergence and trend reversals are a lot easier. The RSI is the best indicator to use with Renko.
Read the previous Renko Chart post to learn about Renko chart system.

CLQ0: Corrective Formation Oil has been very bullish as of lately; the September delivery contract is up by almost 100% from its YTD low. The hidden bullish divergence implies a significant amount of pullback continuation players in the market. Trying to follow the momentum by buying dips and being alert for signs of bearish reversal is the prudent approach. The risk of a fast bear action that sheds at least 1/8th of the value is ever more present the further upside oil sees from here.
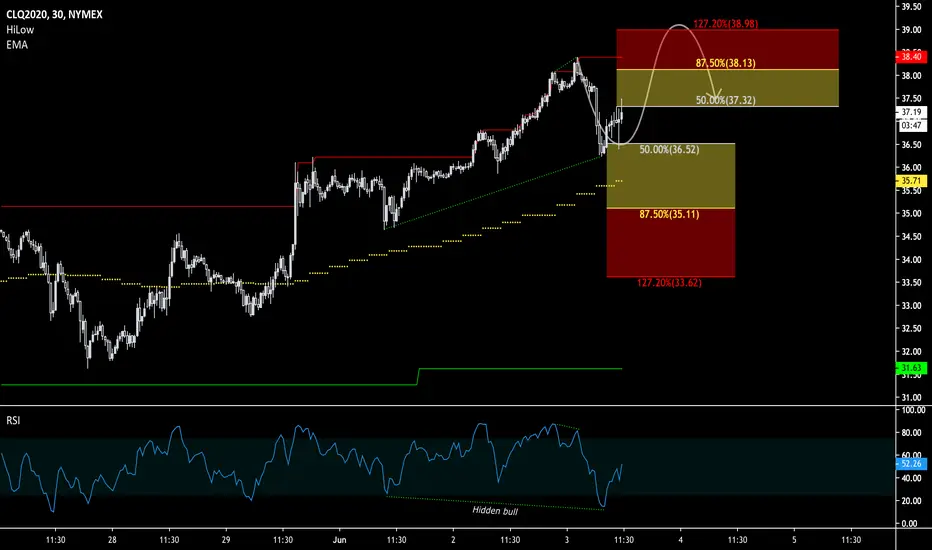
RSISometimes when the RSI is at 72, (overbought) you just need to short. We can clearly see that a simple look at it would have increased your profits. Personally, when ever it is over 70 or below 30, I always act corresponding to it. Remember trading is risky and things can go sideways fast!

USDJYP RSI Training referenceDowntrend
RSI (10) negative divergence into resistance with supply expansion
RSI 80/20
Diminished demand at test area (neckline) with supply in the background
Hypothetical push through entry to initial profit area .39%
Training reference/practice

EURJPY how good are you part 5: Validating a divergenceOne positive divergence led to lower prices (failed divergence).
One positive divergence led to a trend reversal.
Why?