GBPUSD – Buyers momentum reaction from the channelGBPUSD – Buyers momentum reaction from the channel
Trend: Buy/ Neutral
Support/Resistance:
R2: 1.29929
R1: 1.28974
S1: 1.28378
S2: 1.27548
Price action:
Buyers were very strong from news announcement, but the problem is because we have small gap downside. We might reach channel next touch but be aware of the gap and market behaviour like we are teaching in our elite course.
Potencial trade idea:
Bulls targets:
T1: 1.28974
T2: 1.29929
Bears targets:
T1: 1.27548
NOTE – We are trading GBPUSD via the preferred trading setups
Disclamer1: We have to wait for a currency pair to trade after news are reliased. This might be a short correction, or price will give us moving dirrection after news are reliased.
Disclaimer2: Martin's views on the Chart analysis is ment as a trading advice for education terms; Education terms include: trading consistency to everyone who is reading this blog; for every advance student and for every Elite student who is using this analysis for managing his equity by Elite strategy and custom indicator. This analysis is understandable and transparent for all Elite students. This is a free content which is based from Academy in term of transparency to support and following progress to everyone. We know that there is always possible way that market can pull you out even when you follow our analysis blog and advice for a trade. We don't publish where you have to have your risk management – Stop Loss, because, it would not be fair to Elite members, who learned this techniques in our Elite course.
ELITEFXACADEMY
Parallel Channel

Bitcoin : Shadow support and short term view.Hello all, welcome to the Saturday update of current bitcoin condition after yesterday's drop. Currently, After the drop we can see that the price is entering a shadow support (the yellow region). The shadow support itself is the area where the previous period's bull trap or the wick fishing region located.
So, here is my view in the short term, we can see that the price has touched the yellow region and there is a possible consolidation to occur at this area. I do believe we can see the price to have 1 more drop to the next strong support which has confluence zone with the golden pocket region. After that, we can see the price to touch the previous broken support that is now acting as a resistance as well around $9000 region.
From the daily perspective region, we can see that the MACD histogram is having the first ticking down to the negative side and the bearish action has completed with the confirmation of the death cross on moving average in the MACD.
However, $8500 will become a very strong support and there is a very good region to accumulate the long order.


Matic network with possible 50% gain on SWINGThis is a quick update analysis about some of altcoins which have a good potential to grow and produce a possible huge profit in the near future. Let's do the technical analysis.
History is repeating itself is the most suitable quotes on MATIC here. we can see a similar pattern with previous structure in this huge up trend channel. we see a failure descending triangle which it broke to the upside. And in this current move, there is a possibility of it to repeating this previous pattern. A series of higher high and higher low can be a good reason for me to enter this trade.
If the price breaks out of the upper line of the triangle, I will enter the position and targeting the upper line of the huge up trend channel. 2 potential target that have the alignment with the previous price action is at around 230 and 270.
Watch out and let's be rich together.
Draw perfect channelsDraw perfect channels using a quick hack.
1. Draw at least one level connecting two highs or lows that are of importance
2. Press and hold control and click and drag with your mouse
3. Now you're an expert channel drawer :)
Don't invest what you can't afford to lose. This is not investment advice. Subjective view/report of a financial product only.
You can learn price action trading at no cost. Join my mailing list to receive more information zc.vg
DISCLAIMER
All information published within this website is purely for educational purposes and offers no guarantees. Profit Fx, Forex Bootcamp and any of its associates cannot be held responsible for any trades that you have executed in any way whatsoever. Please familiarize yourself with the relevant risks involved when trading forex, CFD’s and other products. Any trading is done solely at your own risk. Profit Fx, Forex Bootcamp and any of its associates are in no way employed by any broker or any other legal entity. All information published within this website does not constitute advice, but rather objective information about a financial product and analysis or report of a financial product.

Elliott Wave Theory and Fibonacci This chart correponds to the example commented in our educational article "Elliott Wave Theory and Fibonacci ."

Possible 30% gain on this altcoinsHello Fellas, Today is a very interesting day when we see at the market . it is all because I saw a lot of buy signals from altcoins which could lead them into a huge bullish run in the next few days.
First of all, if we look at the 4 hours chart, we can easily find an ascending triangle has been formed which usually could lead the price to go up. Beside that, I've seen a possible 5th wave is going to be formed in near future.
Because I often see a truncated 5th wave which usually lead us to the double top pattern, I will be waiting for the break out confirmation of this 4 hours pattern. and enter long position from here.
My 1st target will be between 19700 - 20000 which act as previous swing high of current pattern. My highest target for mid term is around the 25000 which is 30% up from current price. However, between 20000 - 25000, I see a lot of significant resistance is ready to fight the price back, that's why I will give you a breakdown update for those resistance ahead.
Thank you.

USDSGD 10.24RUSDSGD 10.24R Parallel Channel Support Resistance
Enter on the Retest of the Horizontal Support Resistance Line. Exit at the next Horizontal Support Resistance Line.

USDSGD Exit 1.37211USDSGD
Entry 1: 1.38463
Entry 2: 1.38063
Exit: 1.37211
-----------------------------------------------------
First Entry: 6.18R
Second Entry: 4.06R
Total 10.24R

Impulsive Waves Construction - Part 2 (03)The following chart corresponds to the third chart of our article "Motive Waves Construction - Part 2".

Impulsive Waves Construction - Part 2 (02)The following chart corresponds to the second chart of our article "Motive Waves Construction - Part 2".

Impulsive Waves Construction - Part 2 (01)The following chart corresponds to our article "Impulsive Waves Construction - Part 2".

gbpnzd pattern tutorialprice action is all about pattern repetition here u will c same structure not so long ago now it repeating if u hopping to buy wait fo break up then buy

EURUSD 4.29R 154.3 PipsHorizontal Support Resistance, Diagonal Support Resistant (Parallel Channel), Dynamic Support Resistance (EMA 10 EMA 20), Pin Bar.
Enter at Horizontal Level
Exit at Horizontal Level
Enter at 50% Retracement of Pinbar. 50.0 Fibonacci Retracement Level.
Exit at Horizontal Level of the Equidistant Channel. (Target 1)
Exit at the Measured Move Measured Objective of the Flag Pattern. (Target 2)

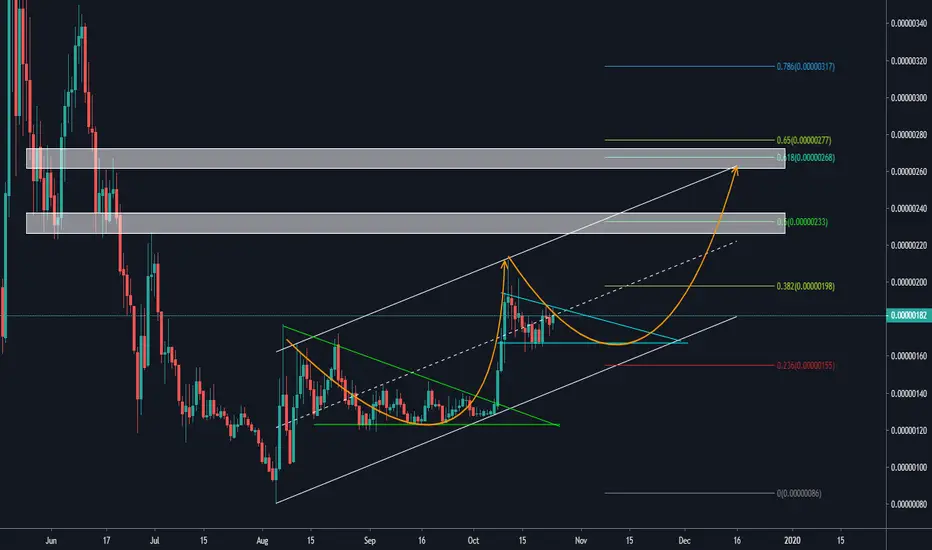
Signature of perfectionist buyers to trade a small reboundFor those who still wonder by what miracle chart analysis can work well, here's a proof:
Such proofs, I often see and they are an integral part of my publications, but I had not yet had the idea to dedicate a small Tutorial, and this proof is perfect for its simplicity and its obvious!
It is simply a question of proving that Chartism is neither a science nor divination or pure chance.
In technical analysis , there is especially a strong psychological dimension to study, interpret, and try to anticipate or at least use to his advantage.
This proof is an ascending channel that is anything but the product of hazard: a whale (market maker) or a set of individuals (I did not check the order book because it doesn't matter) traced a bullish trend resistant between the two recent peaks as you can see in white on my graph, then reported a parallel (you have the dedicated tool "Parallel Channel" to do the same in Tradingview), adjusted on the bottom of my graph: and he has (they have) placed their (their) purchase order very exactly on this parallel during the dump of the Rising Wedge of my previous publication (here in dashed for reminder), which also coincides with the expected target of this pattern of reversal (return bearish to the base of the wedge ).
The perfection of the pattern with this rebound leaves no room for doubt: it was not the result of chance, which gave the opportunity to anticipate and enjoy it with the interesting probability that there is a greater number of Long trades on the same simple track as on a direct continuation of the dump without rebound.

NZDCAD Entry Near The Price Level 0.87333 NZDCAD Parallel Channel
Action Steps:
Draw Support Resistance Line
Wait for the Market to Break and Retest Support Resistance Line


