Trade The Structure On PEPE, Not The Green Candles (8H)Considering the strong breakout of price above the long-term bearish trendline and the successful reclaim of key structural levels, the overall market structure of PEPE has shifted to bullish. This move was impulsive and backed by strong momentum, which usually signals a change in market sentiment rather than a simple short-term reaction.
At this stage, we are not chasing price. Instead, the focus is on finding buy or long opportunities from the origin of the move and well-defined support zones. These areas are where smart money and market makers typically defend price after a breakout. Market makers often manipulate price by creating pullbacks or short-term sell pressure to shake out late buyers, absorb liquidity, and build long positions at better prices.
For this reason, we have identified two potential entry zones that can be executed using a DCA approach. This allows traders to manage risk more effectively and avoid emotional entries during temporary volatility. A pullback into these zones does not invalidate the bullish structure; on the contrary, it can be part of a healthy retracement engineered to trap impatient traders before continuation.
The targets have been clearly marked on the chart based on structure projections and previous resistance levels. As long as price holds above the key support and respects the reclaimed structure, the bullish scenario remains valid.
However, it is important to stay disciplined. A daily candle close below the invalidation level would signal that market makers have shifted behavior, the structure has failed, and this setup is no longer valid. Until then, patience is key and reacting to manipulation instead of chasing candles will provide the best trading opportunities.
If you have a coin or altcoin you want analyzed, first hit the like button and then comment its name so I can review it for you.
This is not a trade setup, as it has no precise stop loss, stop, or target. I do not publish my trade setups here.
Pivot Points

CAD return to par with USD - Wyckoff AccumulationBelow is a fractal of the 2009 great recession paired with wyckoff accumulation, the last time CAD was on par with USD. The trend has accumulated for many years and is finally breaking out due to geopolitical risks and money managers looking for a safe haven with a stable banking system
This may be the end of USD as the world's premier reserve currency, instead becoming one of many forms of reserve due to their weakened financial system and largely, tariffs. The target of this structure is 1.19 CAD: 1 USD, in time the USD may recover if they can address their structural deficits and keep the FED protected, it remains to be seen. For now, international investors continue to dump US dollars for gold and other commodities to bolster the new BRICS exchange currency and more largely, gold.
The next leg up is assumed to be Japan selling USD to buy back Yen in an attempt to strengthen their own weakening economy which is currently freefalling. Treasuries sales come next

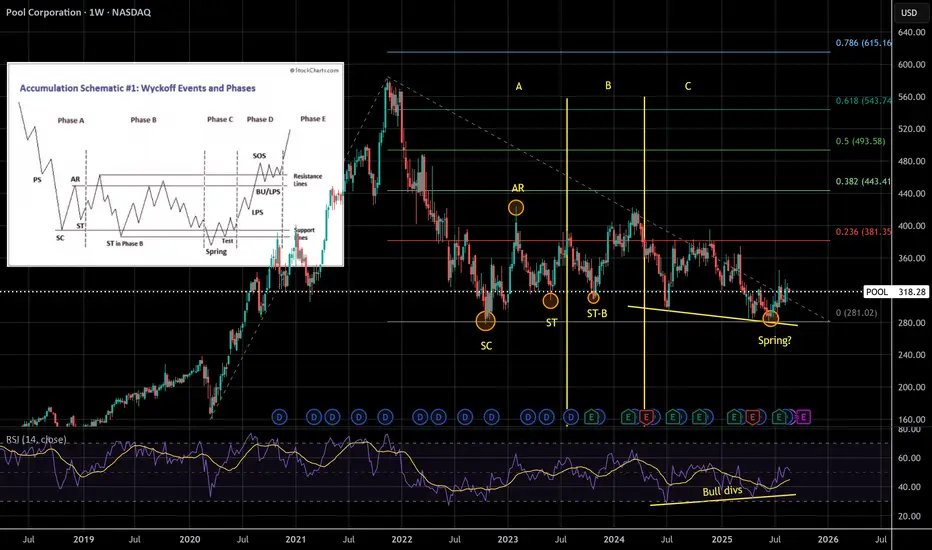
Wyckoff Accumulation Spring + Bullish DivsBullish divs and Wyckoff Accumulation, could this be the spring we're looking for?
Next to watch for is an SOS, sign of strength. A higher high is likely to take this stock to Phase E: The moon
POOL is the largest distributor of pool equipment in the world, essentially a monopoly. They are owned by Berkshire Hathaway.
QNT Main Trend. Triangle. Distribution. January 2026Time frame: 1 week. After a 147,000% pump, a large symmetrical triangle forms in the distribution zone (this is possible due to the limited supply of only 14.88 million coins, and the concentration of the bulk of the volume among the creators). Reversal zones and percentages to key support/resistance levels are shown.

QNT Secondary. Pump 147,000% Distribution. Triangle 01 2026Logarithm. Large triangle in the distribution zone. Price is pinched into a corner. Percentages to key support/resistance levels are shown.
Main trend.

Taking a short position on KAVA (4H)📉 KAVA – Bearish Market Structure & Short Setup Based on Liquidity Concepts
Liquidity pools above the price have been fully swept, indicating a classic liquidity grab on the buy side. Following this move, the market printed a bearish Change of Character (CHoCH), which clearly signals a shift in market structure from bullish to bearish.
After the CHoCH formation, price dropped aggressively with strong momentum and displacement, confirming the presence of smart money and validating the bearish bias. This impulsive move suggests that the market maker has already collected opposite-side (buy-side) orders and is now positioning price lower.
At the moment, sell-side liquidity pools below the chart remain untouched, which increases the probability of further downside continuation. As long as these liquidity levels are not swept, the bearish scenario remains valid and technically sound.
Based on this structure, we can look for sell/short opportunities within the identified order zone / supply area. This zone aligns with smart money concepts and offers a favorable risk-to-reward (R:R) setup.
📍 Entry Strategy (DCA):
We have two potential entry points, and it is recommended to enter the position using a DCA (Dollar Cost Averaging) approach to optimize entry price and manage risk more effectively.
🎯 Targets:
All take-profit targets are clearly marked on the chart, focusing on sell-side liquidity levels and key structure lows.
❌ Invalidation:
This bearish setup will be invalidated if a daily candle closes above the invalidation level. A confirmed daily close above this level would indicate a failure of bearish structure and negate this analysis.
⚠️ Disclaimer:
This analysis is based on Smart Money Concepts (SMC), liquidity theory, and market structure. Always apply proper risk management and wait for confirmation before entering a trade.
If you would like us to analyze a coin or altcoin for you, first like this post, then comment the name of your altcoin below.

FET global trend. Ascending channel. Wedge. AI hype. 01 2026Logarithm. 1-month time frame. Linear chart without market noise. The idea is to visually understand the long-term trend direction of this cryptocurrency. The AI monopolists—giants of the non-cryptocurrency world—are using it.
Medium-term and local.
FET secondary trend. Wedge. Fractals. AI hype. January 2026

FET secondary trend. Wedge. Fractals. AI hype. January 2026Logarithm. 1-week time frame. Classic trading based on reversal zones and the resulting wedge formation.
This zone is in the main trend (entire trading history). 1-month time frame. Suitable for long-term investment for those for whom trading is not their occupation.
FET global trend. Ascending channel. Wedge. AI hype. 01 2026
Markets move according to their market phases:
1) accumulation + sometimes part of it capitulation;
2) participation, that is, a price rise towards distribution;
3) distribution + sometimes part of it super hype;
4) decline, that is, a price drop towards accumulation zones and a repetition of the "golden ring of Baal's calf (Baal)"...
That is, markets move according to the seasonality of the action of large capital “without personal” (supply/demand).

XAUUSD(GOLD): Price is likely to be heading towards $4950! Gold corrected after reaching a record high of $4880. We anticipated further drops but recent geopolitical tensions have disrupted the natural price trend. Consequently, there’s a strong chance the price will move towards the $5000 area.
We’ve set up two entries – one riskier and one safer – so choose the one that suits you best. If you have any questions, feel free to ask in the comments. Your support means a lot.
Thanks,
Team SetupsFX_

ETH (JPMorgan) Global Trend. Channels. Reversal Zones 01 2026Logarithm. 1-month time frame. Linear chart without market noise. This chart is intended to visualize the long-term trend direction of this blockchain for cross-border capital banking structures.
Medium-term and local, from the perspective of the main trend, from this reversal zone, percentages to key support/resistance zones (buyer/seller interest).

BTCUSDT: Bullish Push to 91900?BINANCE:BTCUSDT is eyeing a bullish rebound on the 1-hour chart , with price bouncing from a support zone near cumulative long liquidation, converging with a potential entry area that could trigger upside momentum if buyers defend against further dips. This setup suggests a recovery opportunity after recent pullback, targeting higher resistance levels with more than 1:2.5 risk-reward .🔥
Entry between 88300–88500 for a long position (entry from current price with proper risk management is recommended). Target at 91900 . Set a stop loss at a 4-hour close below 87200 , yielding a risk-reward ratio of more than 1:2.5 . Monitor for confirmation via a bullish candle close above entry with rising volume, leveraging Bitcoin's resilience post-correction.🌟
📝 Trade Setup
🎯 Entry (Long):
88,300 – 88,500
(Entry from current price is valid with strict risk & position sizing.)
🎯 Target:
• 91,900
❌ Stop Loss:
• 4H close below 87,200
⚖️ Risk-to-Reward:
• > 1:2.5
💡 Your take?
Is this a clean liquidity-sweep rebound toward 91,900, or does BTC need deeper consolidation before any meaningful upside? 👇

Apollo Hospital- Short setupQuick summary
Price trading below the EMAs with a prior pivot low recently breached and a visible zone of confluence aligning with daily EMAs. Momentum looks bearish while price remains under EMA21/EMA50 on daily.
Key details
- Structure: Prior pivot low breached; lower highs forming
- Confluence: Zone aligns with daily EMAs — important supply/resistance area
- Bias: Bearish while price stays below the EMAs; bullish invalidation if price reclaims and closes above them
- Treat the confluence zone as a high‑attention area for entries or rejections.
- Use a clearly defined stop and position sizing consistent with your risk rules.
- Look for confirmation (rejection wick, bearish engulfing, or momentum divergence) before committing.
- If price reclaims the EMAs with conviction, reassess bias and avoid shorting into strength.

Kpit Technologies – Short SetupThis chart outlines a potential short setup based on price action and moving average dynamics.
A higher timeframe supply zone is identified near 1220, with price currently trading below both the 21 EMA and 50 EMA indicating bearish momentum.
Setup Highlights:
- Structure Break: Prior pivot low breached, signaling potential trend shift.
- Retest Zone: Area between 21 EMA and 50 EMA may act as rejection zone.
- Stop Loss Reference: SL aligned with 15% of Daily ATR
- Invalidation Criteria: No entry if price dips below 1060 and rebounds.
- Risk-Reward: Target set at 1:3 for disciplined trade management.

Pi Coin Posts Modest Gains as Pi Network Unveils New App Studio Pi Coin price posted modest gains after Pi Network announced new updates to its App Studio, drawing renewed attention from the crypto community. The update highlights the network’s continued focus on building real world utility rather than chasing short term speculation. Market participants viewed the announcement as a positive step toward strengthening the platform’s development infrastructure. This shift helped support a mild but steady improvement in market sentiment.
Investors and users increasingly evaluate blockchain projects based on functionality and adoption potential. Pi Network’s emphasis on application development aligns with this changing mindset. As a result Pi Coin price movements reflected cautious optimism rather than aggressive speculation. This reaction suggests the market now associates Pi with long term ecosystem building rather than hype driven rallies.Pi Network App Studio advances the platform’s utility vision
The updated Pi Network App Studio introduces improved tools designed to simplify decentralized application creation. These enhancements allow developers to design deploy and manage apps more efficiently. The studio also lowers technical barriers making it easier for a broader range of creators to participate. This approach supports inclusive development across diverse markets.
Pi Network App Studio focuses on practical use cases including commerce education and local digital services. Applications built through the studio aim to encourage daily user interaction. This strategy strengthens internal activity while reinforcing the platform’s real world relevance. Over time such engagement supports organic Pi ecosystem growth.
Pi Coin price reflects controlled market optimism
Following the announcement Pi Coin price showed a gradual upward move without sharp volatility. This controlled reaction suggests growing market maturity around the project. Investors appear to respond more to development milestones than short lived excitement. Such behavior often indicates strengthening confidence in project fundamentals.
Traders observed increased community discussion and engagement after the update. Positive sentiment can support price stability when backed by tangible progress. However market participants remain cautious while waiting for broader application adoption. This balance keeps Pi Coin price movements steady and measured.
Developer focused upgrades strengthen Pi ecosystem growth
The new App Studio features emphasize scalability flexibility and faster development cycles. Developers can prototype applications more efficiently using modular components. This capability encourages experimentation while reducing development risks. As more builders participate the network gains diversity in application offerings.
An expanding app ecosystem plays a vital role in Pi ecosystem growth. Increased application variety drives user engagement and network activity. This dynamic supports token circulation within practical economic loops. Healthy circulation often aligns with stable Pi Coin price behavior.
Ecosystems grow strongest when creators and users interact seamlessly. Pi Network’s emphasis on developer empowerment strengthens this connection. This strategy differentiates the platform from speculation centered blockchain projects.
Community response highlights growing confidence in Pi Network
The Pi community reacted actively to the App Studio update through discussions and feedback. Many users shared ideas for applications focused on local services and peer to peer commerce. This engagement demonstrates confidence in the platform’s direction. Community driven innovation remains a core pillar of Pi Network’s strategy.
Pi ecosystem growth depends heavily on user participation and creator collaboration. By offering accessible tools Pi Network encourages broader involvement. This shift transforms passive holders into active contributors. Active participation strengthens long term network resilience.
What the next phase could mean for Pi Coin
The next stage for Pi Network centers on application launches and real usage data. Continued improvements to Pi Network App Studio may attract more developers. Each successful app strengthens user retention and network activity. This cycle supports sustainable ecosystem expansion.
Pi Coin price may continue reflecting gradual progress instead of sharp movements. This pattern aligns with utility driven valuation models. Investors now watch execution metrics more closely than speculative signals. Performance over coming months will shape broader market confidence.

LTC global trend. Ascending channel. Triangle. January 2026Logarithm. 1-month time frame. Linear chart without market noise. Designed for visual understanding of long-term trend direction.

HBAR global trend. Ascending channel. Triangle. January 2026Logarithm. 1-month time frame. Linear chart without market noise. Designed for visual understanding of long-term trend direction.

Nifty Analysis EOD – January 23, 2026 – Friday🟢 Nifty Analysis EOD – January 23, 2026 – Friday 🔴
106-Day Support Snaps: Bears Breach the Gate ?
🗞 Nifty Summary
The Nifty started with a mild 27-point Gap Up, entering a high-voltage battle zone between 25,250 ~ 25,350. This 100-point range saw wild intraday swings that trapped both sides before a clear direction emerged.
At 11:35 AM, the bulls finally gave up, leading to a decisive IB Low breakout. The bearish sentiment accelerated as the PDL (Previous Day Low) was breached at 1:15 PM.
Despite a brief attempt to hold the 25,180 level, the index plummeted to its “last resort” support of 25,060, closing the session at 25,048.65 (-0.95%). This marks the lowest close in 72 sessions (106 days), dragging the index back to levels last seen on October 8, 2025.
🛡 5 Min Intraday Chart with Levels
🛡 Intraday Walk
Today was a session of systematic distribution.
The morning’s 100-point “tug-of-war” served as a distribution phase before the floodgates opened. Once the 25,250 floor was lost, the slide was relentless.
The most significant technical event was the daily close below the channel’s bottom band. While the Jan 21 low of 24,920 still stands as the final line of defense, today’s close has significantly weakened the reversal thesis, shifting the focus toward a potential bearish continuation.
📉 Daily Time Frame Chart with Intraday Levels
🕯 Daily Candle Breakdown
Open: 25,344.60
High: 25,347.95
Low: 25,025.30
Close: 25,048.65
Change: -241.25 (-0.95%)
🏗️ Structure Breakdown
Type: Strong Bearish candle (Marubozu-style).
Range: ≈ 323 points — High intraday volatility.
Body: ≈ 296 points — Aggressive, unchecked selling pressure.
Upper Wick: ≈ 3 points — Absolute lack of buying strength at the open.
Lower Wick: ≈ 23 points — Minimal demand even at the extreme lows.
📚 Interpretation
This is a high-conviction Bearish Breakdown candle. Opening at the day’s high and closing near the day’s low suggests that the market is in a “Sell on Rise” mode. The breach of the 106-day closing low indicates that the medium-term trend has been severely damaged, and the previous recovery attempts are being invalidated.
🕯 Candle Type
Bearish Marubozu-Style / Breakdown Candle — Signals powerful downside momentum; further weakness is expected unless the index reclaims the channel bottom immediately.
🛡 5 Min Intraday Chart
⚔️ Gladiator Strategy Update
ATR: 256.30
IB Range: 98.85 → Medium
Market Structure: Balanced
Trade Highlights:
10:18 Long Trade: SL Hit (Caught in the morning battle whipsaw).
11:38 Short Trade: Target Hit (R:R 1:1.73) (IBL Breakout).
13:16 Short Trade: Target Hit (R:R 1:3.03) (PDL Breakout).
Trade Summary: A disciplined performance despite the early stop-loss. The strategy correctly pivoted to the short side as the balance shifted. The PDL breakout trade was the star of the session, capturing the vertical drop to the 25,060 support zone with a strong 1:3.03 R:R.
🧱 Support & Resistance Levels
Resistance Zones:
25180
25270
25310 ~ 25335
25430
Support Zones:
25025 ~ 25000
24970
24920 (Critical Floor)
24840
24770 ~ 24740
🧠 Final Thoughts
“The 24,920 level is now the only shield left.”
The daily close below the channel is a major red flag.
If the 24,920 low is breached in the upcoming sessions, the bullish reversal sign from January 21 will be completely negated.
At that point, the structure will confirm a bearish continuation with targets shifting toward the 24,600 ~ 24,400 zone. Until then, expect the bears to maintain their grip, using every minor bounce as a supply window.
✏️ Disclaimer
This is just my personal viewpoint. Always consult your financial advisor before taking any action.

Gold BuysGold created a new ATH once again coming into today and during the Asia session.
With a strong bullish push yesterday, we are potentially going to see a continuation. The bias is bullish and with price creating a HL during London, will be looking for a retest of the London exhaustion area, to catch a buy to the ATH.
Potential for a 1:5 RR, however with it being Friday, will keep it low risk to a 1:3.

TRX Global Trend Channel Rising Wedge. January 2026Logarithm. 1-month time frame. Linear chart without market noise. Designed for visual understanding of long-term trend direction.

XRP Global Trend. Ascending Channel. Triangle. January 2026Logarithm. 1-month time frame. Linear chart without market noise. Designed for visual understanding of long-term trend direction.

XLM global trend. Ascending channel. Triangle. January 2026Logarithm. 1-month time frame. Linear chart without market noise. Designed for visual understanding of long-term trend direction.

GBPAUD: Another Bullish Confirmation 🇬🇧🇦🇺
GBPAUD leaves another bullish clue this morning,
after the release of the UK Retail Sales data.
The price formed a high momentum bullish candle
and violated a resistance line of a falling wedge.
Goal remains intact - 1.982
❤️Please, support my work with like, thank you!❤️
I am part of Trade Nation's Influencer program and receive a monthly fee for using their TradingView charts in my analysis.

CRV is now in a bearish structure (4H)CRV has lost a key mid-term trendline and is currently trading below this important dynamic support. Earlier, it also formed a bearish CH (change of character) and established bearish market structure, confirming that sellers are in control.
For a short entry, we must avoid FOMO and wait for a pullback to a strong supply zone before taking any position.
This is not a rush situation; the market often retraces to the supply areas before continuing its bearish momentum.
✅ Entry Strategy (DCA)
We have two entry zones, and we should enter the short position using DCA (Dollar Cost Averaging) to reduce risk and improve the average entry price.
🎯 Targets & Risk Management
Targets are clearly marked on the chart.
At the first target, it is recommended to take partial profit and then move the stop loss to break-even.
If you are risk-averse, exiting at the first target is a valid option.
⚠️ Invalidating Condition
If a daily candle closes above the invalidation level, this bearish analysis will be invalidated, and the trade setup will no longer be valid.
If you would like us to analyze a coin or altcoin for you, first like this post, then comment the name of your altcoin below.
