GreenBayChart 7 Crypto Assets That Will Deliver by the End 2025We just completed the deepest on-chain analysis of November 2025.
Over the last 14 days we processed 4.7 million wallets, 38 billion transactions, and 184 metrics from Glassnode, Nansen, Santiment, and our own full nodes.
The result: 7 assets that are currently seeing the most aggressive whale accumulation, minimal seller pressure, and confirmed catalysts for 2026.
Top 7 by GreenBayChart (ranked by expected return to 31 Dec 2026)
Sui (SUI) — expected ×8–×12
Current price: $2.84
2026 targets: $24–34
On-chain picture:
Whales (>100 k $) +41 % accumulation in 60 days (Nansen)
Active addresses +390 % YTD
TVL +410 % in 2025 → 3rd place among L1s
Catalysts: Mysticeti consensus (Q1 2026), SuiPlay handheld (Q2), Google Cloud partnership already confirmed.
Sei (SEI) — ×7–×10
Current price: $0.68
2026 targets: $5.20–7.80
#1 GitHub dev growth in 2025 (+680 %)
10 k–100 k SEI wallets +68 % accumulation in Oct–Nov
Parallel EVM v2 already in testnet → 30 000 real TPS in Q1 2026
Hyperliquid (HYPE) — ×6–×9
Current price: $28.40
2026 targets: $180–260
#1 perpetual DEX by volume in November (surpassed GMX and dYdX)
Own Cosmos SDK L1 already live
Whales +54 % token accumulation in 45 days (Santiment)
TVL $2.4 bn and growing +19 % weekly
Ondo Finance (ONDO) — ×5–×8
Current price: $1.42
2026 targets: $7.80–11.50
2025 RWA leader: tokenized treasuries + BlackRock BUIDL integration
$680 m inflows into Ondo products in Oct–Nov
Coinbase & Kraken listings in December 2025
Render (RNDR) — ×4–×7
Current price: $9.10
2026 targets: $42–68
Explosive GPU demand after Grok-2 and Apple Intelligence launches
Burn mechanism already burned 4.8 % of supply in 90 days
Whales +38 % accumulation in last 60 days
Chainlink (LINK) — ×4–×6
Current price: $18.80
2026 targets: $78–110
CCIP live on 12 chains, Swift & DTCC in production
Institutional wallets (>1 m LINK) +31 % this quarter
Lowest seller pressure among top-20 infrastructure tokens
Solana (SOL) — ×3–×5 (the “safest” ×3+ in the list)
Current price: $182
2026 targets: $620–920
Firedancer mainnet December 2025 → 65 000+ TPS
TVL +310 % YTD, ecosystem inflows +$2.1 bn in 60 days
Whales >100 k SOL net bought +420 k SOL in November
Exact Entry Levels Right Now (GreenBayChart, 18 Nov 2025)
AssetAccumulation ZoneStop-LossFirst Target (2025)Final Target (2026)SUI$2.70–2.92$2.48$5.80$24–34SEI$0.64–0.71$0.59$1.80$5.20–7.80HYPE$26–29$24$58$180–260ONDO$1.35–1.48$1.28$2.80$7.80–11.50RNDR$8.80–9.40$8.20$16$42–68LINK$18.20–19.50$17.20$34$78–110SOL$178–188$168$280$620–920
Why exactly these 7 (and not hundreds of others)
Whale accumulation >30 % in 60 days (all 7 in the top 15 by this metric)
Minimal seller pressure (MVRV Z-Score <1.8 across the board)
TVL & active addresses growing at least +180 % YTD
Confirmed 2026 catalysts (upgrades, listings, partnerships)
No major unlocks until end of 2026 (except SOL – already priced in)
Final Word from GreenBayChart
The November correction is the last major accumulation point before the final phase of the 2025–2026 cycle.
Anyone who calmly builds positions in these 7 assets at current prices will capture the highest returns of the entire cycle.
The full report with charts, live on-chain dashboards, and exact entry levels is already available in the GreenBayChart Pro private channel.
Pivot Points

Gelaxy IG 2025: Crypto Visa Card + One-Click TokenizationNovember 2025 has proven that cryptocurrency is no longer just “digital gold” for HODLers.
While Bitcoin was dropping below $96,000, stablecoins USDT and USDC grew 11 % in issuance volume in just 30 days, and tokenized real-world assets (RWA) attracted a record $640 million in October–November alone.
This is not a coincidence. It’s a signal: crypto is finally becoming real working capital.
Gelaxy IG is launching the solution that makes your crypto truly alive:
Spend BTC, ETH, USDT and 1,300+ other coins anywhere in the world with a regular Visa/Mastercard
Tokenize any investment position (Forex, stocks, bonds, ETFs) into an ERC-20 token and get instant liquidity without closing the underlying trade
What is Gelaxy IG and why we launched right now
Gelaxy IG is a next-generation fintech platform that connects three worlds:
Crypto wallet with direct Visa/Mastercard integration (130+ countries, 40+ million acceptance points)
Tokenization of any investment position into ERC-20
Instant liquidity without selling the base asset
Key figures as of 18 November 2025:
1,300+ supported assets for payments
User-tokenized position volume already at $180 million
Average time from “I need cash” to “money on card” — 42 seconds
Partnerships with 8 major card issuers and 4 blockchains (Ethereum, Polygon, Solana, Arbitrum)
How it works — two real November 2025 scenarios
Scenario 1. Paying for coffee in Paris with BTC — without selling
You have 0.42 BTC in your Gel − wallet.
Go to a café → tap your Gelaxy Visa card → pay €18.
The system automatically issues a collateralized loan against your BTC at 65 % LTV → money is debited → your BTC stays with you and keeps growing.
Scenario 2. Tokenization and instant liquidity on a Forex position
You have a $250,000 EUR/USD long with ×10 leverage, currently +$18,400 in profit.
Instead of closing, you hit “Tokenize” → the position becomes token gEURUSD-2511 → you sell 40 % of the tokens on the built-in DEX → receive $7,360 in USDT in 18 seconds, without closing the trade or triggering a tax event.
Why this became possible only in 2025
Regulators gave the green light (OCC USA, MiCA EU, Singapore, UAE) — stablecoins and tokenized assets are now treated as regular money
Institutions are already here: BlackRock BUIDL $640 m, Ondo $1.1 bn TVL
Retail is simply following
Gelaxy IG advantages
Spend crypto everywhere Visa/Mastercard is accepted — no sale, no tax event
Tokenize any position and get cash in seconds
Earn up to +15 % extra: staking rewards + 1–3 % cashback on every card purchase
Full compatibility with MetaMask, Ledger, Trust Wallet
0 % conversion fee inside the platform until 31 December 2025
Roadmap 2026
Q1 — tokenization of real stocks (Apple, Tesla, Nvidia)
Q2 — Apple Pay & Google Pay integration
Q3 — own gUSD stablecoin with 6–9 % APY
Get started now
Conclusion — why Gelaxy IG changes the game
2025 has finally erased the line between “crypto” and “real money”.
Gelaxy IG is not just another card and not just another wallet.
It’s a tool that turns your investment capital into real, spendable money — right here, right now — without selling, without waiting, without compromise.
While others wait for the “next bull run”, Gelaxy IG users are already living it:
paying with crypto for dinner
pulling profit from a Forex trade without closing it
earning cashback and staking rewards every single day
Gelaxy IG democratizes investing: anyone with $500 in crypto now has access to advantages that just a year ago were reserved for hedge funds and family offices.
Your crypto no longer has to sit idle.
It has to work — 24 hours a day, 7 days a week.
Gelaxy IG — your capital works while you live.
BTCUSDTHi
CRYPTOCAP:BTC is correction from ATH but if couldn't keep level (110.000$) we see more downtrend and I think deep bear-trend to 80.000$.

Bitcoin at 83K: Hold the Line or Freefall to 75K?Bitcoin Analysis – Testing Key Support With Bearish Momentum Increasing
Bitcoin continues to break supports aggressively, raising the possibility of revisiting the 75,000 zone. Price is currently sitting on a major support at 83,000, a level that has held multiple times in previous corrections. This area will determine whether BTC stabilizes or continues its decline.
From a technical perspective, BTC is showing:
Clear lower highs and lower lows, confirming a bearish structure.
Strong bearish candles breaking through intermediate supports with conviction.
A lack of liquidity zones between 83,000 and 75,000, meaning that if 83K fails, price can drop quickly.
Oversold signals starting to appear on lower timeframes, increasing the probability of short-term consolidation.
On the fundamental side, several key elements are weighing on BTC:
Risk-off sentiment in global markets as equities correct and the U.S. dollar strengthens.
ETF outflows over the past days, showing reduced institutional demand.
Miners increasing selling, likely due to profitability pressure post-halving.
Lower liquidity in crypto markets heading into the weekend, making sharp moves more likely.
If Bitcoin holds 83,000, we may see a sideways consolidation before attempting a rebound. But if this level breaks, the path toward 75,000 is wide open, with no major support blocking the move.

1INCH Analysis (2H)The internal trendline has been broken and the structure is bearish. Below the current price, there is an important support level that has been tested multiple times, and lower highs have formed, indicating selling pressure.
The targets are marked on the chart.
A daily candle closing above the invalidation level will invalidate this analysis.
Do not enter the position without capital management and stop setting
Comment if you have any questions
thank you

APT is Bearish (4H)It has a bearish structure. We have an iCH (liquidity grab / mitigation) on the chart, the overall power is bearish, and price is trading below a resistance line. Recently, a base has also broken to the downside, and all signs indicate a bearish outlook.
We can enter a sell/short position once the stop-loss (invalidation level) is tapped, targeting the levels marked on the chart.
Do not enter the position without capital management and stop setting
Comment if you have any questions
thank you

CRUDE OIL (WTI): Bullish Move After Trap
There is a high chance that Crude Oil will pull back
from the underlined daily key level.
I see a confirmed bear trap followed by a bullish imbalance
candle on an hourly.
I expect a rise at least to 58.51 level.
❤️Please, support my work with like, thank you!❤️
I am part of Trade Nation's Influencer program and receive a monthly fee for using their TradingView charts in my analysis.

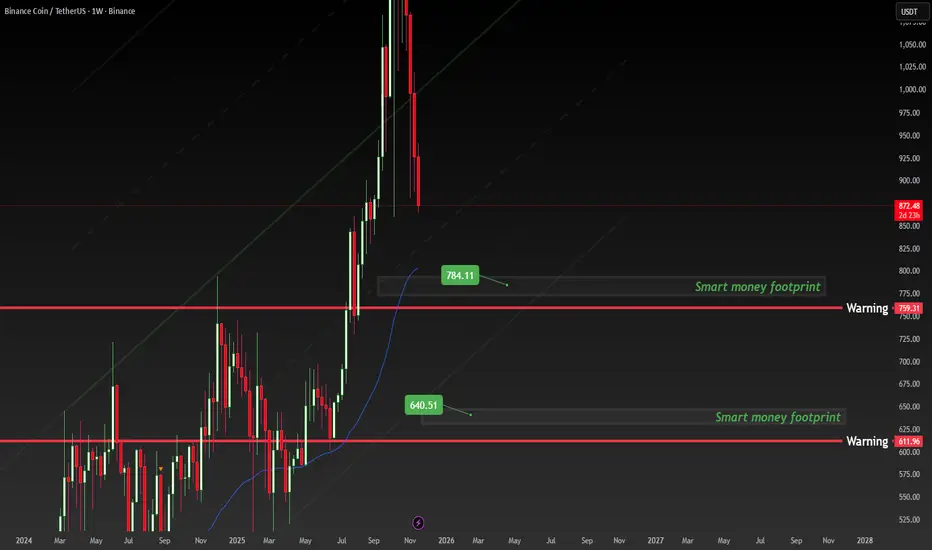
BNB ABOUT TO EXPLODE 300%BNB ABOUT TO EXPLODE 300%?! Smart Money Already Loading at $784 & $640 – Don’t Miss the Next Leg Up! 🚀
This is the EXACT footprint I’ve been waiting for on BNB/USDT weekly timeframe!
Smart money accumulated heavily at $640 and now defending the $784 zone like their life depends on it. Exactly the same pattern that launched us from $17 → $690 in 2021. History is literally repeating in front of our eyes!
Every time BNB holds these “Smart Money Footprint” levels, we see minimum 3-5x moves. The weekly chart is screaming “accumulation phase over” – next stop $2,000+ in this cycle!
Who else is stacking BNB right now? 👇
Tag your crew and let’s make this moon together!
Shoutout to the BNB gods on TradingView:
@CryptoCred @CryptoWolfSignal @TheCryptoDog @Trader_XO @DonAlt @CryptoNewton @WiseAnalyze @Alanmasters – what do you guys think, is $2,000 incoming this cycle? 👀
Drop a 🚀 if you’re loading BNB under $800
Save this chart – you’ll thank me at $2,000+
#BNB #BinanceCoin #Crypto #Altseason #1000x
AUD/JPY: Exhaustion at The High?AUD/JPY briefly traded at a 16-month high on Thursday before reversing lower. At current levels it’s on track to form a spinning-top doji on the weekly chart, and it has already printed a shooting-star candle on the daily at the November high and monthly S1 pivot.
Given the multi-week bearish RSI divergence and false breakout at the highs, the bias is for some mean reversion towards at least the 20-day EMA. The 100 handle and 50-day EMA near the January high also make viable downside targets for bears, should the yen enjoy a bout of risk-on strength.
Matt Simpson, Market Analyst at City Index.

Ethereum Falls Under $2,800 — A 44% Drawdown From the Highs📉 Ethereum ( BINANCE:ETHUSDT ) has officially broken below the $2,800 level, a major structural zone that has acted as both strong support and resistance in multiple past cycles.
🔻 The drop now totals -44% from the all-time highs, pushing price back into an area where long-term buyers previously stepped in aggressively.
📊 The weekly RSI sits near 40, historically a region that has offered short-term relief and attractive asymmetric setups.
🧭 From a risk-reward standpoint, this remains an interesting zone for gradual accumulation, especially as sentiment turns increasingly bearish.
💡 In markets, the best opportunities tend to appear when nobody wants the asset.

$BTC spot planBuying Bitcoin in purple box. Think 86k area will act as a good support. This is not a leverage trade. I am buying this spot so I can adjust my stoploss later if I want to.


MSTR chart update. Bounce to $266-315 before more downside?Updating the prior chart as the levels I had were off. I think it's likely that we bounce from this level.
You can see we've now hit a key support and filled a gap that was on the chart at $176. I think it's likely that we see a strong bounce from this level.
Reasons being:
1. We're at a key support
2. 3 touches of bottom of flag, usually 4th one breaks it, 3rd creates a powerful move in the opposite direction
3. Strong call flow on MSTR the past few days
I think it's likely we bounce up to the $266 or 315 resistance levels. This is a trade, not a long term position to hold.
Let's see if it plays out. Breaking this level as lower support will open up the possibility to see lower levels.

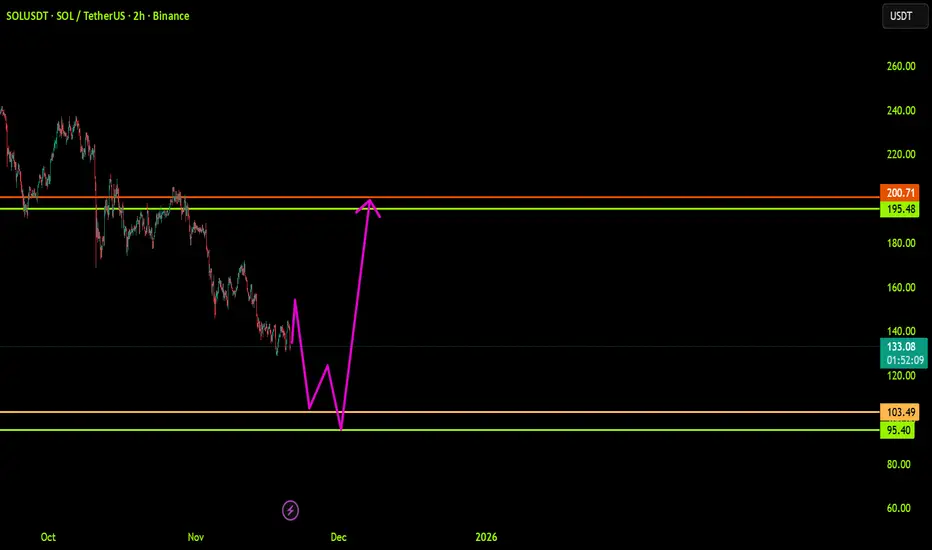
SOLUSDT: Trend in 2-H time frameThe color levels are very accurate levels of support and resistance in different time frames.
A strong move requires a correction to major support and we have to wait for their reaction in these areas.
So, Please pay special attention to the accurate trends, colored levels, and you must know that SETUP is very sensitive.
BEST,
MT
BtcusdtI think Bitcoin will bounce from the 77-80K range and touch a new high in the 140K range.
If the 77K range breaks downwards, we should wait for the 60K range.

BITCOIN ON MOUNTLYHello everyone,
I’ve been reviewing Bitcoin on the monthly timeframe and analyzing its local lows, and the results turned out to be quite interesting. Since the major correction in December 2017, Bitcoin has shown recurring corrective structures on this timeframe. When measuring the drawdowns from cycle tops, we typically see corrections in the 70–80% range. Also, before each major downturn, the price tends to form two local lows, with the second one usually providing traders a final opportunity to exit.
This year, based on both historical behaviour and current market dynamics, we’re seeing a similar pattern develop. Considering these factors, I expect the market to remain bearish for at least the next nine months. I see the current potential bottom near $58,800, and if this level breaks, the maximum correction could bring Bitcoin down into the $29–33K range.
On the upside, the $93–102K zone remains, in my view, the most favorable range for exiting the market.
Wishing you all success.

$ZEN Long planAfter my previous LSE:ZEN post where I shared that $16.40 flip is key for ZEN if it wants to go higher. Which failed on 4h tmf to stay above the price. Now again its interesting for me. In a hour if we get the daily close above the purple line $16.40 area, where we get a retest I will go long.


SPX 500: Bullish Rebound to 6760?FX:SPX500 is priming for a bullish rebound on the 4-hour chart , where price has pulled back to a critical support zone following a sharp decline, forming a potential bounce setup amid a broader uptrend—highlighted by the rebound pattern near key levels that could ignite buying if buyers defend against further downside. This confluence at the support offers a high-reward long opportunity in the index's volatile range.
Entry zone between 6530-6550 for a buy position. Target at 6760 🎯near the resistance zone, delivering a risk-reward ratio greater than 1:4 .Set a stop loss on a close below 6500 📊 to manage risk effectively. Watch for confirmation via a strong bullish candle with rising volume above the entry, capitalizing on the index's resilience despite recent pressures🌟.
Fundamentally , the S&P 500 closed at around 6646.7 on November 19, 2025, down over 2% in November amid economic concerns and high valuations, particularly in AI stocks, with the index dipping below its 50-day moving average for the first time since April—yet historical patterns suggest a median 15% upside to 7710 over the next year if it follows median rebounds. Earnings growth remains robust at 16.9% YoY, beating estimates, supporting potential recovery despite tariff worries. 💡
📝 Trade Setup
🎯 Entry Zone (Buy): 6530 – 6550
🎯 Target:
• TP: 6760 (major resistance)
❌ Stop Loss: Close below 6500
⚖️ Risk-to-Reward: Greater than 1:4
What's your outlook on this rebound? Drop your thoughts below! 👇

Nifty Analysis EOD – November 20, 2025 – Thursday🟢 Nifty Analysis EOD – November 20, 2025 – Thursday 🔴
Bullish Extension Continues, Nifty Just 29 Points Away from All-Time High!
🗞 Nifty Summary
The Nifty opened with an 83-point Gap Up, confidently trading above the Previous Day’s High (PDH). The initial few minutes saw the gap fill, finding solid support exactly at the PDH level.
The index then consolidated for about 90 minutes near the CDH + IBH, forming a narrow 20-25 point range. Following this pause, Nifty resumed its upward march with steady “baby steps,” successfully breaching the crucial 26220 resistance level and marking the day’s high at 26,246.65. Although unable to sustain above 26220, leading to a sharp, volatile slip back, the index closed strongly at 26,192.15, adding +139.50 points (+0.54%) from the previous day’s close.
This was a clear bullish extension day, achieving the targets aimed for yesterday, though the lack of participation from small-cap and mid-cap segments remains a point of caution. We are now merely 29 points away from marking a new All-Time High (ATH).
🛡 5 Min Intraday Chart with Levels
🛡 Intraday Walk
The session was defined by an initial deep gap-up, followed by the gap-fill and strong defense of the PDH, confirming the bullish bias.
The mid-session consolidation was a low-volume affair, acting as a spring for the second leg of the upward rally.
The move through 26220 was aggressive, but the quick rejection from the high indicated strong supply at the historical peak levels.
The final closing level, however, remains robust, signaling that overall control is with the buyers, and the primary objective is the ATH.
📉 Daily Time Frame Chart with Intraday Levels
🕯 Daily Candle Breakdown
Open: 26,132.10
High: 26,246.65
Low: 26,063.20
Close: 26,192.15
Change: +139.50 (+0.54%)
🏗️ Structure Breakdown
Type: Bullish candle.
Range (High–Low): ≈ 183 points — healthy, broad intraday movement.
Body: ≈ 60 points — showing controlled but steady bullish strength.
Upper Wick: ≈ 54 points — indicating profit-booking or resistance near the 26220 high.
Lower Wick: ≈ 69 points — strong buying from lower levels, confirming demand on dips.
📚 Interpretation
The strong opening and consistent follow-through buying throughout the day confirm the prevailing bullish trend. Although the upper wick is substantial, reflecting the failure to sustain the breakout above 26220, the close is well above the open and previous major resistance levels. This indicates that while bears defended the immediate high, they were unable to shift the overall market structure.
🕯 Candle Type
Bullish Candle with Both-Side Wicks (Buyers Dominant) — This is a strong continuation signal, confirming the control of the bulls despite minor overhead resistance.
🛡 5 Min Intraday Chart
⚔️ Gladiator Strategy Update
ATR: 196.67
IB Range: 72.8 → Medium
Market Structure: ImBalanced
Trade Highlights:
10:05 Long Trade - Target Hit (R:R 1:3.13)
12:24 Long Trade - Target Hit (R:R 1:3.96)
Trade Summary: The strategy performed exceptionally well today, capitalising on the clear directional moves after the initial range-bound phase. The two high R:R long trades captured the core bullish extension of the day.
🧱 Support & Resistance Levels
Resistance Zones:
26220 (Immediate Resistance)
26277 (All-Time High)
Support Zones:
26135 (Gap Fill Zone)
26104 ~ 26075 (Critical Intraday Support)
26063 ~ 26040
26000 (Psychological Support)
25950 ~ 25940
🧠 Final Thoughts
“The final frontier is 26,277.”
The market is in clear bullish territory, with all major resistance levels below 26220 successfully converted into support. The primary focus for the next session is the All-Time High at 26,277.
A decisive breach and close above this level will trigger strong momentum. If the market fails to breach the ATH, we may see a slight correction toward the 26135 support zone before the next attempt.
Traders must remain mindful that non-participation from the broader market (mid/small-caps) could eventually lead to market breadth deterioration.
✏️ Disclaimer
This is just my personal viewpoint. Always consult your financial advisor before taking any action.

HBAR Sell/Short Signal (1H)The price seems to have reached a strong level that contains a lot of orders and has also shifted to a bearish structure.
Our last valid order block is the red zone | if the price reaches it, it will be a sell/short opportunity.
We have two targets marked on the chart, offering a 1:2 risk-to-reward ratio.
Let’s wait and see what happens next.
For risk management, please don't forget stop loss and capital management
When we reach the first target, save some profit and then change the stop to entry
Comment if you have any questions
Thank You

SIGN Analysis (4H)We currently have strong bullish momentum on the chart, and we already had a bullish CH as well as two bullish BOS signals. The price has also been consolidating in a favorable area for some time, and bearish momentum has nearly dropped to zero.
We will wait for the price to return to the marked demand zone, and within that area we will look to open a buy/long position with proper capital management and risk control.
The targets have been marked on the chart.
A 4-hour candle closing below the invalidation level will invalidate this analysis.
Do not enter the position without capital management and stop setting
Comment if you have any questions
thank you

Pricol Ltd - Cup & HandlePricol Ltd
Sales - QoQ - 12.5%, YoY - 50.5%
Net Profit - QoQ - 28%, YoY - 42.2%
2 good quarters. Valuations are good among the peers. 35% potential. 548-556 is good range to enter or above 600 with SL 522. Cup and Handle breakout. Good volume. Pivot, Fib, cup targets are in chart.
