Future of Gold (XAUUSD)Gold Forecast. Historical data present in Related Idea Below. March 24-June 2014. Daily Chart
Probability


Test and Retest. It may or may not happened. rule of ProbabilityHi guys today will be trading in 15 mins Time Frame. higher Time frame 1hr. This is a trade for short Term Traders. I saw that it is tested in the lower timeframe(trading timeframe) that the sellers failed again bringing me to the conclusion to buy. This will or may not happened


Trend Trading. Follow the trend to long. Good Risk-Reward.Based on TA charting, simply follow the trend to enter a long position.
Good risk-reward.
Trade Safe.

5 Fundamental Truths of Trading:1. Anything can happen.
Why? Because there are always unknown forces operating in every market at every moment , it takes only one trader somewhere in the world to negate the positive outcome of your edge. That's all: only one. Regardless of how much time, effort, or money you've invested in your analysis, from the market's perspective there are no exceptions to this truth. Any exceptions that may exist in your mind will be a source of conflict and potentially cause you to perceive market information as threatening.
2. You don't need to know what is going to happen next in order to make money.
Why? Because there is a random distribution between wins and losses for any given set of variables that define an edge. (See number 3.) In other words, based on the past performance of your edge, you may know that out of the next 20 trades, 12 will be winners and 8 will be losers. What you don't know is the sequence of wins and losses or how much money the market is going to make available on the winning trades.
This truth makes trading a probability or numbers game.
3. There is a random distribution between wins and losses for any given set of variables that define an edge
If every loss puts you that much closer to a win, you will be looking forward to the next occurrence of your edge, ready and waiting to jump in without the slightest reservation or hesitation. On the other hand, if you still believe that trading is about analysis or about being right, then after a loss you will anticipate the occurrence of your next edge with trepidation, wondering if it's going to work. This, in turn, will cause you to start gathering evidence for or against the trade, so you will not be in the most conducive state of mind to produce consistent results .
4. An edge is nothing more than an indication of a higher probability of one thing happening over another.
Creating consistency requires that you completely accept that trading isn't about hoping, wondering, or gathering evidence one way or the other to determine if the next trade is going to work. The only evidence you need to gather is whether the variables you use to define an edge are present at any given moment. When you use "other" information, outside the parameters of your edge to decide whether you will take the trade, you are adding random variables to your trading regime. Adding random variables makes it extremely difficult, if not impossible, to determine what works and what doesn't.
Gathering "other" evidence makes about as much sense as trying to determine whether the next flip of a coin will be heads, after the last ten flips came up tails. Regardless of what evidence you find to support heads coming up, there is still a 50-percent chance that the next flip will come up tails.
If the market is offering you a legitimate edge,determine the risk and take the trade .
5. Every moment in the market is unique.
Take a moment and think about the concept of uniqueness. No two moments in the external environment will ever exactly duplicate themselves . To do so,every atom or every molecule would have to be in the exact same position they were in some previous moment. Not a very likely possibility.
Source: Mark Douglas - Trading in the zone

MaMA : Momentum adjusted Moving AverageA brand new Moving Average , calculated using Momentum, Acceleration and Probability (Psychological Effect).
Momentum adjusted Moving Average( MaMA ) is an indicator that measures Price Action by taking into consideration not only Price movements but also its Momentum, Acceleration and Probability. MaMA , provides faster responses comparing to the regular Moving Average
Here is the math of the MaMA idea
Momentum measures change in price over a specified time period
momentum = source – source(length)
where,
source, indicates current bar’s price value
source(length), indicates historical price value of length bars earlier
Lets play with this formula and rewrite it by moving source(length) to other side of the equation
source = source(length) + momentum
to avoid confusion let’s call the source that we aim to predict as adjustedSource
adjustedSource = source(length) + momentum
looks nice the next value of source simply can be calculated by summing of historical value of the source value and value of the momentum. I wish it was so easy, the formula holds true only when the momentum is conserved/constant/steady but momentum move up or down with the price fluctuations (accelerating or decelerating)
Let’s add acceleration effects on our formula, where acceleration is change in momentum for a given length. Then the formula will become as (skipped proof part of acceleration effects, you may google for further details)
adjustedSource = source(length) + momentum + 1/2 * acceleration
here again the formula holds true when the acceleration is constant and once again it is not the case for trading, acceleration also changes with the price fluctuations
Then, how we can benefit from all of this, it has value yet requires additional approaches for better outcome
Let’s simulate behaviour with some predictive approach such as using probability (also known as psychological effect), where probability is a measure for calculating the chances or the possibilities of the occurrence of a random event. As stated earlier above momentum and acceleration are changing with the price fluctuations, by using the probability approach we can add a predictive skill to determine the likelihood of momentum and acceleration changes (remember it is a predictive approach). With this approach, our equations can be expresses as follows
adjustedSource = source(length) + momentum * probability
adjustedSource = source(length) + ( momentum + 1/2 * acceleration ) * probability , with acceleration effect
Finally, we plot MaMA with the new predicted source adjustedSource, applying acceleration effect is made settable by the used from the dialog box, default value is true.
What to look for:
• Trend Identification
• Support and Resistance
• Price Crossovers
Recommended settings are applied as default settings, if you wish to change the length of the MaMA then you should also adjust length of Momentum (and/or Probability). For example for faster moving average such as 21 period it would be suggested to set momentum length to 13
Alternative usage, set moving average length to 1 and keep rest lengths with default values, it will produce a predictive price line based on momentum and probability. Experience acceleration factor by enabling and disabling it
Conclusion
MaMA provide an added level of confidence to a trading strategy and yet it is important to always be aware that it implements a predictive approach in a chaotic market use with caution just like with any indicator
Trading success is all about following your trading strategy and the indicators should fit within your trading strategy, and not to be traded upon solely
Disclaimer : The script is for informational and educational purposes only. Use of the script does not constitutes professional and/or financial advice. You alone the sole responsibility of evaluating the script output and risks associated with the use of the script. In exchange for using the script, you agree not to hold dgtrd TradingView user liable for any possible claim for damages arising from any decision you make based on use of the script

report by technical analystReport dispalyed with Technical Analyst study
Who wants a Technical Analyst?
The analyst will present a technical anlaysis report at a glance calculated by the most popular technical indicators, and the good part, the anlayst will do it voluntarily
technical skills of the analyst:
- experienced an all markets
- ability to interpret moving averages
- ability to interpret volume changes
- ability to interpret trend folowing indicators such as:
* directional movement index (dmi), identify trend strength and trend direction
* complex ichimoku cloud , identify trend stregth, and tk crosses
- ability to interpret oscillators such as:
* relative strength index, identify oversold overbought levels, identify the rsi flow
* commodity channel index, identify oversold overbought levels
* awesome identify if grawing or falling
* macd if bullish or bearish, and macd histogram if grawing or falling
- ability to calculate probability and its trend
non-stop hardworker,
available 7/24,
highly dedicated always on duty,
open for new ideas and willing to learn
upon request the analyst will create reports with custom settings of your choise
the analyst is not a decition maker, trading success is all about following your trading strategy and the analyst aims to help with the presented reports calculated by the most popular technical indicators
the analyst supports 9 of the popular technical indicators and is willing to learn more, please share your comments and feedbacks and help the analyst improve skills
cheers!

stellar is getting ready Positive signals shows up
Bounced from historical trend line (historical line was crossed a month ago and now the test passed)
Bounced from ma100 and ma200
Bounced from Keltner Cannels lower cloud
Probality calculated based on beyas theorem shows positive signs of bullish probable moves (still in bear area but increasing)
p-macd, which calculates relationship between price and its MA as well as relationship between two MAs, heads up
if price closes and remains above blue trend line than we may expect further moves up, be paitant we are still below 20ma

BNB ShortShort indication 1 : colored directional movment index on the top of the chart is yelow which indicates non-existend trend and the arrow points down which is showing that the negative direction is stronger.
Short indication 2 : probability line as shown with bayes indicator is right at %50 level which is infact equilibrium of probable move up or down. But the slope is pointing down which could be indication of further move down. PS: Probablity line is calculated by taking on account BTCUSDT’s probable movements
Short indication 3 : WaveTrend is signaling sell even if it is not a strong one
Short indication 4 : Price Action below 20 period SMA
Short indication 5 : elliott wave could be forming WXY and Y not completed yet

BEWARE PROBABLE VIOLENT PRICE MOVE - SPDR S&P 500 - SPY - DAILYWe have noticed that the market is up trending and whenever the price has evolved close to the blue line and the red doted up trend line, it was followed by very violent price change.
Therefore, beware, as the price is at the moment evolving around the red dotted line.
Besides, the price has shown also elastic movements, coming back again and again to its previous break points.
Keep all those information in mind when evolving on this SPDR S&P 500 - SPY market.

Bitcoin - June 2020 levels and probabilitiesYou can find Bitcoin probabilities for June 2020. Levels are generated using 9 years of data.
Disclaimer: I'm not a professional trader or financial advisor. This is not financial advice.
Trade safe,
Atilla Yurtseven

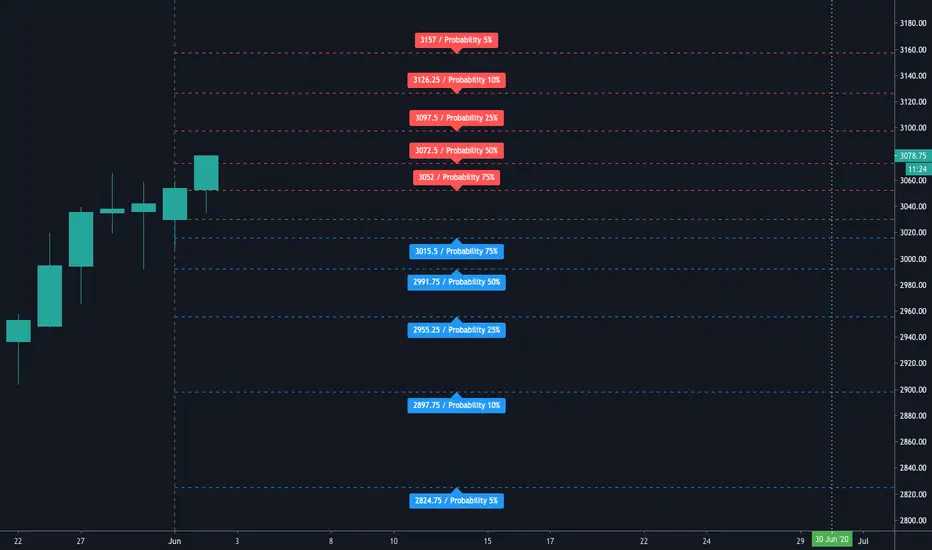
E-mini SP (SP500) - June 2020 levels and probabilitiesYou can find E-mini SP futures probabilities for June 2020. Levels are generated using 20 years of data.
Disclaimer: I'm not a professional trader or financial advisor. This is not financial advice.
Trade safe,
Atilla Yurtseven
BTC/USD : Short opportunity on Multi Time Frame** If you enjoy this idea please give us a like and a follow, we focus on High probability setup only**
Hi guys !
Based on a multi time frame technical analysis , we think that BTC /USD is currently short.
Confluence of :
- Double EMA cross on MTF.
- Double breakout and rejection of previous structure
Based on our algorithm, there is more chance that the price goes down then up.
The target is marked on the chart (fib extension -0.382)
Please, let us know what you think of this idea.
Thanks !
- Alex

XAUUSD PROBABLE RANGE FOR MAY 20 2020XAUUSD WILL PROBABLY TRADE BETWEEN 1749,03 - 1725,43. I HAVE A LONG BIAS BUT WERE READY FOR A PULLBACK! LOWER HIGH AND LOWER LOW ON MY LEVELS...

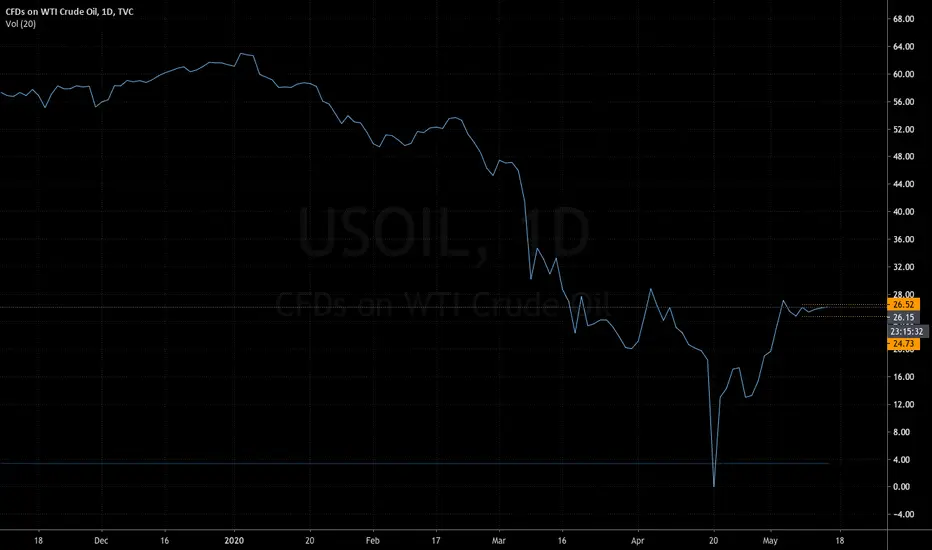
USOIL PROBABLE RANGE FOR MAY 18 2020USOIL WILL PROBABLY TRADE BETWEEN 30,01 - 27,14. I HAVE A NEUTRAL BIAS NEAR TERM AND A BEARISH BIAS MID TO LONG TERM!

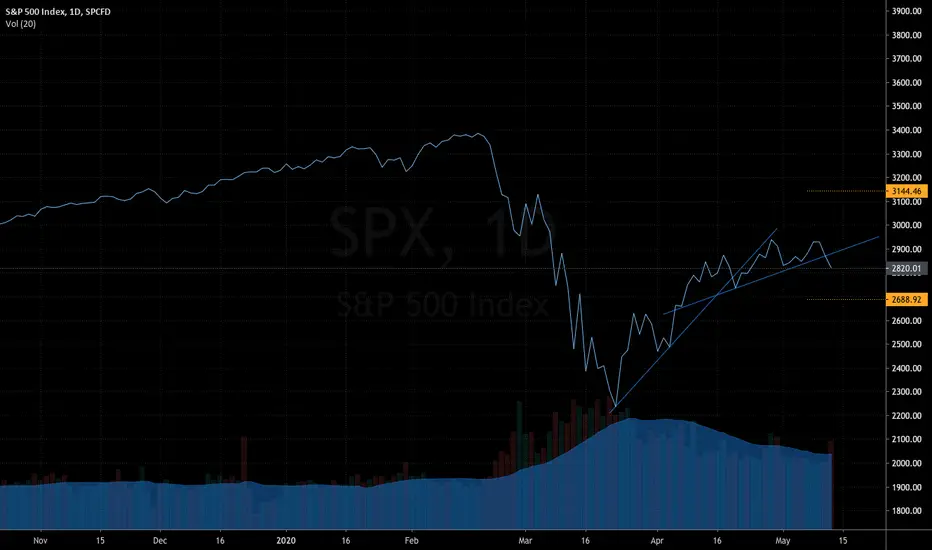
SPX PROBABLE RANGE FOR MAY 18 2020SPX WILL PROBABLY TRADE BETWEEN 2891,63 - 2790,28. I HAVE A NEUTRAL BIAS NEAR AND MID TERM AND A BEARISH BIAS LONG TERM!

BTCUSD PROBABLE RANGE FOR MAY 14 2020BTCUSD WILL PROBABLY TRADE BETWEEN 9344,32 - 8580,33. I HAVE A NEUTRAL BIAS NEAR AND LONG TERM AND A BULLISH BIAS MID TERM!

XAGUSD PROBABLE RANGE FOR MAY 14 2020XAGUSD WILL PROBABLY TRADE BETWEEN 15,66 - 15,33. I HAVE A NEUTRAL BIAS NEAR TERM AND A BEARISH BIAS MID TO LONG TERM!

XAUUSD PROBABLE RANGE FOR MAY 14 2020XAUUSD WILL PROBABLY TRADE BETWEEN 1719,08 - 1698,68. I HAVE A BULLISH BIAS!

USOIL PROBABLE RANGE FOR MAY 14 2020USOIL WILL PROBABLY TRADE BETWEEN 26,52 - 24,73. I HAVE A NEUTRAL BIAS NEAR TO MID TERM AND A BEARISH BIAS LONG TERM!
SPX PROBABLE RANGE FOR MAY 14 2020SPX WILL PROBABLY TRADE BETWEEN 3144,46 - 2688,92. I HAVE A NEUTRAL BIAS NEAR AND MID TERM, AND A BEARISH BIAS LONG TERM! THIS LEVELS WILL KEEP WIDE FOR ONE MORE SESSION... VOLATILITY ISN`T GONE! BE CAREFUL OUT THERE...
BTCUSD PROBABLE RANGE FOR MAY 13 2020BTCUSD WILL PROBABLY TRADE BETWEEN 9088,21 - 8412,88. I HAVE A NEUTRAL BIAS!
