Why Most Traders Misread Trends!!! (Fix It in 10 Seconds)Every trader talks about trends.
Few actually understand how to read them.
Most traders think a trend is defined by:
- a diagonal line
- a moving average
- or a breakout
But the truth is much simpler... and far more powerful:
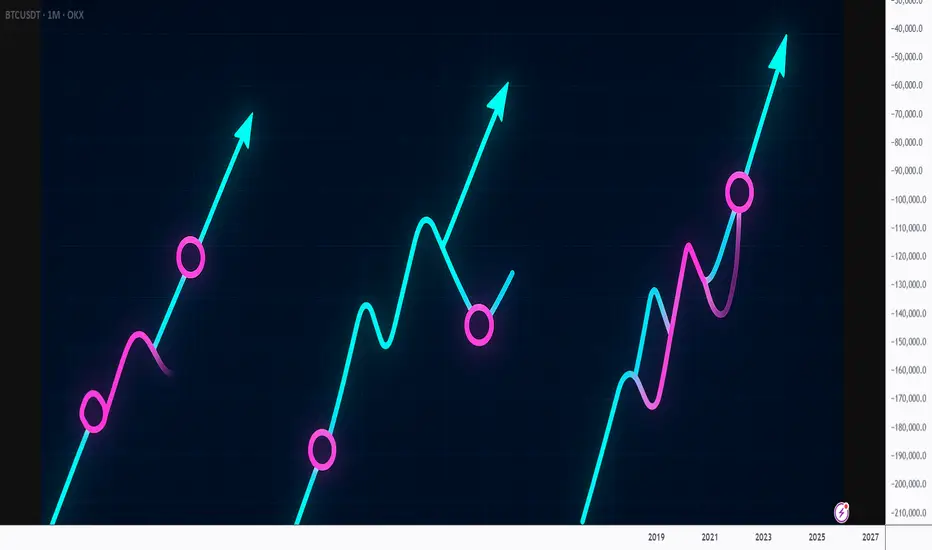
A trend is defined by the quality of its pullbacks.
📚Here’s the 10-second method professionals use:
1️⃣ Shallow Pullbacks = Strong Trend
When pullbacks barely retrace and reverse quickly,
it means one side is overwhelming the other.
Momentum is healthy.
Continuation is likely.
A shallow pullback tells you:
➡️ “Don’t fade this. Follow it.”
2️⃣ Deep Pullbacks = Weakening Trend
When price retraces deep into the previous leg,
momentum is slowing and imbalance is shrinking.
Buyers are less aggressive.
Sellers are gaining confidence.
A deep pullback tells you:
➡️ “Trend still alive, but the engine is cooling.”
3️⃣ Chaotic Pullbacks = Trend Is Dying
If pullbacks become wide, choppy, overlapping, messy,
the trend is no longer in control.
It’s not a trend anymore.
It’s a negotiation.
A chaotic pullback tells you:
➡️ “Stop trading the trend. Wait for structure.”
📚Final Thought
The market isn’t random ... it’s rhythmic.
And pullbacks are the rhythm.
Once you learn to read that rhythm, you’ll stop fighting trends…
and start flowing with them.
⚠️ Disclaimer: This is not financial advice. Always do your own research and manage risk properly.
📚 Stick to your trading plan regarding entries, risk, and management.
Good luck! 🍀
All Strategies Are Good; If Managed Properly!
~Richard Nasr
Pullback
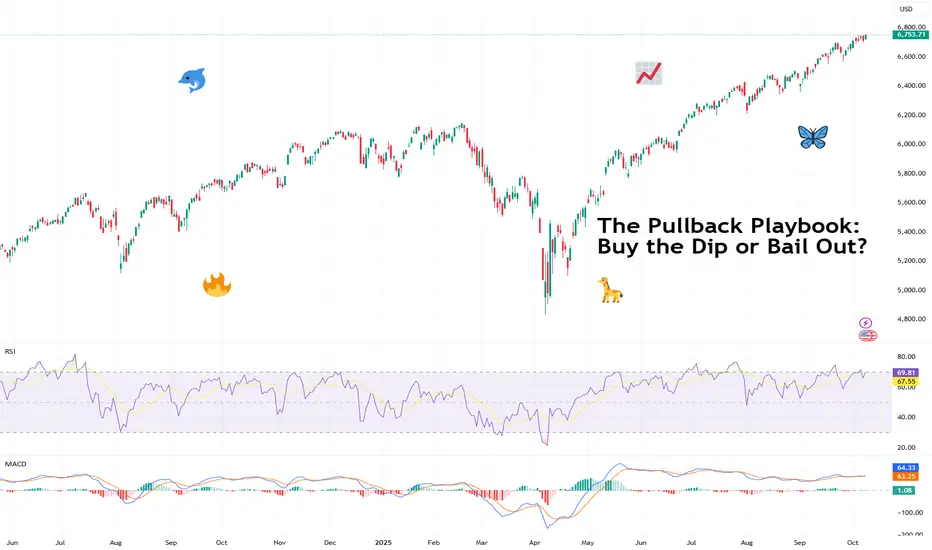
The Pullback Playbook: Buy the Dip or Bail Out?Markets don’t go up in straight lines. Even the strongest trends pause, retrace, and test your conviction.
These pauses are called pullbacks and they can either be healthy breathers before the next leg higher or the first cracks in a trend about to fall apart. The challenge for traders is knowing the difference.
📉 What Exactly Is a Pullback?
Think of a pullback as a temporary trend halt, not necessarily a crash. The price moves against the prevailing trend for a short period, testing support levels or shaking out weak hands before deciding where to go next. They’re common, normal, and — if managed right — they’re opportunities rather than threats.
But here’s where it gets tricky: not all pullbacks are trend halts. Some are the start of a flat-out reversal. And unless you’re comfortable holding through a potential nosedive, you need skills and tools to tell which is which.
🧐 Pullbacks vs. Trend Reversals
So how do know if you’re looking at a pullback or a trend reversal? The main differentiating factor is the length of the move. The healthy pullback looks orderly — modest in size, controlled in volume, and often retracing to familiar moving averages or support zones.
A healthy pullback might retrace 3-5% in a bull run, testing the 20- or 50-day moving average before bouncing higher.
A trend reversal barrels through multiple support levels in days, erasing weeks of gains. It’s often sharper, louder, and driven by news or panic.
Signs of a healthy pullback include:
• Price holding above key moving averages (20, 50-day. Some stretch to the 100-day but these tend to be rare — it’s more likely a trend reversal by then).
• Volume shrinking on the way down, then swelling on the rebound.
• Oscillators like RSI cooling off from overbought territory without plunging into oversold.
Trend reversals look more like:
• Breaks of multiple support levels in one go.
• Heavy, accelerating sell volume.
• Headlines driving panic: tariffs, central bank surprises, data releases from the Economic calendar , crypto exchange blowups, or noise coming from the Earnings calendar .
📊 Technical Tools to Judge the Dip
Charts can’t predict the future, but they can help you gauge probabilities. Pullbacks often line up with Fibonacci retracements, moving averages, or horizontal support and resistance levels.
• Moving Averages : If price pulls back to the 50-day and holds, that’s often a green light for trend continuation. If it slices straight through the 100-day? Not so healthy.
• Trendlines : Respecting the line = confidence. Breaking it = trouble.
• Volume : Low-volume pullbacks suggest sellers aren’t that committed. High-volume dumps are red flags.
None of these are crystal balls. But together, they give you a framework to avoid buying every dip.
🏄♂️ The Psychology of Buying the Dip
Why do traders love dips? Because everyone wants a discount. A pullback offers a chance to jump on a trend at a better price, and social media culture has turned “buy the dip” into a meme strategy. But memes don’t pay the bills when a dip turns into a crater.
The psychology works both ways:
• Optimists see dips as golden tickets.
• Pessimists see them as traps.
• Realists know both can be true, depending on the setup.
Being aware of your own bias — whether you lean toward buying too early or panicking too soon — is half the battle.
🔄 Asymmetric Risk and the Smart Bet
Here’s where it gets interesting. You don’t need to be right all the time if your risk-reward ratio is skewed in your favor. A tight stop and a wide target can mean one win cancels out several small losses.
Imagine risking 1% to potentially make 10%. Even if you’re wrong most of the time, the math can work. Pullbacks are prime territory for asymmetric setups: smart, thought-out entries, clear invalidation points (below support, trendline breaks), and attractive upside if the trend resumes.
This doesn’t mean chasing every dip. A pullback can wipe your position clean if you’ve placed your stop loss a little too close, a little too early.
⏳ Timing Matters
The biggest mistake with pullbacks is trying to catch the exact bottom. Traders love to brag about nailing the wick, but most who try end up paying for it. Smarter is to wait for confirmation — a bounce, a reversal candle, a break back above a short-term moving average.
Yes, you may miss the lowest price. But you’ll also miss buying into a freefall.
🌍 Pullbacks in Context
Context is everything. A dip in a raging bull market is not the same as a dip in a shaky sideways market. Macro matters too. If the Fed is cutting rates , risk assets might rebound fast. If tariffs, wars, or inflation are spiking, a pullback could turn into something bigger and deeper.
That’s why traders zoom out before diving in. Daily charts tell one story; weekly charts often tell the bigger tale.
🚀 Buy or Bail?
So, do you buy the dip or bail out? The honest answer is: it depends. A well-structured pullback in a strong uptrend with unchanged fundamentals is an opportunity.
A violent, volume-heavy selloff in a fragile market with cracked fundamentals is a warning.
The pullback dilemma isn’t just about charts but also about psychology. Can you hold your nerve when the market wobbles, or will you cut and run? Both choices can be right in the right context.
🎯 Final Takeaway
Pullbacks are part of every trend’s DNA. They test conviction, patience, and risk management. The key isn’t to predict every wiggle but to recognize whether price action is just cooling off or signaling something bigger.
Stay disciplined, respect your stops, and let the chart, not the noise, tell you when it’s time to stay in or step aside.
Off to you : Buy the dip? Or bail out? How do you respond to expected and unexpected market pauses? Let us know your coping mechanism in the comments!
How to Filter for Trading CandidatesIntroduction
This post explores how to filter tradable assets using structural and behavioral criteria. While the examples focus on swing trading stocks, the same principles apply across other markets.
A structured selection process helps refine the list of candidates and supports a more consistent approach. The use of filters can reduce the universe of stocks to those that fit the chosen method. For example, in momentum trading, the purpose is to find stocks that have already shown strong movement and may offer continuation opportunities.
There are multiple approaches to selection. This chapter focuses on two practical methods: scan-based filtering and a top-down approach.
Foundational Filters
These basic criteria can be applied across all scans and serve to exclude assets that are illiquid or incompatible with standard execution. The specific thresholds used may depend on personal account size, capital allocation and trading style. This guide focuses on swing trading, where moderate liquidity and price stability are important to ensure consistent fills and manageable risk.
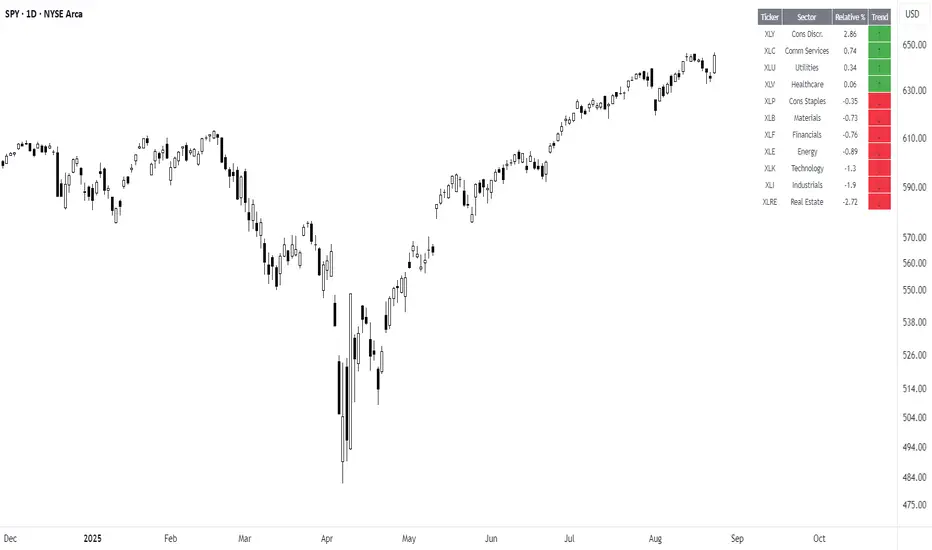
The Sector Relative Strength tool can help show leading sectors versus the S&P 500 Index over the longer term. This optional top-down approach highlights which areas of the market are outperforming and can support manual refinement.
Setup-Based Filters
These examples demonstrate criteria for identifying potential continuation setups following recent momentum. The filters shown are for bullish conditions; for bearish setups, the logic is reversed. For other approaches, such as fading, filters based on excursion/overextension would be applied instead.
Use the Momentum Tracker to visualize when stocks historically met each of these criteria. This helps evaluate the behavior that preceded meaningful setups and refine your filters over time.
Optional Refinement Filters
These filters can help focus the scans further and improve candidate quality.
Candidates can also be sorted based on preference. A common method is to sort by recent volatility, such as ATR%, or distance from the mean price to prioritize price retracement or contraction.
Momentum Scan Example
This sample scan uses normalized momentum to identify new highs in price. The method is standardized and adapts well across different markets. In case the number of candidates is extensive, filters can be more restrictive or additional criteria applied to narrow the selection.
Market Context
Market breadth is the equilibrium between the number of stocks in advance to those in a decline, in other words a method to determine the current market environment. In a positive phase, bullish setups will have improved probabilities and presence, whereas in a bearish phase the opposite would be true. There tends to be a correlation in the market, where stocks often move in line with their sector or the broader index. Being aware of where capital is flowing helps align trades with the broader environment. In case one has an effective scan and review process, much of this assessment is implicitly accounted for.
This guide will not cover these in depth, but there are numerous ways to evaluate market context; such as reviewing index or sector performance, market breadth, and monitoring economic or macro events. The most important part is to be consistent and apply discretion within the chosen process.
Identifying High-Probability Support: The Power of ConvergenceHello Friends,
Welcome to RK_Chaarts
Today we're going to learn Comprehensive Guide to Identifying Convergent Support Zones
Which are High Probability Support areas. This post is for Educational purpose only.
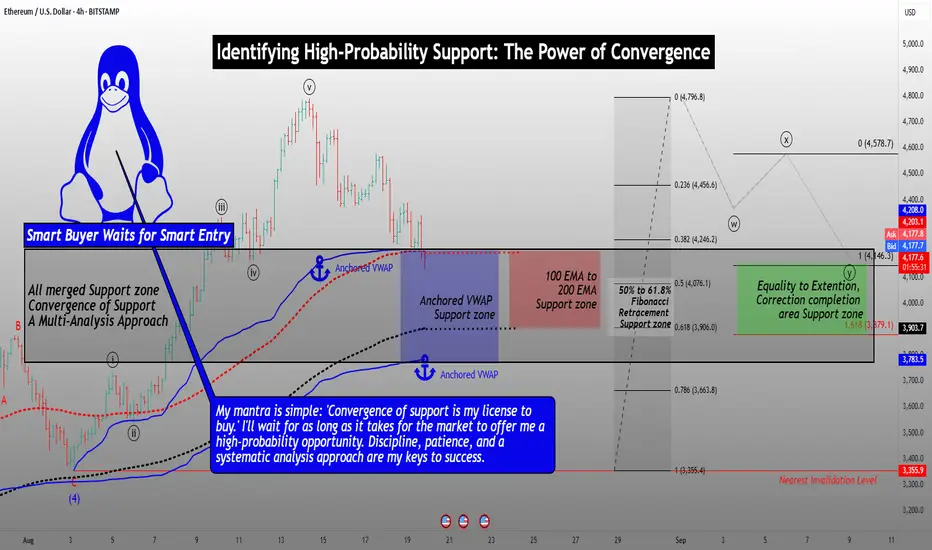
This detailed analysis will walk you through a step-by-step process of combining multiple technical analysis methods to identify a robust support zone. We'll explore how Elliott Wave theory, Anchored VWAP, EMA200, Fibonacci Retracements, and equality to extensions can coincidentally converge on the same support zone.
Step 1: Elliott Wave Analysis
Begin by identifying the Elliott Wave structure. Look for impulse waves, corrective waves, and the relationships between them. In this example:
- Wave Y is potentially completing near the equality zone (100% to 161.8% extension).
- This level marks a potential reversal point.
Support zone as per Elliott Wave theory Analysis
Step 2: Anchored VWAP Analysis
Apply Anchored VWAP to identify key support levels:
- Plot the VWAP from the last swing low and the second-last swing low.
- Note the convergence of these VWAP levels, which can indicate strong support.
Support zone as per Anchored VWAP Analysis
Step 3: EMA200 Analysis
Add the 200-period Exponential Moving Average (EMA) to your chart:
- The EMA200 has consistently provided support during previous corrections.
- Note the price approaching this level, increasing the likelihood of a bounce.
Support zone as per 200 Exponantial Moving Average
Step 4: Fibonacci Retracement Analysis
Apply Fibonacci retracements to the previous rally:
- Identify the 50%, 61.8%, and 78.6% retracement levels.
- Note the current fall has already exceeded the 38% retracement.
Support zone as per Fibonacci Retracement Analysis
Step 5: Convergence of Support Zones
Combine the analysis from each step:
- Note the striking convergence of support zones:
- Elliott Wave equality zone (100% to 161.8% extension)
- Anchored VWAP support zone
- EMA200 support level
- Fibonacci retracement zone (50%-61.8%)
Coincidentally all these are providing nearly same Support area (Price zone)
Trading Implications
With the convergence of these multiple analysis methods, you can:
- Identify a high-probability support zone.
- Look for buying opportunities near this zone.
- Monitor price action and market sentiment for confirmation of a reversal.
- Consider scaling into positions or setting limit orders within the support zone.
Important Note: Failure to Hold Support
If the price fails to hold support at this converged zone, it may indicate a stronger bearish trend. In this scenario:
- Be prepared for a potential significant downfall.
- Consider adjusting your trading plan to account for the increased bearish momentum.
- Keep a close eye on price action and market sentiment for further guidance.
By understanding the convergence of these multiple analysis methods and being aware of the potential risks, you'll be better equipped to make informed trading decisions and navigate the markets with confidence.
I am not Sebi registered analyst.
My studies are for educational purpose only.
Please Consult your financial advisor before trading or investing.
I am not responsible for any kinds of your profits and your losses.
Most investors treat trading as a hobby because they have a full-time job doing something else.
However, If you treat trading like a business, it will pay you like a business.
If you treat like a hobby, hobbies don't pay, they cost you...!
Hope this post is helpful to community
Thanks
RK💕
Disclaimer and Risk Warning.
The analysis and discussion provided on in.tradingview.com is intended for educational purposes only and should not be relied upon for trading decisions. RK_Chaarts is not an investment adviser and the information provided here should not be taken as professional investment advice. Before buying or selling any investments, securities, or precious metals, it is recommended that you conduct your own due diligence. RK_Chaarts does not share in your profits and will not take responsibility for any losses you may incur. So Please Consult your financial advisor before trading or investing.
Technical Analysis of Bajaj Finserv (BAJAJFINSV): A Bullish BreOverview and Key Observations
Bajaj Finserv has recently shown signs of a bullish reversal after breaking out of a classic double bottom pattern, a strong indicator of upward momentum. The neckline at ₹1,680 was breached with significant volume, confirming the breakout. The current price of ₹1,735.20 positions the stock above this critical support, establishing a solid base for further upside. The pattern suggests a measured target of ₹1,800, aligning with intermediate resistance levels.
Support and Resistance Levels
The chart highlights the following critical levels for traders:
Support Levels:
₹1,693.73: Immediate support just below the current price, ideal for pullbacks.
₹1,652.27: Intermediate support aligning with prior consolidations.
₹1,630.13: A deeper demand zone marking the bottom of the previous accumulation phase.
Resistance Levels:
₹1,757.33: The immediate resistance that needs to be breached for continued upside.
₹1,779.47: A key resistance level and the target based on the double bottom pattern height.
₹1,820.93: A stronger resistance and the next major target for the stock.
The stock currently faces resistance near ₹1,757.33, and a breakout above this level with strong volume could open the doors for a rally toward ₹1,779.47 and ₹1,820.93.
Volume and Momentum
The breakout candle exhibited a notable surge in volume, validating the reliability of the bullish move. However, subsequent candles show declining volume, suggesting mild consolidation near resistance. Momentum indicators such as the RSI and MACD need to be monitored for confirmation of continued strength. If RSI remains below 70, there is room for further upward movement.
Trading Strategies
For swing traders, entering long positions near ₹1,700–₹1,720 on pullbacks or above ₹1,757 after a breakout offers good opportunities. A stoploss at ₹1,669, below Support 1, ensures risk is minimized. Targets include ₹1,757.33, ₹1,779.47, and ₹1,820.93. For shortterm traders, a failure to sustain above ₹1,680 could indicate weakness, with downside targets of ₹1,652.27 and ₹1,630.13.
Summary and Outlook
Bajaj Finserv is exhibiting strong bullish momentum backed by technical patterns and volume. The immediate focus is on clearing the resistance at ₹1,757.33 to confirm further upside toward ₹1,779.47 and ₹1,820.93. Traders should remain cautious of a potential retest of the ₹1,680 support zone, which would act as a critical level for invalidating the bullish setup. With strong risk management and a focus on key levels, this setup offers a promising opportunity for both shortterm and longterm gains.

Short re-test and "Buy re-test" signals allow to trade the trendI am a huge fan of buying pullbacks in an uptrending market and shorting pullback in a down trending markets. This is why I always try to code algos that look for those continuation setups.
That Impulse Master Indicator haunts for those buyable and shortable setups

Real Success Rates of the "Rising Wedge" in TradingReal Success Rates of the "Rising Wedge" in Trading
Introduction
The rising wedge, also known as the "rising wedge" in English, is a chart pattern that has a remarkable success rate in trading. This analysis details its performance, reliability and complementary indicators to optimize its use.
Success Rate and Performance
-Key Statistics
Overall success rate: 81% in bull markets
Average potential profit: 38% in an existing uptrend
-Breakout Direction
Bearish: 60% of cases
Bullish: 40% of cases
Contextual Reliability
Bull market: 81% success, average gain of 38%
After a downtrend: 51% success, average decline of 9%
Important Considerations
The rising wedge is generally a bearish pattern, indicating a potential reversal.
Reliability increases with the duration of the pattern formation.
Confirmation of the breakout by other indicators, especially volume, is crucial.
Complementary Indicators
-Volume
Gradual decrease during formation
Significant increase during breakout
-Oscillators
RSI (Relative Strength Index): Identifies overbought/oversold conditions
Stochastics: Detects price/indicator divergences
-Moving Averages
Crossovers: Signal trend changes
-Dynamic Support/Resistance: Confirm the validity of the wedge
-Momentum Indicators
MACD: Identifies price/indicator divergences
Momentum: Assesses the exhaustion of the trend
-Other Elements
Fibonacci Levels: Identify potential support/resistance
Japanese Candlestick Analysis: Provides indications of reversals
Conclusion
The rising wedge is a powerful tool for traders, offering a high success rate and significant profit potential. The combined use of complementary indicators increases the reliability of the signal and improves the accuracy of trading decisions. It is essential to look for a convergence of signals from multiple sources to minimize false signals and optimize trading performance.
_______________________________________________
Here are the best times to enter a trade after a rising wedge, in a professional manner:
-The confirmed breakout
Wait for the candle to close below the support line of the wedge.
Look for a significant increase in volume during the breakout to confirm its validity.
-The retest
Look for a pullback on the broken support line, which has become resistance.
Enter when the price rebounds downward on this new resistance, confirming the downtrend.
-The post-breakout consolidation
Identify the formation of a flag or pennant after the initial breakout.
Enter when this mini-formation breaks in the direction of the main downtrend.
-The confirmed divergences
Spot bearish divergences on oscillators such as the RSI or the MACD.
Enter when price confirms divergence by breaking a nearby support.
-Timing with Japanese Candlesticks
Identify bearish formations such as the Evening Star, Bearish Harami, or Dark Cloud.
Enter as soon as the next candle confirms the bearish pattern.
-Important Considerations
Always place a stop-loss to manage risk effectively.
Be patient and wait for the setup to be confirmed before entering the trade
Check the trend on higher timeframes to ensure the consistency of the trade.
Integrate the analysis of the rising wedge with other technical indicators to improve the quality of decisions.
By following these recommendations, traders can optimize their entries on rising wedges while minimizing the risk of false signals.

EMA, The correct way of usage - Part Two - PullbackOur core belief in ARZ Trading System: Trading, is to have an "expectation" from the market. If not, at any movement, the trader will be confused! If you look at the market and don't have any expectations, don't trade! In a future article, we will discuss what to do if an expectation is not met.
In the case of Pullback, Price is not a ball, and EMA (or any other kind of S&R) is not a brick wall, especially in this case.
If you put an EMA with any period, you'll see that the price crosses it easily most of the time! Then, it might come back as a shadow or a Fake Breakout. This means we should have a confirmation system for accepting or rejecting a Pullback. Otherwise, we'll always see a pullback shaping!
Key Note 1: the higher the EMA period is, the longer will take for a pullback to shape!
Key Note 2: Never trust and trade based on just one S&R level! Always have at least 2 or 3 levels to confirm your pullback. Either in a classical way by drawing trendlines and channels, or using any kind of Indicator as a means of dynamic S&R level.
Key Note 3: a flat EMA is supposed to break easily! If not, it'll reject the price strongly. It means we have to wait for what will happen at a flat EMA to decide what to do next or expect the price will breach it (Please refer to article part one).
Key Note 4: An ascending EMA can only act as a support, and a descending one acts as a resistance, not the other way! This is critical, believe me!
Accepted ways of confirming a pullback in the ARZ System are:
1. Wait for a strong reversal pattern to shape at S&R. Never jump the gun!
2. Use a Volume Indicator like WAE (Waddah Attar Explosion) to confirm your entry at the S&R level.
In this chart:
- Pullback #1 (Bearish Engulfing) is not accepted, because it's just based on one S&R (13EMA) and the reversal pattern closed near the support of MC.
- Pullback #2 (Bullish Engulfing) is strong but closed near 100EMA. Can't trust it.
- Pullback #3 is awesome! This is a multi-candle Evening Star (Key Note 1&2), of 100EMA & Resistance of UTP & MC.
- Pullback #4 is again good but has closed near the low of MC and is risky to take.

Ultimate Trading Strategy: Reaction to Supply and Demand Levels!🔍 Identifying Potential Buy or Sell Zones: In this step, you need to identify the zones that are likely to react and wait for the price to potentially reach them. ⏳📊
🌟 With the reaction to the first area, a buy trade is activated. 🌟
📝 Confirmations:
📉 Reaction to the expected area – Watch for a price movement hitting our anticipated zone!
🛠️ Formation of a combined hammer pattern – Look out for this powerful reversal signal!
📈 Formation of a bullish engulfing pattern – A strong indicator of upward momentum!
🔍 Trading Tips:
💡 High-risk stop-loss location:
👉 Place it below the candlestick pattern. At least twice the spread to ensure you're covered! 📏🔒
💡 Lower-risk stop-loss location:
👉 Place it below the expected area. Again, at least twice the spread for extra safety! 📏🔒
💰 Take-profit strategy:
👉 Base it on risk management mathematics, such as risk-reward ratios of 2, 4, and 6.
👉 Alternatively, observe reactions to past market areas, especially near important market highs and lows. 📊📈
🎯 Entry point strategies:
👉 Enter at the close of the confirmation candle.
👉 Or, set a limit order around 50% of the confirmation candle for a bigger volume opportunity! 📉📈
🌟 Buying in Two Phases: A Smart and Exciting Strategy! 🌟
🔹 Phase One:
When you reach a profit of twice the risk, exit the trade. Why? Because the Asian high has been hunted and the candlestick formed has a long upper shadow. 🌄💹
💡 Analysis:
The price hasn’t reached other zones yet and has risen in reaction to the first expected zone. Therefore, we expect a pullback and continued upward movement. 💪📈 So, I’ll place a second buy trade. 🚀💵
🔍 Confirmations for the Second Buy Trade:
A double bottom has formed, marked with an X. ❌❌
A small hammer candlestick has swept the double bottom. 🔨
A long positive shadow candlestick has swept the bottom and reacted to a small order block on the left. 🌟
💡 Tips for the Second Buy Trade:
Enter at the close of the long-shadowed doji candlestick or place a stop limit order above the long-shadowed doji candlestick. 📉📈
The stop loss should be below this candlestick. 📏🔒
🔹 Phase Two:
Next, the price has reached an expected reaction zone from where we expected a price drop. 🌐💡
🔍 Confirmations for the Sell Trade:
Reaction to the expected zone. 🔍
An inverse hammer candlestick reacting to the zone. 🔨
💡 Tips for the Sell Trade:
The entry point should be in a candlestick with a negative signal indicating a price drop. This hammer candlestick can indicate a decline. 📉🔻
The target can be a reward of 2 or the last price bottom. 🎯💰
The stop loss should preferably be behind the expected zone. 📏🔒
🔥 Important Points!!:
Since the price hasn’t deeply penetrated the zones, there’s a chance it might go higher or even mitigate this zone twice, ultimately turning it into a pullback for a further price rise. 🚀📈
Continuing on, the price reached the upper zone area.
We expected a price drop from this zone, but it reached at 03:15,
which is outside our trading session. However, we could have traded on it.
🔍 Sell Confirmations:
The price has reached the expected zone.
An inverse hammer candlestick pattern.
💡 Interesting Fact:
If you had placed a limit order around the midpoint of the previous two zones,
you would have profited by now. So, for this zone, you can also place
a limit order around 50% of it.
Continuing further, other zones have formed below that could be useful
for new trades.
✨ Successful Sell Trade Achieved, Reaching a Reward of 4 Times the Risk.
📉 During the session continuation, the trend line was broken, triggering an upward price pullback.
🔹 Now, at the beginning of the session, we have a new zone, likely a selling order placement area. We're taking the risk on this zone. This time, we can place the trade around 50% of it. 🚀💼
🔥 Alright, what's your take now? 🔥
🌟 Is the price reacting to this level or not? 🌟
🚀📈 or 📉💥
Where are the upper zones located?
What do you think? 🤔💬

Learn What is PULLBACK and WHY It is Important For TRADING
In the today's post, we will discuss the essential element of price action trading - a pullback.
There are two types of a price action leg of a move: impulse leg and pullback.
Impulse leg is a strong bullish/bearish movement that determines the market sentiment and trend.
While a pullback is the movement WITHIN the impulse.
The impulse leg has the level of its high and the level of its low.
If the impulse leg is bearish, a pullback initiates from its low and should complete strictly BELOW its high.
If the impulse leg is bullish, a pullback movement starts from its high and should end ABOVE its low.
Simply put, a pullback is a correctional movement within the impulse.
It occurs when the market becomes overbought/oversold after a strong movement in a bullish/bearish trend.
Here is the example of pullback on EURJPY pair.
The market is trading in a strong bullish trend. After a completion of each bullish impulse, the market retraces and completes the correctional movements strictly within the ranges of the impulses.
Here are 3 main reasons why pullbacks are important:
1. Trend confirmation
If the price keeps forming pullbacks after bullish impulses, it confirms that the market is in a bullish bearish trend.
While, a formation of pullbacks after bearish legs confirms that the market is trading in a downtrend.
Here is the example how bearish impulses and pullbacks confirm a healthy bearish trend on WTI Crude Oil.
2. Entry points
Pullbacks provide safe entry points for perfect trend-following opportunities.
Traders can look for pullbacks to key support/resistances, trend lines, moving averages or fibonacci levels, etc. for shorting/buying the market.
Take a look how a simple rising trend line could be applied for trend-following trading on EURNZD.
3. Risk management
By waiting for a pullback, traders can get better reward to risk ratio for their trades as they can set tighter stop loss and bigger take profit.
Take a look at these 2 trades on Bitcoin. On the left, a trader took a trade immediately after a breakout, while on the right, one opened a trade on a pullback.
Patience gave a pullback trader much better reward to risk ration with the same target and take profit level as a breakout trader.
Pullback is a temporary correction that often occurs after a significant movement. Remember that pullbacks do not guarantee the trend continuation and can easily turn into reversal moves. However, a combination of pullback and other technical tools and techniques can provide great trading opportunities.
Please, let me know if you have any questions! Also, please, support this post with like and comment! Thank you for reading!

TOMMY XAU | BASIC MARKET STRUCTURE Good afternoon gold gang!
Thought id jump on here to talk to you about basic market structure, as its the basis for any strategy and super important to learn.
We can identify that the market moves 3 ways ..
up trend
down trend
sideways (consolidation)
I prefer to trade when the market is trending in either direction. I determine this by looking at the monthly and weekly candles.
In a trending market, i am looking to identify areas that the market can reverse from. If we are making a higher high for example .. I can identify that price is likely to pull back down to the key level it started its ascent from. From there i can wait for confirmations on the lower time frame to take a trade in the direction of the trend.
obviously this doesnt work everytime .. news etc .. but its always good to have it in the back of your mind the phase of the market you are currently in.
you will find with my strategy .. that price will make new structure points around my key levels ( the ones i place on my chart)
Hope this helps some of you out .. back to basics is sometimes the way to go if you are getting overwhelmed with information
Have a great sunday and see you tonight for the outlook
tommy

Introducing the Bars Since EMA Touch IndicatorHey there traders, Stock Justice here! Are you ready to elevate your trading game? Today, we're going to delve into an exciting indicator I call 'Bars since EMA touch', or 'BSET' for short. Buckle up, because we're about to kick your technical analysis up a notch!
The BSET, at its heart, revolves around the Exponential Moving Average, or EMA. When setting up BSET, you'll be prompted for the length of the EMA, with the default being 9. This number represents the number of bars that will be averaged to create your EMA line. A higher value smooths out the line, reducing noise but potentially delaying important signals. A lower value makes the EMA more responsive, but at the risk of responding to market noise.
BSET calculates how many bars it's been since the price last touched the EMA. A positive number indicates the number of bars since the price was last above the EMA, and a negative number shows how long it's been since the price was below the EMA.
BSET also uses the MACD and signal line to color-code these bars. Blue and red bars indicate price is above the EMA, with blue signaling an upward trend and red signaling a possible downturn if the bar number is above 3. White and green bars indicate price is below the EMA, with white signaling a downward trend and green indicating a possible upturn if the bar number is above 3.
This color-coding can be a useful tool to quickly determine whether a potential reversal is in the making or if the current trend is likely to continue. But that's not all! BSET takes it a step further by keeping track of how often price trends extend beyond certain thresholds, updating these thresholds if necessary.
These thresholds, shown as red and green lines on the histogram, indicate the 15% percentile for bull and bear trends, respectively. If more than 20% of trends exceed the current threshold, it's adjusted upwards. This gives you a historical context for how long trends usually last and can help you spot when a trend is overextended and might be due for a reversal.
BSET is an innovative tool that combines trend tracking with volatility in a unique way, helping you better understand market dynamics and make informed trading decisions. Just remember, every indicator, BSET included, is just a tool. Always use them in conjunction with other analysis methods and never risk more than you're willing to lose.
That's it for now, traders. Keep your eyes on the charts and remember: Trade safe, trade smart! This is Stock Justice, signing off!

Top Pullback Trading StrategiesTop Pullback Trading Strategies
In this article, we will be discussing some of the most effective pullback trading strategies that can assist forex traders in identifying ideal entry points that align with the current trend. These strategies enable traders to take advantage of short-term price retracements, allowing them to navigate the volatile currency market with greater ease and profitability.
What is pullback trading?
Pullback trading refers to the practice of capitalizing on temporary price retracements or surges within an existing uptrend or downtrend in the forex market. These fluctuations in price typically occur over a brief period and do not interrupt the prevailing trend. Traders can leverage pullbacks by entering positions when the currency pair's price approaches its support or resistance level, enabling them to profit from upward or downward market movements.
Discover the Top Pullback Trading Strategies for Forex Traders
Moving Average Strategy
The Moving Average (MA) strategy is among the most widely used techniques for identifying pullbacks in an ongoing uptrend. This technical indicator calculates the average price of a currency pair over a specified timeframe and compares it with the present price to ascertain market behaviour.
In an uptrend, when the current price of the currency pair is significantly below its average price, it suggests that a short-term dip is likely to occur and provides a signal to enter long positions. Conversely, in a downtrend, if the current price of the currency pair is significantly above its average price, it implies that a short-term hike is probable, indicating the need to enter short positions to profit from a subsequent market downturn.
Trendline Strategy
Trendlines play a crucial role in identifying the direction of a trend in forex. Connecting three or more high or low price levels creates an uptrend or downtrend trendline, respectively. When trading pullbacks with trendlines, traders look for higher high price levels followed by higher low price levels, indicating a temporary dip in an ongoing uptrend. Alternatively, traders can enter short positions with trendlines showing lower low price levels followed by higher low price levels, signaling a temporary hike in an ongoing downtrend.
Traders can enter long or short positions with trendlines at the third, fourth, or fifth high or low price level, as these levels confirm the prevailing trend and signal the optimal entry point in the forex market.
Breakout Strategy
The Breakout strategy enables traders to enter the market immediately after currency pair prices reach their support or resistance level and subsequently move above or below it, respectively. Breakouts represent opposing movements to the prevailing trend, providing opportunities to enter the market during temporary reversals.
In an uptrend, when the currency pair price briefly touches its support level and contracts, a breakout signals a pullback in the trend, providing a signal to enter long positions and benefit from rising prices. Conversely, in a downtrend, when the currency pair price briefly touches its resistance level and expands, a breakout signals a pullback in the trend, providing a signal to enter short positions and benefit from falling prices.
Fibonacci Retracement Strategy
The Fibonacci Retracement strategy determines the optimal levels for entering the market during an uptrend or downtrend. Using Fibonacci levels, traders can identify the ideal support and resistance levels, based on which they can decide to long or short the market. This strategy utilizes Fibonacci retracement levels, which indicate how much currency pair prices are retracing before continuing in the prevailing trend direction.
During a downtrend, lower Fibonacci levels, such as 23.6% and 38.2%, suggest that the markets have not retraced significantly, enabling traders to identify the ideal resistance level (representing a temporary pullback hike) and signal short trades due to the expected continuation of the downtrend. Conversely, during an uptrend, higher Fibonacci levels, such as 61.8% or 78.6%, indicate that the markets have retraced extensively, helping to identify the ideal support level (representing a temporary pullback dip) and signal short trades due to the anticipated continuation of the uptrend.
Additionally, during an uptrend, lower Fibonacci levels like 23.6% and 38.2% suggest that prices are approaching the resistance level, which may break above this level, signaling traders to place long orders and benefit from the ongoing rising markets. On the other hand, during a downtrend, higher Fibonacci levels like 61.8% or 78.6% indicate that prices are approaching the support level, which may fall below the support level, signaling traders to place short orders and benefit from the ongoing falling markets.
Trade forex pullbacks and identify ideal entry prices
In forex trading, pullbacks can help traders pinpoint the optimal entry points for both long and short trades. By identifying temporary dips or hikes in currency pair prices during an existing uptrend or downtrend, traders can take advantage of short-term trading opportunities without missing out on potential profits.

Education: How To Trade Pullbacks To The Trend LineFor Trend Line Breaks, Wait For Time and Space To Occur. In this example, the trend line was broken on August 3rd, 2022 at 15:00. After the break, the Pullback Trader would wait till price retraces back to the broken trend line for an entry. Price retraced back to the trend line on August 11th, 2022 at 19:00. The Trader would have placed their entry at that time and date.
The next retracement occurred on August 29th at 19:00. The Trader would have placed their entry at that time and date.
In trading trend line breaks, wait for space and time to occur before entering.

The Best Pull Backs To Trade (Part One)Price pulled back to pivot point level 0.67. Price retraced 50%. Pin Bar candlestick formed at 50% retracement. Open Price and Close Price is "near" 50% retracement level as well at the pivot point level. Candlestick wick protrudes through the pivot point level and retracement level.
This is an ideal condition to enter a trade position using pivot point indicator, fibonacci retracement tool, and pin bar candlestick.

Trading RSI Divergences LIKE A BOSS (I may have failed you)Get your copy of the Free Heiken Ashi Algo Oscillator
I'm not going to lie. There is WAYYY too much technical stuff to type up in this for you guys. its best if you watch the video. Always Always Always ask questions below. I am always more than happy to show you what's what.
This is some UPPER LEVEL STUFF in this video and i know a lot of you won't fully understand it but i want you to understand what it is that you DON'T KNOW about.
Unless you know these things, you won't know what questions to ask about. So here we go. Let's get into it.
Trading the RSI Divergence like a BOSS
After the RSI Divergence is found:
On the chart: (KEYS)
1 = last HH
2 = current HH
3 = 1st HH Closing Price
4 = Confirmation of candle closing BELOW 1HH close price
5 = Find your targets
6 = Pinpoint any target with multiple confirmations
Steps to take:
1. See last Highest High
2. Draw a line across the last Highest High close price.
3. Confirm second HH is higher price but lower RSI value.
Now wait....
4. Wait for candle to close below price of step (2)
5. Enter SHORT if (Heiken Ashi Candle is closing RED)
6. Your 50ema is Take Profile #1 (Set it up)
7. Your swing high is your stop loss
8. What does the RSI Formula tell you? Is it in the positive? So what! Use the same numbers but trade SHORT. Yep, that what i said, TRADE IT IN REVERSE! This is Take Profit #2
9. Do the Fibonacci trick to confirm which is closer (tp 1 or tp2)
10. Look left for the most recent area of Liquidity. It's a candle with a long wick up or down where price reverses sharply.
11. Scan the Algo for a price level WITH volume. You have found your target. Adjust your take profit and walk away.

types of pullbacksIn this lesson, I shared with you the types of pullbacks
Be careful, pullbacks are breaks in the middle of the trend
Poolbacks do not have the strength of main steps
In my opinion, the best type of trading with pullbacks is to recognize the completion of these corrections patterns so that we can move in the direction of the trend at the right point.
Of course, it depends on your trading time frame.

RSI Trend Strategy GuidelinesThe RSI is a versatile indicator, and can be used to provide entry signals during a trend. To get the signals a moving average is applied to the RSI.
1. Trades are only taken in the direction of the trend. For an uptrend only take longs. For a downtrend only take shorts (puts).
2. During a downtrend the RSI must move above 60 to indicate a pullback. When the RSI crosses back below its moving average (can be at any number, just as long as the RSI is or was above 60 recently) go short.
3. During an uptrend the RSI must move below 40 to indicate a pullback. When the RSI crosses back above its moving average (can be at any number, just as long as the RSI is or was below 40 recently) go long.
4. Give the price at least two or three bars (whatever time frame you are trading on) or more before considering an exit. This gives the price some time to move in your favor.

LINKUSDT The Importance of 0.886 and 0.146 Fibonacci RatiosWhy 14.6% (.146) and 88.6% (.886) are important levels on Fibonacci retracement? The 14.6 Fibonacci ratio, wich has a high mean of assertivity, is mirroned by 88.6, which has become an important entry level and stop loss in the market. 88.6 = 1 - X, X = 14.6. These are hidden levels on the standard scale. But you can add them manually.
As you can see on chart, my fave way to use the Fibonacci Retracement is setting the .50 level at the pivot point** that precedes a pullback, i.e. the lowest low of the first downtrend. The price generally tends to retrace at least to the 0.707* level, which is another hidden level. The most common case in the crypto market, according to my experiences, is the price going into the zone between 0.886 and 0.786. In many cases touching 88.6, which can be considered a conservative point for a stop loss. If the price does not retrace from this zone, then a potential trend reversal can be considered. I have considered the range between 88.6 and 78.6 to be a 'short zone', that is, a zone where I usually wait for a reversive price action, or you could say a potential reversal zone.
When price follows the trend after retracing then I consider 14.6% as my potential target. Means that tendence continues.
This complete zig zag movement is what we call a swing, upward or downward.
*0.707 (70.7%) is the square root of 0.5 Fibonacci ratio, wich is a ratio between 1 and 2.
**Pivot points (some call them "swing points") are those areas where important short term reversals take place.
Okay, let's see what happens during this trade.
Thanks for your attention.

HowTo - Find REAL Pivot/Swing Highs & LowsWant to avoid unnecessary stops and find REAL market structure? Here's you can improve, hiding your stops, and identify a REAL turn in the current flow of price.
Questions?
Ask!
#learntoearn

HOW TO TRADE PULLBACKSHello everyone!
Today I want to discuss pullback trading with you.
You may have come across such a situation when you were waiting for a pullback to enter the market, but the price did not stop and went further.
In the place where you expected the end of the rollback, there was a breakdown, and you did not receive an entry point.
Something went wrong?
Trend
Trend is our friend!
The most famous and most important rule.
At the beginning of any market analysis there must be a trend definition.
If you want to trade pullbacks correctly, you must determine the direction of the trend.
If you are trading on the hourly chart, you must determine the direction of the trend on the daily chart and wait for the right situation on your chart, while trading, of course, with the trend.
There must be a trend in the market in order to trade on a pullback.
Trend types
Trends are different, of different strengths.
They can be divided into three types:
1. When the price bounces off the 20MA and stays higher, we say the market is in a STRONG TREND.
2. The price bounces and stays above the 50MA - GENERAL TREND.
3. The price reaches and bounces from the 200MA - WEAK TREND.
Knowing these types of trend and being able to understand the movement will help us enter the market at the right point.
Point of entry
The entry points will be the areas around the MA lines.
Here it is worth focusing on the word REGION.
You must understand that the price can go below or above the MA and only then turn around, be prepared for this.
Entry on a strong trend
In a strong trend, the price stays above the 20MA.
At the same time, you need to remember that with a strong trend, rollbacks are not deep.
This means that finding the entry point will not be so easy.
But you can open a position after the breakdown of the last maximum.
Entry on a regular trend
In a normal trend, the price makes deeper pullbacks.
The price is testing the 50MA, while the previous resistance may become support.
These are the moments we are looking for to enter.
In such zones, we will wait for a price reversal candlestick pattern to enter.
Entry on a weak trend
In a weak trend, pullbacks are even deeper than in a normal trend.
The price makes a strong pullback, reaching 200MA.
When the price of the zone is reached, we are waiting for confirmation - a candlestick formation.
Closing positions
Closing a position is just as important as opening it.
The main signals for closing will be the price movement beyond the MA line.
For example, in a market with a strong trend, the price may go a little lower than 20MA, which is not critical yet, but it makes you be more careful.
It is worth paying attention to the support level, which should not be broken by the price, but if the price still breaks through the level, then the position must be closed.
With a weak trend, it is worth remembering that pullbacks can be deeper and the price will go beyond 50MA.
You must be prepared for this.
Watch for a support level that should not be broken.
With a weak trend, holding a position is the most difficult.
The price will make strong pullbacks, which will eventually force you to close the trade.
Sometimes the price, having reached the desired zone, does not bounce right away.
Consolidation begins and if you see such a situation, the best entry option would be to exit the consolidation zone.
You must have a plan for every occasion.
conclusions
Trading with the trend is the most profitable business.
You must be able to identify the trend on the higher timeframe and, importantly, be able to wait for the right situation on your timeframe.
The market cannot be predicted with 100% certainty, so use stops and keep an eye on support and resistance levels.
Good luck!
Traders, if you liked this idea or if you have your own opinion about it, write in the comments. I will be glad 👩

Simplifying Order FlowThis chart analysis shows you the power of order flow using two main things:
OB - Order Blocks
BOS - Break of Structure
If you can determine a trend utilising impulse and correction, you can almost always ride the wave by scaling in positions using this method.
First, determine your trend and then wait for a break of structure of a low/high.
In this example, we are in a bearish market so we are anticipating a break of a low before we can draw up our order block.
Once we get a break we can mark the OB that created the break and then wait for demand at a later date for sells.
IF the price gets too far away from the OB and looks like it isn't going to return to that point, we can move on to the next BOS and OB.
Note: This does not always mean that price won't return but we can still capitalise on the short term moves.
I have left an example of what could potentially happen next, although I am doubtful because the trend looks like it is coming to an end.
Please take a moment to like and comment on this post!

How To Enter A Pullback In A Trend
Enter when these confluence factors are present. There is a Trend, Level, and Signal.
Trend:
Up
Confluence Factors at the Support Resistance Level:
Close Price 96.31
EMA 10 Close Price 96.24
50% Fibonacci Retracement Price 96.15
Horizontal Support Price 95.99
EMA 20 Close Price 95.31
Signal:
Rejection Candlestick
