Indicator introduction: Custom Volume - Periodic Peaks & TroughsThis script is a custom volume indicator with additional features.
But why is this useful?
The minimum and maximum volumes, in different time periods, are displayed by labels below the bars. I call them "Peaks" and "Troughs"(Hover your mouse cursor over the labels to see more details)
These parameters are widely used in technical analysis .
If traders want to confirm a reversal on a level of support–or floor–they look for high buying volume . Conversely, if traders are looking to confirm a break in the level of support, they look for low volume from buyers.
If traders want to confirm a reversal on a level of resistance–or ceiling– they look for high selling volume . Conversely, if traders are looking to confirm a break in the level of resistance, they look for high volume from buyers.
How to use alerts
Note that by creating an alert, an instance of the indicator, with all your settings, will be activated on the site's server and alerts will be triggered by it.
After that, changing the indicator settings on the chart will no longer affect the alert.
Open the settings window and select the alert conditions as you wish
Click the Create Alert button (or press the A key while holding down the ALT key)
In the Condition section, select the name of the indicator.
Make the rest of the settings as you wish.
Finally, click on the Create button.
It's finished. After a few moments, your alert will be added to the Alerts menu.
Reversal

The Art of Technical Analysis for Beginners 123 Top & BottomsHey Traders so In my last video we discussed what are Fibonacci Retracements and how they can benefit you in your trading. Today I want to go over one of the most powerful chart formations in technical analysis called the 123 top and 123 bottom.
Enjoy!
Trade Well,
Clifford

Closer look into Rising/Falling Wedge, Reversal Price Action
Closer look into Rising/Falling Wedge, Reversal Price Action structures/patterns
Hi traders:
Today I will go more in detail on rising/falling wedge correction in price action structures/patterns.
You might have already heard about these types of correctional structures, and many traders who utilize them.
Certainly there are many ways of traders identifying them and taking advantage of these kinds of price action, so it's ideal for you to understand them in your analysis.
We first need to understand that a rising/falling wedge is a REVERSAL price action. Meaning when the correction completes, there's a higher probability of the price to reverse.
You might have already seen multiple price action videos from me that go over all sorts of continuation and reversal price action (I will share links below),
and I always talk about when combining multiples of different price action structures/patterns will give you a better edge at entering positions that work out in your favor.
Same idea here, so let's take a look at how rising/falling wedges are, how to identify them, and how to effectively use them in your analysis.
Rising/falling wedge, just as the name suggests, is an ascending/descending type of correction where the price is getting squeezed into a “wedge”.
As the price gets narrower and narrower, there's a higher probability of the price to “reverse” from the wedge.
Now about entries, certainly many traders have their own method of entering, so I will share my point of view and the way how I like to enter them.
Any questions, comments or feedback welcome to let me know :)
Thank you
Risk Management: 3 different entries on how to enter the impulsive phrase of price action
Multi-time frame analysis
Identify a correction for the next impulse move in price action analysis
Continuation and Reversal Correction
Continuation Bull/Bear Flag
Parallel Channel (Horizontal, Ascending, Descending)
Reversal Ascending/Descending Channel
Reversal Double Top/Bottom
Reversal Head & Shoulder Pattern
Reversal “M” and “W” style pattern
Reversal Impulse Price Action
Continuation/Reversal Expanding Structure/Pattern

EDUCATION - TOP REVERSAL PATTERNS ⚡At the end of a trend, there is a typically a reversal pattern indicating to us that the trend is about to reverse. There are 3 main patterns that you NEED to know.
1. Double Top/Double Bottom
A double top/bottom pattern is a chart pattern that consists of 2 consecutive peaks of similar height indicating that there is not enough buying/selling pressure to surpass the extremes of the price. This leads to a reversal in trend.
Double top is a bullish to bearish trend reversal.
Double bottom is a bearish to bullish trend reversal.
For a safe entry, entry would be after the break of the neck line (the last swing point) which is a confirmation that the it is a valid double top/bottom pattern.
Double Top:
2. Rising Wedge/Falling Wedge
A rising/falling wedge is a chart pattern that occurs when price is making higher highs and higher lows (in an uptrend – rising wedge) and lower lows and lower highs (in a downtrend – falling wedge). As the pattern progresses in the wedge, the range of the price contracts and is confined between 2 lines which get closer. Price eventually breaks out of the wedge and creates a reversal.
Rising wedge is a bullish to bearish trend reversal.
Falling wedge is a bearish to bullish trend reversal.
For a safe entry, wait for a breakout of the wedge to confirm the validity of the wedge pattern.
Rising Wedge:
3. Head & Shoulders/Inverse Head & Shoulders
A head and shoulders pattern is a chart pattern that appears as a baseline with three peaks. The outside two peaks (shoulders) are close in height and the middle is highest.
A normal head and shoulders is a bullish to bearish trend reversal.
An INVERSE head and shoulders is a bearish to bullish trend reversal.
For a safe entry, it is often advised to enter on the break of the neckline as that would be confirmation of the head and shoulder pattern.
Inverse Head & Shoulders:
Do your best to find them in your analysis!

Continuation & Reversal Correction in price action structures
In-depth look at Continuation & Reversal Correction in price action structures/patterns
Hi everyone:
Today I want to revisit the fundamental aspect of trading impulsive and corrective phases in Price Action Analysis.
As you all know I focus on multi-time frame analysis and forecasting/anticipating the next impulsive move in the market.
To me, the most important part of identifying the next impulsive phase of the market, is to understand how correction works.
An impulse phase usually happens after a correction has finished correcting, so the key is to identify and understand how a corrections structure will complete so we anticipate the next impulsive move.
You may have seen my videos on this topic, but today I will go more in detail on this, and explain the 2 types of correctional structure the market can create.
The market can only be in 2 phases, impulsive phrase or corrective phrase.
In addition, the corrective phrase can only be continuation, or reversal.
So to fully have an edge in the market, is to understand what the correctional structure the price is currently making,
whether a continuation/reversal, then forecast the possible price outlook, and go down to the lower time frames for possible entries.
Now, it's important to understand that different traders/strategies/styles will call these patterns/structures in varies names.
What they are called or identify isn't important, but the important aspect is to understand whether they are continuation, or they are reversal.
In addition, simply seeing price action structures/patterns by itself, is not a good enough entry criteria for me.
You want to combine multi- time frame analysis, top-down approach, and with multiples of these price actions all happening so it adds extra confluence for you to enter a particular trade.
Seeing a H and S pattern, on a 5 minute chart, without considering the overall HTF and other factors, will not be a consistent move in the long run.
Continuation Correctional Structure/Pattern
Bullish/Bearish Flag
Bullish/Bearish Pennant
Parallel Channel
Reversal Correctional Structure/Pattern
Ascending/Descending Channel
Rising/Falling Wedge
Double Top/Bottom
Head & Shoulder Pattern/Inverse H and S
“M” and “W” style pattern
Reversal Impulse Price Action
I will forward all the price action structures/patterns videos I have made in the past to help you understand each of the structures more.
Impulse VS Correction
Multi-time frame analysis
Identify a correction for the next impulse move in price action analysis
Continuation Bull/Bear Flag
Parallel Channel (Horizontal, Ascending, Descending)
Reversal Ascending/Descending Channel
Reversal Double Top/Bottom
Reversal Head & Shoulder Pattern
Reversal “M” and “W” style pattern
Reversal Impulse Price Action
Continuation/Reversal Expanding Structure/Pattern
Any questions, comments or feedback please let me know. :)
Thank you
Jojo

Heikin Ashi candlesticks overview Heikin Ashi candlesticks gives a smoother appearance by reducing some of the market noise, hence making it easier to spots trends and reversals. There is a tendency with Heikin-Ashi for the candles to stay red during a downtrend and green during an uptrend
Heikin-Ashi calculation uses a formula based on two-period averages
How to read Heikin-Ashi candles
Green candles indicate an uptrend and in case with no lower shadows the move can be assumed a strong uptrend
Red candles indicate a downtrend and if with no higher shadows a strong downtrend
Candles with a small body surrounded by upper and lower shadows indicate a potential trend change or trend pause
the Heikin-Ashi candlesticks do not show the exact open and close prices for a particular time period because they are averaged hence who need to exploit quick price moves may find Heikin-Ashi charts are not responsive enough to be useful
For whom interested with Higher Time Frame Candle presentation on lower time frame chart including Heikin-Ashi candles are invited to check HTF Candles

HOW TO SPOT A MARKET REVERSAL: A beginner's guideHappy Friday, ladies and gentlemen. The topic of our first educational post for the day is the following: How to spot a possible market reversal. Of course, there are many strategies and various methods one can implement to identify a reversal in the markets. The method that we will be talking about today is relatively simple and really effective.
We use two methods to determine a possible reversal: Double Top/Double Bottom pattern formations or break of a trendline. As it can be inferred from the chart, both of the cases of a market reversal strategy that we implement can be noticed.
The first one is a Double Bottom Reversal. When the price manages to create a Double Bottom/Double Top on higher timeframes, it means that the price has not been able to break the structure and is on his way to reverse. Looking at the graph, we can observe that the price’s attempts of breaking the 1678-1680 level of support to the downside resulted in being unsuccessful. Therefore, a nice double bottom formation had been formed and the price started moving to the upside from there.
The second approach is even more simple, we just follow the trend. Remember the saying: “Trend is your friend until the bend in the end”? That’s right, if the price manages to break an uptrending or a downtrending trendline, it’s time to reverse for the most part. Looking at the chart, we can see that the price failed to create a new Higher High, and it broke the uptrending trendline to the downside and started dropping massively.
That's it for the topic of "Market Reversals", family! Hope you enjoyed it. If you have any suggestions on what kind of educational posts we should post next, feel free to let us know in the comment section below!
Have a nice day and an amazing upcoming weekend!

EDUCATION - Rising & Falling Wedges - Reversal PatternsWhat is an ascending/descending correction?
The most common reversal pattern is the rising and falling wedge, which typically occurs at the end of a trend. The pattern consists of two trendiness which contract price leading to an apex and then a breakout appears.
Rising Wedge – Bearish Reversal
The ascending reversal pattern is the rising wedge which consists of higher highs and higher lows whilst losing momentum to the upside. Price contracts and eventually has a bearish break.
Falling Wedge – Bullish Reversal
The falling wedge reversal pattern occurs at the end bear run and indicates that price is ready to reverse. Again, price contracts and then eventually breaks out upwards.
There are 2 types of ways we can trade wedge patterns; Risky Entry & Safe Entry. See below for the pros and cons for both and how to enter them
__________________________________________________________________
Risk Entry:
The reason why it is called a risk entry is because we haven't got many confirmations apart from the third touch of the trendline (as indicated in the chart above). Price may have the potential to go past the trendline for a deeper correction before moving up hence why this is called a risk entry. Whereas for the safe entry, the confirmation would be the break of the wedge.
How to trade using Risk Entry:
Wait for price to bounce off the trendline and then enter with stops below/above the correction depending on whether it’s a rising wedge or falling wedge.
One of the advantages of doing a risk entry is that we can have small stop loss and have a great risk:reward ratio. Also, we can gain an entry at the start of the move and have massive gains!
Safe Entry:
Safe entry requires more than one confluence and requires confirmation. One of the confirmations of the safe entry is the third touch bounce and then another confirmation is when price breaks the correction which confirms that the structure has changed and that we are in a reversal.
How to trade using Safe Entry:
For a safe entry, enter when price has broken the correction with stops above/below the correction. Please note that with this entry method, the stoploss will be greater.
The disadvantage to using a safe entry is that we require a bigger stop loss which makes the risk:reward ratio not as great as the risk entry. However, the probability of the trade succeeding is higher.
RISING WEDGE EXAMPLES
RISK ENTRY
SAFE ENTRY
FALLING WEDGE EXAMPLES
RISK ENTRY
SAFE ENTRY

Engage- Reversal Pattern -2 Extreme Reversal setupThe first Video on Education series - Engage - The Trade Setup
The first candlestick pattern that I will discuss is the wick reversal setup, which is a pattern that can spotlight some of the best reversal opportunities in the market.
studied from Book Secrets of a Pivot Boss: Revealing Proven Methods for Profiting in the Market
www.amazon.in
Happy learning.
( Education purpose for all )

Proof That The Nature Of The Market Is RealThe truth is the market is either in a impulsive stage or corrective stage, simply knowing what phase the market is in can give you an edge in your trading.
LET ME KNOW WHAT YOU THINK.

Always trade in the direction of the Momentum !Who goes long for a share when its bearish? Do you sell your shares if trend is bullish? how can one understand the status of a stock?
One of pillars of successful trading is to trade in the direction of the momentum. of course it is not guarantee your success in all trades but it is definitely a must thing to consider and is necessary for a good trade.
There are some indicators which show the momentum of the market among which " STOCHASTIC" and " STOCHASTIC RSI" can be mentioned.
Simply the momentum is bullish if fast line ( Blue in stochastic indicator) crosses slow line( Red in stochastic indicator) upward and Momentum is bearish if fast line crosses slow line downward.
It is OK to go long if Momentum is Bullish and is OK to go short if it is is bearish. 2 bullish reversals are shown in the chart which show a good point to buy shares . One Bearish reversal is also shown which indicates a good time to go short.
Bullish and bearish reversals in oversold and overbought zones are more powerful. when both fast and slow lines are in oversold zone ( below line 20) it tells us that down side should be very limited. if both lines are in overbought zone ( above line 80) we can expect a near bearish reversal.
Combination of this concept with Elliott wave patterns and Fibonacci levels can give you a powerful tool which is beyond the scope of this post . A simple and elementary example is shown in the TSLA chart which a bearish reversal coincides with 0.618 Fibo retracement and descending trend line.
My strong recommendation is just simply put away those ideas which encourage you to go long when momentum is bearish or (bullish but in overbought zone) and vice versa.
Good Luck in your trades

Detail Look into Parallel Channel In Price Action Analysis
Hello everyone:
Let's take another detailed look into some parallel channels structures/patterns in price action analysis.
Recall my previous educational video on Ascending/descending channel correction, they are higher probability reversal price action structures/patterns.
Today I want to go over the horizontal parallel channel structures/patterns as well where they are more neutral,
more advanced to analyze and forecast the potential direction of the impulse phase following after.
Let's take a look into some of these horizontal parallel channel corrections, and break them down more.
In my opinion, the longer, deeper these types of parallel channels go, the stronger the next impulsive phase will be.
Although they can be tricky depending on whether they are continuation or reversal correction.
I will go over for examples in different markets to pinpoint some of these price action structures/patterns.
Below are some of the important topics that I mentioned in the video.
Reversal Ascending/Descending Channel
Risk Management: 3 different entries on how to enter the impulsive phrase of price action
Multi-time frame analysis
Identify a correction in price action analysis
Continuation and Reversal Correction
Any questions, comments, or feedback welcome to let me know thx :)
Jojo

Raff Regression Channel (RRC) The Raff Regression Channel (RRC)
The Raff Regression Channel , developed by Gilbert Raff, is based on a linear regression, which is the least-squares line-of-best-fit for a price series, with evenly spaced trend lines above and below . The width of the channel is set by determining the high or low that is the furthest from the linear regression.
Because the channel distance is based off the largest pullback or highest peak within a trend, for effectively drawing and using a Raff Regression Channel it is recommend/required that a Raff Regression Channel is applied to “mature” trends.
Once The Raff Regression Channel is drawn, covering an existing trend, EXTENSION LINES are drawn to identify support, resistance, reversal points, mean reversion
Effectively drawing and using a Raff Regression Channel
The trend is up as long as prices rise within this channel. An uptrend may be reversing (not always, but likely) when price breaks below the channel extension . The trend is down as long as prices decline within the channel. Similarly, a downtrend may be reversing (not always, but likely) when price breaks above the channel extension . Moves outside the channel extensions can be indication of a reversal or can denote overbought or oversold conditions
breakout example
reversal example
█ LINK to AUTOMATED INDICATOR VERSION of RAFF REGRESSION CHANNEL
█ OTHER CHANNEL CONSEPTS
Linear Regression Channels,
Fibonacci Channels,
Andrews’ Pitchfork,

Educational: AB=CD pattern w/ BTC exampleOne fairly easy and useful pattern for determining reversals is the AB=CD pattern.
The pattern simply looks for two rising or falling legs up or down respectively. Then one simply measures the retracement level from point B followed by the projection from C (luckily tradingview has a tool to assist with this). If these values equal a 0.618 or 0.786 retracement followed by a 1.272 or 1.618 projection respectively, the pattern is likely to indicate a reversal of the current trend. For example, above we can clearly see the pattern almost perfectly matched the required levels of 0.618 and 1.272.
However, no pattern is guaranteed, so it is always recommended to seek out confirmation. As we can see in the above example, there is bearish reversal divergence that can be seen on both RSI and MACD (dotted green lines), whereby price is rising while oscillators are falling, indicating an even greater likelihood for a reversal.
Upon confirmation of a reversal, one can then target Fibonacci retracement levels as key points of interest as can be seen above.
A nice part about this pattern is how simple it is to spot and draw out particularly with tools available on tradingview.
Hopefully you are able to use this pattern as another useful tool in your arsenal!

Repeating Patterns. Correction End, Major Continuation. S&P 500.This is a non-specific pattern that can be found in any market. I am training my eyes to look out for it. Soon I will be able to trade it. I can do hit the entry in sim just fine when I have nuts the size of the moon, but on live it's a different story, and you and I know it, so practice practice practice.
Being able to stack the probabilities in your favor for knowing when a correction is ending is like knowing the location of one of the jewels used to activate the holy grail. Hopefully, you and I can see the value of pursuing this knowledge.

SXP BTC Reversal analysis & tutorialSome tips to identify a reversal, minimise risk when choosing where to open a position and identify targets to close the position with less risk and more profit.

Day trade reversal setup using Hull MA - over shoot!Hello, Traders around the globe,
Here is a reversal pattern of the Hull Moving Average.
Stage #1: You want to see an acceleration of momentum = the blue crosses have spaces inside them.
This stage is important because if you are doing day trade, you want to be sure that you are in a volatile environment.
You don't want to be where the market is choppy with zero range! .
This stage gives you the "flag" that the stock has a potential day trade opportunity.
The probability of you guessing the exact day that the stock will explode is low, that is why you wait for it to explode and trade the intraday reversal...
Stage #1 EXTRA: Now you know how to detect momentum opportunities, and can go into a lower timeframe and trade the continuation of the acceleration of momentum move... but this is for another post.
Stage #2: You want to see the Hull ma go above the price action = the OVERSHOOT!
Once you see that the Hull is crossing the price that means that momentum is running low ---> reversal is coming... (stage #1 made sure we are volatile, now we want to be sure we are overextended and momentum dries out!)
When the HULL moves above the highest high of the move, OVERSHOOT PHENOMENA, it means that the price got really overextended.
The HULL MA is trying to decrease lag, so it "anticipates" the direction, it gives chance for the price to correct to the right direction. If a strong move happens, the HULL expects it to continue, so it will rise above the high of the price movement, "hopeful" that the price movement will continue in its same momentum and force. since it doesn't... overshoot happens, and a reversal is likely to follow through.
Stage #3: You want the slope of the Hull ma to change direction, then you look for your personal reversal setup.
Overextended can become even more overextended, so it is better to be a little late, and be right, than trying many times to catch the TOP and be discouraged, which will make you miss the move!
Ideally, you want the HULL to be SYNCED :) If the HULL is SYNCED that means that it gives the best representation of the price action.
It is hard to sync the moving average every time, the market is changing...
It is easier to be able to recognize when it is synced and when it is not ===> That way, you know when you have better odds of it being accurate.

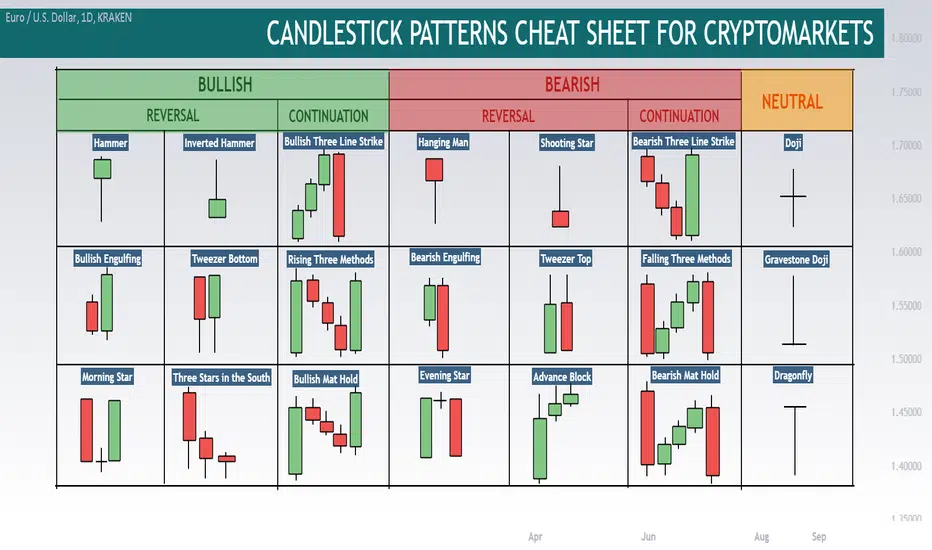
Ultimate Candlestick Cheat Sheet For CryptoHello, traders!
Here is the cheat sheet for the candlestick patterns. They are divided into five groups:
-Bullish Reversal
-Bullish Trend Continuation
-Bearish Reversal
-Bearish Trend Continuation
-Neutral
All these common formations you can see on the chart but first of all you should understand what has happened on the market. When you are looking at the candle a lot of useful information can be received.
For example if the candle have the long wick to the downside and short body (hammer), it means a huge bullish pressure and this is a reversal to the uptrend sign.
When you have three stars in the South formation it is can be noticed that the wicks to the downside are long and bodies became shorter. It means the weakness of the downtrend and also the sign of the potential reverse.
If the candle have a very small body (doji) this indicates that the market is in indefinite situation. Bulls and bears war did not lead to price changes and future price direction is unknown.
Do you use the candlestick patterns? Please write your comment and give us a support with like if you like such cheat sheets!
DISCLAMER: Information is provided only for educational purposes. Do your own study before taking any actions or decisions.
Detail look into “M” & “W” Structures/Patterns in Price Action
Hello everyone:
Welcome back to another price action structures/patterns video.
Today let's take a look into the “M” and “W” style structures/patterns.
Many traders may use these types of structures/patterns in their trading plan/strategies.
Let me show you guys my interpretation of them, and how I utilize them in my trading as well.
It's important to understand many of my previous price action analysis, structures/patterns videos all tie into this one as well, I will put those links below.
Essentially, a “M” or “W” style pattern is a double tops/bottoms pattern that appears mostly towards an end of a run of the current price.
They are “reversal” price action structures/patterns. They are most effective when we tie in other price action structures/patterns with it.
Let me give multiple examples of these structures/patterns in different markets and time frames.
“M” Style Pattern
-Double tops structure after price failed to continue the first initial push down.
-Top of the Right M, needs to have a reversal structure on the LTF or smaller time frames (ascending channel, H and S pattern..etc)
-Can either enter at the breakout of the reversal structure or the first correction after the impulse down
“W” Style Pattern
-Double Bottoms after price failed to continue the first initial push up.
-bottom of the Right W, needs to have a reversal structure on the LTF or smaller time frames (descending channel, Inverse H and S pattern..etc)
-Can either enter at the breakout of the reversal structure or the first correction after the impulse up
Double Top/Bottoms:
Ascending/Descending channel:
Head and Shoulder Pattern:
Continuation/Reversal Correction:
Multi-Time Frame Analysis:
As always, any questions, comments or feedback please let me know.
Thank you
Jojo

Trend Continuation Patterns & Reversal Patterns🚀💣Hi, friends! Let's keep learning?😉
Today we are talking about <> and <> of Technical Analysis 😊
- this girls try to tell You more details😉
Hope, It would be helpful for You♥️
🐂Bull flag🐂
The principle of bullish flag trading, like all technical analysis figures, is the same - a breakout of the control point is required. As soon as a breakdown has occurred, you can immediately post the target. The target in a bull flag will be the height of the pole.
There is one more feature of this figure - the canvas of the flag should be tilted against the main trend.
🐻Bear flag🐻
For the most profitable entry, it is better to enter into a deal with a pending order. As soon as the trade is entered, the take profit is placed at the height of the pole from the breakout point of the pattern.
🐂Bullish pennant🐂
The pattern trading rules are identical to the bull flag trading rules.
🐻Bearish pennant🐻
The trading rules are the same as for the bear flag .
💥Head & Shoulders Pattern💥
After the pattern has become clearly visible, namely, the right shoulder is clearly visible, the trader needs to wait for the neckline breakout. Breakouts occur on strong impulses with a sharp increase in volume . Therefore, in order not to miss the entry and enter at the best price, it's better to use a sell stop order.
To calculate where the price will go after the breakout of the pattern, it is enough to measure the height of the pattern (vertical from the maximum of the head to the neckline) and postpone it to the breakout point.
💥Inverted Head & Shoulders Pattern💥
An inverted head and shoulders pattern occurs in a downtrend and heralds an uptrend. The rules for working on a figure are similar to the previous ones.
It is worth noting that the head and shoulders pattern is rarely encountered in its pure form. Be careful!
💥 Double Bottom Pattern 💥
After you have identified the pattern on the price chart, you need to wait for the breakout of its resistance line. If the price has broken through the resistance, then the target will be the width of the pattern's range - the distance from the lowest point to the resistance.
💥Double Top Pattern 💥
A double top is similar to a double bottom . The only difference is that this pattern is reversed and occurs on uptrends.
The number of extrema in a pattern can be not only double, but also triple, and even more. But the rules of work will be identical for everyone - enter on a breakout, postpone the target to the height of the figure and wait for its execution.
💥Diamond💥
We measure the height and wait for the breakdown of the diamond. If a breakout has occurred, then the price movement target will be the height of the pattern from the breakout point.
💥Cup & Handle💥
Trades are opened on the breakdown of the "handle" upwards. Target is the height of the figure.
Thanks for Your attention🙏🏻
Stay in touch🧡
Sincerely yours Rocket Bomb🚀💣

XAUUSD 4H MACD CROSSOVER TRADING STRATEGYPrice was in an uptrend.
Price bounce off a previous resistance.
Price created a Bearish Engulfing Reversal Candle.
Entered trade at the close of above candle.
MACD crossover happened at the close of the candle also.
Stop Loss placed above reversal candle.
EXITED trade after consolidation made price go sideways.
