LAES Bullish Bat with Three Rising Valleys ReversalPattern Identified: Bullish Bat with strong confluence at Potential Reversal Zone (PRZ).
Key Confluence:
Harmonic PRZ: D aligns with 0.886 XA extension
Price Action: Three rising valleys forming at PRZ - showing accumulation and higher low structure
Momentum: Bullish divergence present on MACD
Reversalpattern

Greaves Cotton: Gearing Up for Upside Momentum! 🚀 Greaves Cotton: Gearing Up for Upside Momentum! 🚀
📉 CMP: ₹207.61
🔒 Stop Loss: ₹179
🎯 Targets: ₹253 | ₹290
Why It Looks Promising?
✅ Gap-Up Start: Week began with a gap-up and the stock is holding gains—sign of strength.
✅ 21 EMA Crossover: Today's move above the 21 EMA suggests bullish momentum building.
✅ Key Level Breach: ₹210 was the high on result day—sustaining above it confirms buyer interest and potential breakout.
💡 Strategy:
📈 Staggered entry can help manage risk in current volatility.
🔒 Keep SL at ₹179 to safeguard capital.
📍 Outlook: With signs of accumulation and breakout attempts, Greaves Cotton could see continued upside in the coming sessions.
📉 Disclaimer: Not SEBI-registered. Please do your own research or consult a financial advisor before investing.
#GreavesCotton #TechnicalBreakout #MomentumStock #SwingTrading #StockMarket

GJ's Rise Is RoundingOANDA:GBPJPY has formed a Rounding Top after making a Breakout of the Resistance level.
Price is currently trading back in the Resistance Level and is looking to potentially make a Bearish Break back down in the the Consolidation.
Once Price breaks back down below the Resistance level, this will generate Short Opportunities to take price down to the next Support Zone.

CMCT SQUEEZE IMMINENTUsed the EMA 9, EMA 21, Squeeze Indicator, and ATR indicator to map out squeeze zones and price movement in the last month plus. The bulls over at CMCT have brass balls and diamond hands and have locked the float. Despite massive manipulation this thing is about to go to the moon. Last week they washed 60% SI down to 4% on Monday with no covering and just last Thursday accrued another 56% Live Short Interest just to suppress the momentum. The pressure cooker is boiling and the shorts keep trying to put the fire out with gasoline by continuing to short with 400% CTB. I am no chart guru, this is my first time posting a chart and my first time using any of these indicators. Regardless, Ive been hodling and accumulating for 2 weeks and can sense the shift. Now would be a great time to get in and HODL for 20+ Lets finish 2025 with a bang! BULLS UNITE!

Hindustan Aeronautics Ltd Taking Reversal from Key Support ZoneThis is the daily timeframe chart of HAL.
HAL is showing a strong Law of Polarity (LOP) support near the ₹4050–4100 zone.
The stock is currently trading within a falling channel, with the channel support aligning closely with the same LOP support area.
This structure indicates the possibility of a flag and pole pattern formation. If the channel support continues to hold,
the stock may attempt a move towards the channel resistance zone near ₹4750–4800.
Thank you.

5 year Reversal about to happen?Entry is around $0.02, with a potential exit range between $0.10–$0.20.
A reversal that’s been building over the past 5 years could potentially play out within the next 4 months.
Worth keeping on the radar.
This is not financial advice. Only invest what you can afford to lose.

LULU Bullish Reversal Alert, +43% Upside Potential on the Table?Hey Realistic Traders!
With the Fed cutting rates, investors rotated out of overpriced AI stocks and into value names. Lululemon stands out after a sharp sell-off compressed valuations to historically attractive levels, and we now turn to technical analysis to see whether price action confirms the bullish case.
Technical Analysis
On the daily chart, NASDAQ:LULU has been trading consistently below the EMA200, reflecting a broader bearish trend. However, a breakout from a wide symmetrical triangle has emerged, signaling a potential bullish reversal.
The breakout was accompanied by a spike in trading volume, while a bullish MACD crossover added confirmation to the bullish bias. Based on this combination of signals, we anticipate a move toward the first target at 221.87, followed by a potential minor pullback before advancing toward the second target at 274.00.
This bullish outlook remains valid as long as price stays above 160.90. A move below this level would invalidate the setup and shift the outlook back to neutral.
Support the channel by engaging with the content, using the rocket button, and sharing your opinions in the comments below.
Disclaimer: "Please note that this analysis is solely for educational purposes and should not be considered a recommendation to take a long or short position on Lululemon."

Entry on a nice H & S pullbackThis stock pays a nice dividend and I want to build a pretty good position. I have some at $89 and see this is a really good spot to add.
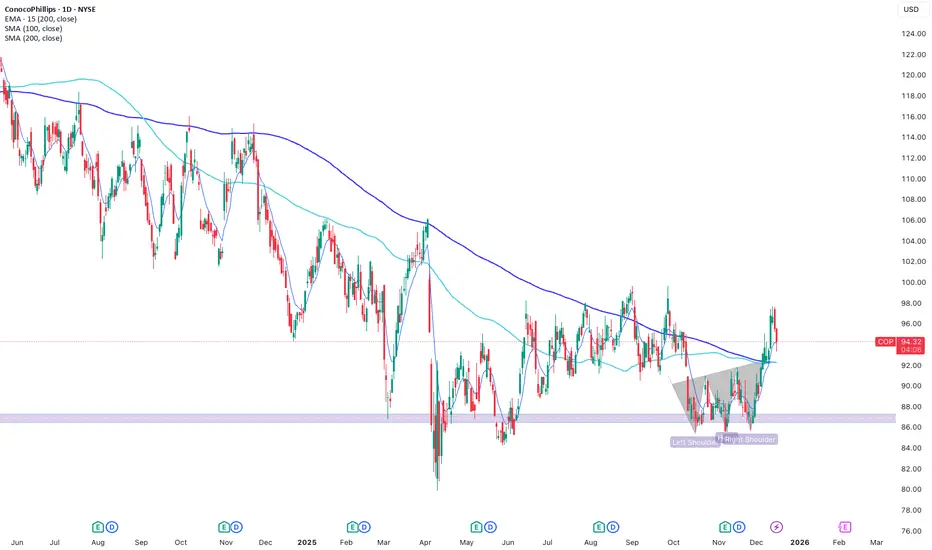
GA Forms Strong Bullish ReversalHere on OANDA:GBPAUD , price has formed an Inverse Head and Shoulders Pattern.
Price currently at time of publishing has completed the Right Shoulder and the 3rd touch of the Neckline or Confirmation of Pattern.
Once Price makes a Breakout of the Neckline, this will generate Long Opportunities a Breakout and Retest scenario to take price on this pair up to the next Resistance Level @ 2.0363 - 2.0394.

Is EG Ready To Drop A Shoulder??Here I have OANDA:EURGBP on a Multi-Timeframe Chart Analysis.
Chart Patterns that are clearly seen through multiple timeframes builds the validity of the scenario and the 4 Hr and Daily Charts seem to be forming a potential Bullish Reversal pattern, the Inverse Head and Shoulders!
Last week we can see on the Weekly Chart that price had come back down to the Previous Resistance Level that was broken out of in October and found Support.
On the 4Hr and Daily Charts we can see last week ended with a 2nd touch of the Neckline or Confirmation of Pattern.
Now if price is putting in a reversal pattern, we still need to see the Right Shoulder form. Pattern is Invalidated if price breaks below the Left Shoulder.
Pattern is Confirmed after price is supported at Left Shoulder level and makes 3rd Neckline touch.
Fundamentally this week will be very heavy for EUR and GBP so stay vigilant!!

REDSTONE – Major Support Bounce or Break? Critical Level AheadREDSTONE is sitting at a major decision point.
Price has been compressing under a descending trendline while holding a long-term support zone (highlighted in brown). This combination usually leads to an explosive move — either a breakout reclaim, or a full breakdown into the lower liquidity pocket.
Key Breakdown:
• Long-Term Support Zone:
Price continues to respect this demand block, showing buyers are still active here.
• Descending Trendline:
Price has tapped this line multiple times. A clean daily candle close above it would confirm a structural shift.
• Two Possible Scenarios:
🔵 Bullish Case (Blue Path)
Break & close above the descending trendline
Reclaim of the minor structure (red box)
Potential continuation toward $0.38 → $0.45
This path follows a standard reversal pattern after a long accumulation period.
⚪ Bearish Case (White Path)
Failure to break the trendline
Breakdown from the brown support zone
Full liquidity sweep into the untested zone around $0.16 – $0.18
This level aligns with previous inefficiency + untouched demand.
Why This Matters:
REDSTONE is compressing — and historically, this type of compression leads to large directional moves. This chart is not a signal, but a structural expectation map showing the most probable paths based on trendline behavior + support strength.
📘 Disclaimer (Education Only)
This post is for educational and informational purposes only. It is not financial advice, and I am not a financial advisor.
All analysis reflects my personal opinions and charting for learning purposes.
Always do your own research and manage your own risk before making any trades.

BTCUSDT Price Action Bitcoin experienced a sharp decline last week, falling to the $80,000 level before rebounding to close the week around $86,850. The price is currently encountering strong support near $84,000, with bulls aiming to defend this area in the days ahead. If this support fails, subsequent zones to watch include $75,000 and the high-volume region between $72,000 and $69,000. On the upside, the key resistance levels are $91,400 and $94,000, which will need to be reclaimed for bullish momentum to resume.
Technically, several indicators such as RSI are exhibiting oversold conditions, suggesting a potential for a short-term bounce, but overall market sentiment remains bearish following the downside break of a broadening wedge pattern. The medium-term target from this breakdown points toward a possible retest of the $70,000 zone, even if temporary rallies occur above $84,000. High volatility persists, with significant volume and price swings expected as traders react to macroeconomic and regulatory factors influencing the entire cryptocurrency market. The directional index (ADX), stochastic, and moving average metrics all reinforce the presence of a strong downtrend, with any sustained recovery requiring a notable shift in buyer demand above resistance

TKC – Multi-Year Inverse Head & Shoulders Formation PotentialA potential multi-year inverse Head & Shoulders structure appears to be developing on Turkcell’s U.S. ADR (TKC) monthly chart.
This is a slow-forming, long-cycle reversal pattern, so completion may take time even few years — also future dividend adjustments will naturally shift the historical price anchors on the ADR chart.
The neckline sits around the 8.00 USD area.
A monthly close above 8.00 would be the structural trigger confirming the reversal.
The measured move from head to neckline projects toward the 13.70 USD area.
This level also aligns with a major Fib confluence zone:
• 61.8% retracement of the 2007 high → 2022 low
• 78.6% retracement — both cluster between ~13–14 USD, reinforcing the significance of that target zone.
Invalidation sits below 4.22 USD.
A sustained move under this level would break the right-shoulder structure and negate the multi-year reversal thesis.
This setup is worth monitoring — high-timeframe reversals can be slow to complete, but meaningful when they do.
Macro note : This stock sensitive to Türkiye’s economical outlook.
Focus on the chart, not the headlines.
(Educational idea – not financial advice.)

NOTUSDT – broken faith and potential for a reversalNotcoin(NOT) - is a Web3 gaming project launched on January 1 within the TON ecosystem. Technically, Notcoin is an application inside the Telegram messenger. The project attracted users' attention through an announced token airdrop. The developers invited users to mine tokens simply by tapping on their smartphone screens. Within a few months, the game's audience exceeded 35 million people.
📍CoinMarketCap: #170
📍Twitter(X): 2.4M
________________
The NOT token dropped by -94.5% following its listing and a wave of hype. Such a decline is typically accompanied by a loss of faith in its growth and potential.
🔍 What I observe:
The price is moving within a descending channel.
A reversal pattern, the "inverse head and shoulders," is forming in the current zone, with a potential upside of around ~75%.
The key point is a breakout above the outer resistance of the channel.
The token has high liquidity.
NOT is traded on all major exchanges, including the top-tier ones.
It has excellent access to marketing and PR, which is important for pump scenarios.
💭 All key levels, possible scenarios, and targets are marked on the chart. Take them into account when building your own strategy.
________
📌 Not financial advice. Personal view and experience.

Mastering Trend Reversals: Morning & Evening Star PatternsSo, you're trying to nail those trend reversals? The Morning and Evening Star patterns are perfect for that. They show up right when the market’s about to shift, giving you a chance to get in before the move really takes off. Let’s break down how these setups work and why they’re such solid tools for traders like you.
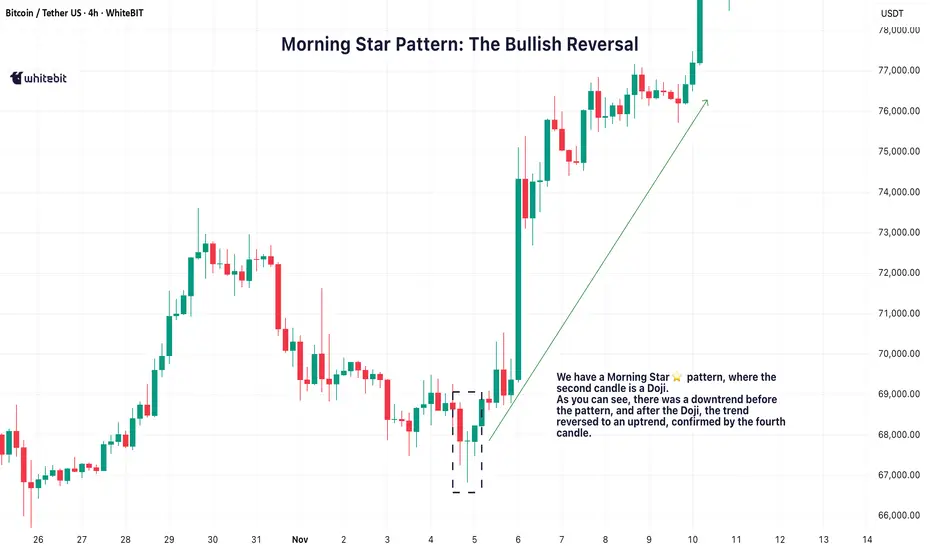
🌅 Morning Star Pattern: The Bullish Reversal
The Morning Star pattern is one of the best ways to catch a trend reversal from bearish to bullish. It usually pops up after a downtrend, signaling that the market is about to make a move to the upside. It’s made up of three candles:
A long red candle that shows the market’s been selling off.
A small candle, often a Doji, that indicates indecision or a pause in the downtrend.
A big green candle that confirms the shift, showing buyers are taking control.
When you spot a Morning Star candlestick pattern, it’s a strong indication that the downtrend might be over and the bulls could be taking over. The third candle plays a crucial role here, confirming that the trend is likely reversing.
🌇 Evening Star Pattern: The Bearish Reversal
On the flip side, the Evening Star pattern is the bearish cousin of the Morning Star. It shows up after an uptrend and signals that the market is ready to start heading down. It also consists of three candles:
A long green candle that continues the uptrend.
A small candle, again often a Doji, that suggests the market’s losing momentum.
A big red candle that confirms the reversal, showing sellers are stepping in.
When you see the Evening Star candlestick pattern, it tells you that the market could be shifting from bullish to bearish. The third candle confirms that the reversal might be taking place.
💡 Trading the Star Patterns
Both the Morning Star trading pattern and Evening Star patterns are great for spotting potential trend reversals, but they shouldn't be relied on as the only signal. To increase the reliability of these patterns, consider confirming them with other indicators like RSI (Relative Strength Index) , MACD (Moving Average Convergence Divergence) , or volume analysis.
For example, if a Morning Star pattern candlestick appears and is followed by increasing volume, it adds strength to the reversal signal. Similarly, if the Evening Star shows up with an overbought RSI, it could provide further confirmation that the market is due for a pullback.
By using these additional tools, you can have more confidence in your analysis and make better-informed decisions.
📈 Why These Patterns Matter
The Morning Star and Evening Star patterns are powerful tools for identifying potential trend reversals. They give traders a visual cue that a market shift could be on the horizon, helping to spot potential turning points.
However, it’s crucial to make your trading decisions based on a combination of factors and not rely solely on these patterns. Always make sure to consider the broader market context and other technical indicators before acting on any pattern.
EURCAD higher bearish expecting
OANDA:EURCAD trend based analysis, currently we having bounce from strong sup zones, we are have long time bullish trend, for me this here is point of revers.
SUP zone: 1.63200
RES zone: 1.61500, 1.61000

CHF/JPY: Local Bearish Reversal?!We are observing a notable bearish reaction on a significant daily/intraday horizontal resistance level on CHFJPY.
Following a test of the highlighted blue area, the price started to consolidate, forming a horizontal range on a 4-hour timeframe.
The violation of this range's support level is an important signal of increased selling pressure.
Consequently, we anticipate a continued bearish trend, with a projected target of at least 189.66.

Trading Rejection Strategy- A Visual Backtest💡 Overview
Here is everything you need to know about the strategy. But before you study it any further, all the visuals are at the end of this post- so don't miss that part.
This setup is built upon simple beliefs:
▶Price always remembers its key levels- Previous Day’s High (PDH), Previous Day’s Low (PDL)
▶Strong support/resistance zones often act as liquidity magnets.
▶When price revisits these areas and fails to break through, it gives us a clear rejection and that’s where the edge lies.
⚙️ Core Conditions
➡Price rejects PDH or PDL
➡Price retests a breakout / breakdown zone
➡Price rejects a tested support / resistance level
➡Timeframe: 15-Minute
➡Type of trade: Intraday only
➡Only one trade per day
🎯 Trade Plan
🔘Entry: One tick above/below the Pin Bar or reversal candle close
🔘Stop Loss: Just beyond the high/low of the rejection candle
🔘Target: Next liquidity zone (recent 15m swing or PDH/PDL)
🚫 Avoid Trading When:
➡No rejection at liquidity levels
➡Risk > 20 points
📊 October Backtest Results
(1 trade per day, tested manually)
Total trades taken= 14
Winners= 6
Losers= 8
Total points made out of winner= 263
Total points lost in losers= 75
Net points made= 188
🧠 Takeaway
Even though the backtest covers only October, the results are encouraging.
The logic is built on price behavior around institutional levels, and that tends to hold steady across time.
📈 Try extending the backtest further:
If results remain consistent, this could become a reliable rejection-based intraday setup worth adding to your toolkit.
Here is a visual to guide to all the Entries, Exits and about how it went.
Enjoy the charts and do let me know what you think about this strategy or if I missed an opportunity ;)
📣Disclaimer:
Everything shared here is meant for education and general awareness only. It’s not financial advice, nor a recommendation to buy, sell, or hold any asset. Do your own research, manage your risk, and make sure you understand what you’re getting into.
Gold Elliott Wave Analysis – Potential Wave (4) Completion ZoneGold (XAU/USD) on the daily chart appears to be completing a classic Elliott Wave 5-wave impulse structure. After a strong rally into the wave (3) high, price is currently retracing toward the projected wave (4) correction zone.
The highlighted support area aligns with key Fibonacci retracement levels:
0.5 retracement: around $3,845
0.618 retracement: around $3,718
This region also coincides with the lower boundary of the ascending channel, adding confluence for potential bullish reversal.
If wave (4) finds support within this zone and maintains structure, a new impulsive rally toward wave (5) could begin — targeting the upper trendline resistance near $4,500–$4,600.

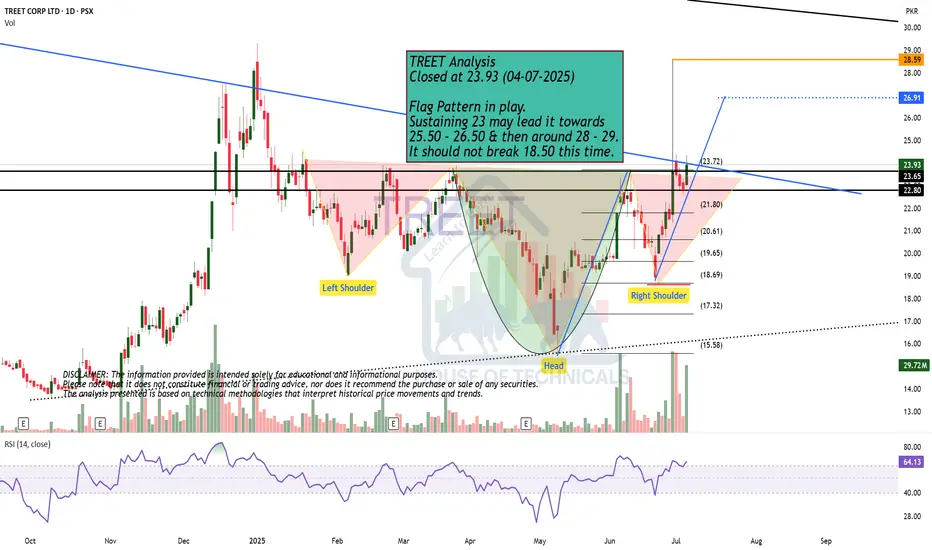
Flag Pattern in play. TREET Analysis
Closed at 23.93 (04-07-2025)
Flag Pattern in play.
Sustaining 23 may lead it towards
25.50 - 26.50 & then around 28 - 29.
It should not break 18.50 this time.
XAUUSD At Critical PRZ: Will Gold Reverse or Break to New Highs?Hello Traders And Investors
XAUUSD At Critical PRZ: Will Gold Reverse or Break to New Highs? 🔥”
The recent price action on Gold (XAUUSD) has reached a very critical level near $3,586 – $3,600, which aligns with a strong resistance zone. This area is marked as a Potential Reversal Zone (PRZ), where sellers may step back into the market.
🔍 Market Structure Breakdown:
Previous Liquidity Sweep
Price collected liquidity below the July lows before forming a Higher Low at the start of August.
This move gave the market strength to push higher, creating a clean bullish structure.
Strong Impulsive Rally
From mid-August onwards, gold showed a strong bullish impulse, breaking through minor resistance levels without much pullback.
However, such parabolic moves often lack sustainability, making them vulnerable to a healthy correction.
Resistance & PRZ Reaction
The current resistance zone has historically acted as a strong rejection level.
Price tapping into this zone suggests exhaustion in bullish momentum, increasing the probability of a short-term pullback.
🎯 Target Zones for Downside Move:
1st Target: $3,480 – $3,500
This area coincides with a previous demand block and will act as the first reaction point.
Final Target: $3,330 – $3,320 (Key Support)
If bearish momentum sustains, price could revisit this major support, completing the correction phase before potentially resuming the broader uptrend.

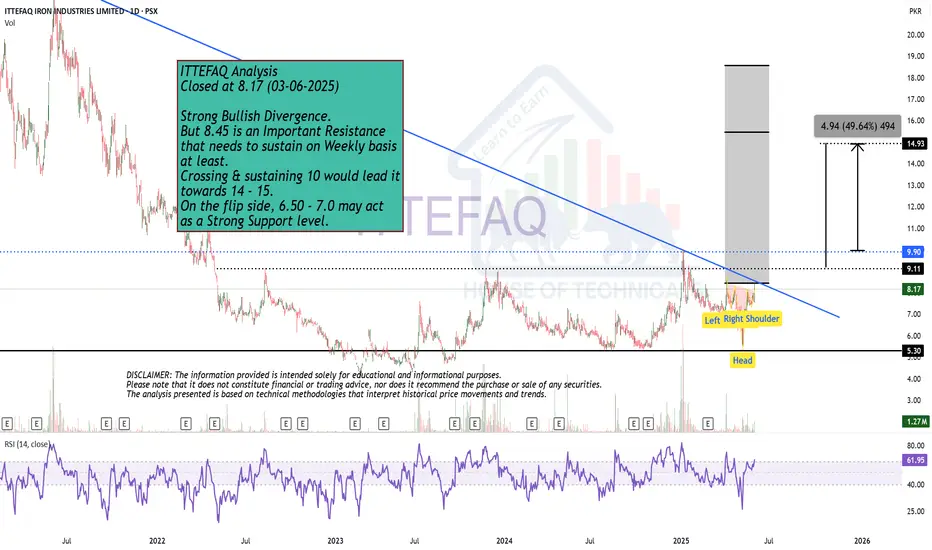
Strong Bullish Divergence. Closed at 8.17 (03-06-2025)
Strong Bullish Divergence.
But 8.45 is an Important Resistance
that needs to sustain on Weekly basis
at least.
Crossing & sustaining 10 would lead it
towards 14 - 15.
On the flip side, 6.50 - 7.0 may act
as a Strong Support level.
EURUSD Short Idea! 4H, RR 1:5Daily Trend line broke and being tested back on fibonacci retracement and trend line resistance.
It looks like there is some downward movement coming possible till the key zone. Cheers! Let’s see!
