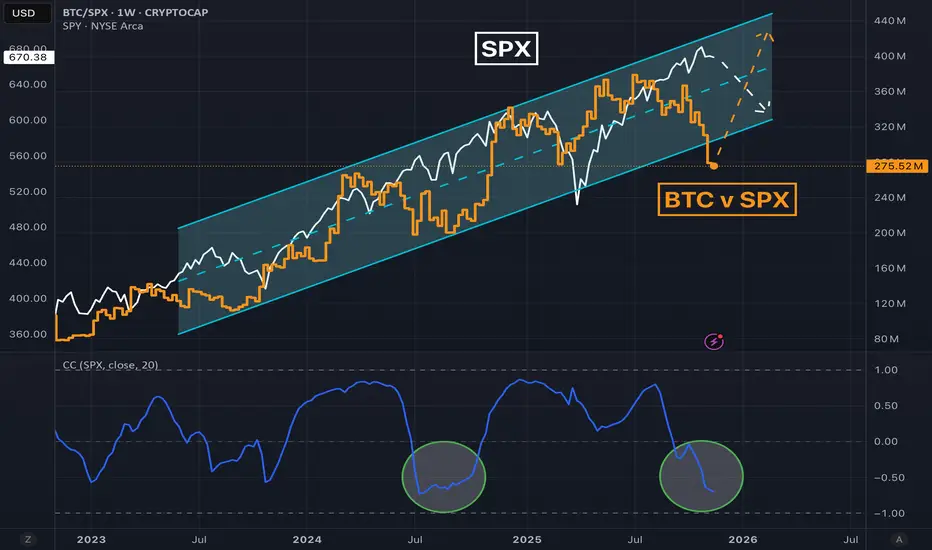
Upcoming rotation from big tech to crypto?Tech SP:SPX and crypto CRYPTOCAP:BTC have been tightly correlated despite suggestions that crypto is a hedge. Therefore it's surprising to see the relative outperformance in tech this year.
In fact, Bitcoin has just gone negative on the year, while the stock market is up double digits again after a sharp April drawdown.
History suggests that crypto / stock relationship should return to a tight correlation, but how do we get there? Will stocks hold and crypto appreciate? Will crypto hold and stocks depreciate?
I think crypto could dig in around current levels, but there's a very good chance I'm mental lol!
Rotation
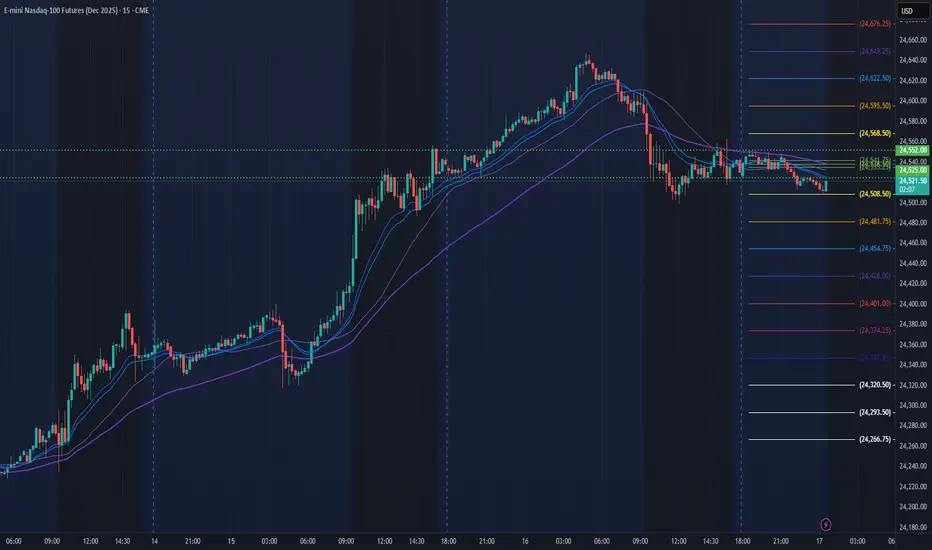
NQ Power Range Report with FIB Ext - 9/17/2025 SessionCME_MINI:NQZ2025
- PR High: 24551.75
- PR Low: 24525.00
- NZ Spread: 59.75
Key scheduled economic events:
14:00 | FOMC Economic Projections
- FOMC Statement
- Fed Interest Rate Decision
14:30 | FOMC Press Conference
Temp AMP margins increase for expected FOMC volatility
Session Open Stats (As of 12:15 AM 9/17)
- Session Open ATR: 270.67
- Volume: 12K
- Open Int: 220K
- Trend Grade: Long
- From BA ATH: -0.5% (Rounded)
Key Levels (Rounded - Think of these as ranges)
- Long: 25217
- Mid: 22503
- Short: 21790
Keep in mind this is not speculation or a prediction. Only a report of the Power Range with Fib extensions for target hunting. Do your DD! You determine your risk tolerance. You are fully capable of making your own decisions.
BA: Back Adjusted
BuZ/BeZ: Bull Zone / Bear Zone
NZ: Neutral Zone
NQ Power Range Report with FIB Ext - 6/17/2025 SessionCME_MINI:NQU2025
- PR High: 22177.25
- PR Low: 22065.25
- NZ Spread: 250.25
Key scheduled economic events:
08:30 | Retail Sales (Core|MoM)
Contract rollover week
Session Open Stats (As of 12:45 AM 6/17)
- Session Open ATR: 385.81
- Volume: 47K
- Open Int: 178K
- Trend Grade: Neutral
- From BA ATH: -3.5% (Rounded)
Key Levels (Rounded - Think of these as ranges)
- Long: 22096
- Mid: 20383
- Short: 19246
Keep in mind this is not speculation or a prediction. Only a report of the Power Range with Fib extensions for target hunting. Do your DD! You determine your risk tolerance. You are fully capable of making your own decisions.
BA: Back Adjusted
BuZ/BeZ: Bull Zone / Bear Zone
NZ: Neutral Zone

WRB RotationTesting a few technical indicators during a cyclical rotation here:
- Volume Profile
-- 50 day lookback "Quarterly PoC" | Price is at PoC
-- 100 day lookback "Power PoC" | Price is at PoC
-- PoC Price | Blue = Long
- 200 Day Moving Average
- provides baseline for Long/Short basis | Price > MA = Longs
- Volatility Radar
-- highlighted background indicates:
--- compressed volatility | Entry Allowed
--- trend intensity is showing a "weakening" bearish trend | Mixed on Direction
- 50 Day Moving Average
-- used as the ultimate exit after price goes above it
Good Luck!

NQ Power Range Report with FIB Ext - 3/3/2025 SessionCME_MINI:NQH2025
- PR High: 21036.25
- PR Low: 20949.00
- NZ Spread: 195.25
Key scheduled economic events:
09:45 | S&P Global Manufacturing PMI
10:00 | ISM Manufacturing PMI
- ISM Manufacturing Prices
Weekend gap up quickly filled
- Holding above Friday's high
- Advertising rotation back into previous 3 month range
- 21200 key level remains zone of interest
- Busy economic week ahead
Session Open Stats (As of 12:45 AM 3/3)
- Weekend Gap: N/A
- Gap 10/30/23 +0.47%
- Session Open ATR: 397.27
- Volume: 53K
- Open Int: 291K
- Trend Grade: Bull
- From BA ATH: -6.4% (Rounded)
Key Levels (Rounded - Think of these as ranges)
- Long: 22667
- Mid: 21525
- Short: 19814
Keep in mind this is not speculation or a prediction. Only a report of the Power Range with Fib extensions for target hunting. Do your DD! You determine your risk tolerance. You are fully capable of making your own decisions.

ETH ecosystem to fund initial stage of crypto bullrunWhen markets rotate the money has to come from somewhere. Money can move in and out of one sector of the economy into the other, like money moving from industrials into technology or from fiat into precious metals. Money can also move around within a macro system from its constituent sub-systems. In the case of crypto, think we will see the Ethereum ecosystem beggared while money flows out of it into other ecosystems.
In order to try and stay ahead of the rotations into and out of crypto and into and out of the various layer one projects within crypto I turn to the best tool I have, which is the charts. Once we have the layer one blockchain we care about we can look at other layer projects that ride on top of the layer one to move up the risk curve for more volatility as we see fit.
ETH/Bitcoin
Bitcoin is the biggest single slice of the crypto by fame and market cap. The double top threat is pretty clear at this point. The black double top appears to be an eve and eve with the difference between the first and second peak about 3.12% That is about as textbook as we could want to see. We just have to start breaking the neckline of the formation and we should start to see more volatility in the pair.
Eth Dominance
ETH.D is likewise in a double top but this one is a bit further away from the neckline. The targeting is much the same. Due to the structures of the uptrend I think that 40% draw down is very reasonable and realistic.
XRPETH
XRP appears to be in a ascending triangle against ETH with a target close to 2x if full performance is reached.
Solana/ETH
Solana is suppose to be an Ethereum killer and in the long run I think it will live up to its name. I think it has a couple of years for the ecosystem to mature before It does. A major sign of strength will be if this W pattern performs to target. That would have Sol putting up over twice the gains than eth does in the initial stages of this move.
Polkadot ETH
Dot has been moving sideway for the last 4 months and has created some bullish divergence on the weekly chart. I think we will see it slowly erode share out of eth.
Kadena Eth
One of my favorite layer ones to watch and maybe trade before I see my long term set up is Kadena. It is poised ot have a W pattern that pops it over 100% against eth.
Cronos Eth
Cro seems to be another coin in a wedge against eth. The target this cycle is over 300% away from the current level.
ADA ETH
Oh, look, it is another coin in a bullish falling wedge against ETH. Sure reaching the previous ATH might take a decade or so, but that is a decade to favor ADA over eth.
Doge Meme Coin Versus Eth
Want to consider something that at first glance seem moronic or hilarious? Doge has the structure to 70x eth over the next couple of years.
Final thoughts
The Eth team has done a lot to make their system more affordable to use. As price goes down the ease of use goes up and the adoption goes up. Ethereum is in the process of turning itself into a volume trade and not a profit margin trade. That might be a good thing for cryptocurrency as a whole but I am chasing alpha. Crypto gives me more potential alpha than equities so I play here. If the alpha is leaving eth then I am going to leave as well, no matter how good it could be for the world or the ecosystem. Daddy can't pay for his girls food and clothes if he doesn't get that alpha.

Weak Technical Patterns Ahead of EarningsFor now, NYSE:GS the largest of the Financial Services companies left, is struggling a bit. Trading activity in this stock is well below its average at this time. No pre-earnings run patterns have developed yet. There is some rotation recently, with lower money flow.

GRPN Daily BullflagGRPN Daily Bullflag setup with upwards price targets of 15.50, 15.75, and 17.00
SL on breakdown of the bullflag

Bull markets with staples outperforming discretionaries?Well history says yes, as it has happened before
History also says that the times it happened it lasted for 10 to 16 months, and this time it has lasted for 11 months
The key here is that normally, when the $XLY/ AMEX:XLP ratio goes up then the SP:SPX goes up too, but this does not mean that the SP:SPX cannot continue its uptrend without the other going up
Sector rotation is the blood of bull market's heart.

Rotation Games: Endless FunMarket makers control and manipulate prices and they make money all day long day after playing these games.
MMs distribute shares they have accumulated at lower prices to retail traders and Joe Investor. We hold their bag!
Once distribution of one asset is accomplished, MMs then re-accumulate it and begin distribution of other assets.
You see the same movement in and out of R2K, the small caps play the same game. Notice on days when NQ100 is weak, RUT may be strong, will move up 1% when NQ goes off 1%.
Retail needs to understand when they buy these assets at inflated prices, they are bag-holding for big money players.

AMZN Under Pressure to Offer a DividendInventory adjustments are underway for $NASDAQ:AMZN. These adjustments are minor as Dark Pools are holding AMZN long-term, but there are other opportunities to boost ROI in younger companies.
AMZN needs to provide a dividend now that it is a Dow 30 stock. The mild rotation is a gentle reminder to the Board of Directors from their most critical and important investors, the Giant Buy Side Institutions. AMZN is the only fortune 500 company on the S&P500 that doesn't provide a dividend YET. The company's CEO is seasoned and aware that the Board must soon offer dividends, as it is no longer merely a "growth" company.
The pressure is increasing to force a dividend by the Giant investors. This should happen this year. There are no buybacks going on right now either. So the lowering of inventory is a warning to get this done. The Buy Side has the clout to influence the Board's decisions. This would benefit all investors big and small.
The support is at the lows of the red box on the chart, as indicated by the gap down white candle that quickly ended the previous selling by smaller funds.
WHEN, not if, AMZN announces a dividend, there is likely to be some brief momentum activity to the upside.

Buybacks vs. Rotation: JPM and AAPLMany companies are flush with cash right now, so buybacks are going to increase. Buybacks can create plenty of swing trading opportunities.
Buybacks are used by the Board of Directors to drive price upward, or at least maintain price at a certain level. They also remove outstanding shares from public exchanges. The Percentage of Shares Held by Institutions (PSHI) is based on outstanding shares. So with fewer shares outstanding, it can help PSHI hold at a certain level. The Buy Side has been lowering inventory this year. See red arrows on the JPM chart.
In 2018, Buybacks boosted the index components and kept the market from continuing a bear market, which was already underway--a minor bear not a major one. Then in 2019, buybacks surged as the government cut corporate taxes massively. The cash on hand was enormous for most companies so they did mega buybacks, leading the move upward for index components that year. Then, in 2020 the pandemic stock market collapse completed that very odd delayed bear market.
Buyback candles are frequently solid white without wicks or tails. Buybacks often initiate strong swing-style runs, such as they have in $NYSE:JPM. See the blue arrows.
NASDAQ:AAPL also announced a huge buyback program in early May. This gives the Buy Side Institutions the opportunity to lower inventories of AAPL too, without disturbing price much, if at all. AAPL is in a sideways trading range, which is a tough pattern to trade since there is no consensus about what the company is doing to fuel future growth.

Weakening Patterns: NVDANASDAQ:NVDA is over-speculated on the short-term and intermediate-term trends. It has minimal support nearby for holding for a position trade.
Without retail groups or smaller funds, the price action is weakening at this time. Nvidia doesn't report until May 22 which is very late in the season but for now, it has some minor rotation going on.
If it continues to hold above the black line, then it can pattern out the excessive price gains. This is not a strong sell short opportunity, but it is important to keep an eye on this stock for the next couple of weeks.

S&P Sector RotationAll major sectors are strong, confirming SPX strength. There are minor signs of weakness on some charts but nothing serious yet.

MCD: Buy on the dip risk for selling shortThis stock has dipped and slid through its support, which was not a strong support level. There is minimal support nearby. And the support above is now a moderate resistance level.
There was some mild rotation in the Volume Oscillator and Money Flow indicator patterns followed by pro traders selling.
The reversal candlestick pattern failed.
However, the risk for selling short is the retail investors and their investment group gurus advising to buy on the dip.
Today's candle has buy on the dippers in the mix.

S&P Sector rotationPut together information on what is happening in major S&P sectors
Majority of sectors are strong on the daily chart. There are some short-term problems on lower timeframe but they can be overcome.
This is good for buyers as it shows that money is not leaving the market but moving from one sector to another. A lot will depend on tech bulls. XLK must clear 212 resistance to help market move higher.
You can find my market overview here
AMEX:XLK AMEX:XLV AMEX:XLF AMEX:XLY AMEX:XLC AMEX:XLI AMEX:XLP AMEX:XLE

Bending Trends Can Warn of Institutional RotationThe Daily chart of NASDAQ:PANW shows a short term bend in the trend which is common when Giant Buy Side Institutions are in quiet rotation mode to lower inventory, attempting not to disturb price.
Also, Volume Oscillators and Money Flow indicate selling hidden mostly in price that is being carefully controlled.
The stock reports today. This doesn't mean that HFTs have this information nor does it mean that HFTs won't gap it up. It means IF you are holding this stock for a swing trade, risk has increased for a possible run or gap down.

Controlled Large Lot Selling Pattern: TMUSTelecom Industry stocks hit the wall of Market Saturation some time ago. NASDAQ:TMUS has a pattern that indicates a controlled selling mode of larger lots before the earnings report. There has been more volume to the downside and money is flowing out of the stock while the price action develops a narrow sideways range. Risk for a breakout to the downside is high.

What IBKR has in common with SPX? NOTHINGThis is abstract delusional thinking so don't pay attention i have made it just for fun purposes:
1)Burn all the shorts till EoY no pullback
2)Get longs in the first 2 weeks of the New Year
3)Burn all the longs till March Opex
4)Attract more shorts + create room for markets to run till Elections (societal euphoria adding fuel to the current party to win, historical behavior in an election year is in favor of longs)
5)No crazy ATH some prophets are claiming like 5700 or 6000! just enough to create momentum and then zombie mode up and down for the rest of the decade burning longs and shorts index remains at the same levels and passive investing is destroyed (take into account inflation more than +50% at the end of the Decade)
6)My range for 2023-203sh.. 5200-3200
7)2024 winners : small caps and China
8)constant rotation no new money to participate in the markets yet... we have printed too much!!! markets IMHO need to correct mostly in terms of time
9)active management will be the big winner of the decade and brokers' commissions %
10)have fun nobody knows what the market will do but you can control your money and risk management

Rotation Patterns in $CVXNYSE:CVX was the Dow 30 component that had the highest loss on Friday.
The chart clearly shows that the earnings report was not going to be good. The pattern is a failed bottom as there has been rotation to lower inventories of the stock for most of this year.
Declining Accum/Distribution indicators at the lows of the range followed by a negative divergence between the price trend and Accum/Dist are indicative of rotation within the sideways trend that never developed into a bottom.
Another Relational Technical Analysis tip to watch out for in other stocks, especially ahead of earnings reports.

GS Earnings and Institutional HoldingsNYSE:GS has had a sudden huge decline in its Institutional Holdings from last quarter--a whopping 12%. That's huge. This suggests that often the selling is from Buy-Side Institutions.
Goldman Sachs has a buyback program of 30 billion dollars underway, approved end of February 2023. The Buybacks started in March and have continued until recently. I showed the buyback activity on the daily chart in this article earlier this month.
The Support from corporate buybacks poses problems for selling short. The stock is also prone to HFT triggers with frequent gapping. The first Support level is just above the 2022 lows.
The company reported earnings this morning and gapped down at open but is holding onto the sideways range it's been in for 2 weeks so far.
However, Quarterly and Annual Reports are starting to show signs of weakness as this company struggles to reinvent.
NYSE:GS is also facing loss of revenues from IPO underwriting as the NASDAQ Private Market is undermining the high income usually generated from IPOs by underwriters.
IMO, the investment banking industry is slowly becoming obsolete as DeFi, Fintech, Blockchain technologies and Crypto currencies continue to advance and erode traditional revenue streams.

Dow Jones Industrials suddenly not looking too shabbyThe Dow Jones has been out on vacation for the first half of this year, not really participating in the melt-up, and instead, consolidating and working off that sharp rally from Q4 2022.
After all, it was one of the first indexes to bottom from the depths of the bear and start leading things higher.
But now after all of this sideways consolidation, it's starting to offer up a favorable reward-to-risk if it can build momentum over 34,500.
Perhaps a possible rotation into YTD leaders and back into industrials for the second half of the year? I'm not so sure about that yet, but it's a chart worth paying attention to.

$XLE vs $SPY: Rotation back into oil stocksI think this is the play right here, right now...Might be a nice swing to the upside for oil names, specially relative to the market.
Best of luck!
Cheers,
Ivan Labrie.
