Price is being rejected by a support zone and the RSI is oversolVery similar conditions to AUDUSD at this moment... aditionally the yearly, quartely and monthly pivots are upside... thinking long this pair.
Rsioversold

GBPJPY STRONG SUPPORT CHANNEL AND HIDDEN DIVERGENCE Strong support channel from last 15+ days , tested multiple time now price came and stopped and consolidating on strong support channel, i can also see hidden strong divergence on same support channel which is tested for the 5th time and past 15+ day

EURUSD possible Long opportunityThe EURUSD is hitting recent Support area and Support line that has been created in the last month. Combined with the almost Oversold RSI and crossed MACD, this makes a great chance that the price will reverse and go bullish. I would suggest to move your stop below the last Support area and placing your limit below the Resistance line that has been created in the last 5 months.

The importance of oversold RSI to play a buyer reboundSince 2012, Bitcoin has found itself in an oversold zone with an RSI 14 < 30 only twice:
- from January 06 to 17, 2015, bullish rally with a bullrun from January 13, 2015 to December 16, 2017
- from November 13, 2018 to December 16, 2018: ongoing rebound with an RSI 14 suddenly gone from a value of 28 (<30) to 48 today
Focus on January 12, 2015:
The December 15, 2018 could well mark the lowest point of this bear market that has spread throughout the year 2018: in other words, never see BTC below the $ 3,000 mark?
However, we must remain vigilant for some time because we can not exclude the spectrum of the bull trap by dead cat bounce known on the rebound of September 29, 2014 before 3.5 months of additional bear market until the real bottom of January 12, 2015.
But the RSI 14 at the bottom of the September 29, 2014 had grazed the value of 30 without descending lower, contrary to January 13, 2015 and ... December 10, 2018!
The RSI 14 should not be considered as gospel word, but it converges today with other signals such as the Fibonacci retracement used in my previous idea which also announced an end of bear market imminent, so very encouraging to play the rebound to the purchase!
Also keep in mind that following the January 12, 2015, which was certainly the ultimate purchase point of entry, it took almost the whole year 2015, 10 months of horizontal corridor oscillating between 200 and 320 $ ( "range"), before entering the real bullrun 2016-2017.
Finally, the psychological dimension of a market is in my opinion primordial and trade!
Indeed, the RSI14 is not a crystal ball that predicts the future, but when the price drops and breaks a support, that the RSI sinks under the 30 as these days, it is likely that many of investors will play the rebound when the RSI will head over the 30 as today! These are called self-fulfilling phenomena, self-fulfilling prophecies: everyone sees the same thing and reacts sheepishly.
This mimicry stock market is interesting to exploit precisely on psychological zones.
WARNING:
This is not an investment advice.
Only invest what you are willing to lose.
Do not listen to any "prophet", only rely on your own opinion.

Get ready to bounce! Morning All,
Bitcoin has been following a channel since the drastic fall from $6480 and is now showing bullish divergence on the 4H RSI and if you look at the daily, RSI(14) is sitting at around 10-11 which is exceptionally oversold in this extended trend. MACD is starting to looking for a cross to the upside, StochRSI is oversold and price has just tested the bottom of the channel which gives credence to a move towards the channel resistance and a temporary bottom. I may be a bit quick to the trigger assuming that price won't drop lower than the $4656 but we have bullish divergence on the 1H and 4H charts and the move to the $4656 low was quickly succeeded with a bounce back to $4754 which took the 4H candle back inside the channel support. Bearish volume spikes are also gradually starting to taper off slightly.
This gives us a decent trade setup if this is the temporary bottom. Buy the breakout above the channel resistance around $5100 (23.6 fib) set stop loss just below the channel support and recent low at around $4645. The market is still weak and over-reactive so I'll be taking profit partially on the way up. I suspect bitcoin will reach the 61.8 fib target around $5780 which coincides with MA50 on the 4H chart. Keep an eye on price at levels around $5800 because if price moves above MA50 and MA50 acts as support, then the next target should be $6090 at 78.6 fib retracement.
If price drops from channel resistance or below the $4654 low and triggers stop loss below channel support at $4645 then I expect the price to drop for another wave down to around $4300.
Good luck and happy trading!
Previous post:

Amazon Macd RSi StochVery good opportunity to buy 10 minutes period after Stoch 20. You can see. I used my mentorprogram with 3 indicators. Rsi had a signal upper 40 . Macd showed paralel blue and red lines.
This is last 20 seconds when 3 dollars rebounded. But I won on these positions 5 times 40 euro and 60 euro lost.

Bullish Gartley + Support level + Trend + RSI confluenceWe are some hours /minutes away from the completion of a bullish gartley.
The trend had been bullish since a while back and therefore we are in line with the trend.
The RSI is heading to around 30 meaning Natural Gas has been over sold (at least in the one hour time frame) in which case we should be looking for buying opportunities.
Entry price, stops and take profit levels are as per the chart.
Disclaimer: All this confluence only give us an edge and not a sure bet.
Never risk funds you are not ready to lose.
Make sure to have your stops placed.
Anything can happen in the market.
Let's see how this plays out.

Silver: The Possibility of BounceHere is my mid-term analysis for Silver. After big fall of value there is a chance for LONG. I will describe why.
The truth is, that Silver broke the long uptrend trendline downwards. Similarly, on the chart was building up a Descending Triangle, which was also broken downwards. This is not good signs for Silver, but there is a possibility of breath.
The marked zone is really strong area, where the price bounced in the past. I don't expect the same boom as before, but i guess there should be a little retrace. The market is really strong OVERSOLD according to RSI, from daily, 3D and weekly chart. We are are far-away from EMA, so there should be a little pull-back. When i look at the chart from Mid-term, i think there could be a pull-back to our targets, because the market is really oversold. We are in the biggest oversold zone on RSI from July 2013. The values, when i expect we can go, will be our targets.
From long-term, the market can make lower value, because Trendline has been broken, triangle also and that is reason, why we have set out SL. But now, i expect a pull-back.
Here are my instructions:
BUY ZONE : 13.48 - 14.15
TARGETS (TP) : 1) 14.49
2) 14.98
3) 15.40
SL: 12.90
if the market developed well, i would think about bigger targets. Maybe there will be a bigger bounce and it can really happened (i will keep you informed). This is just my point of view, not an investing advice. Trade carefully.

EOS/BTC- Trendline could push the value upEOS/BTC is now trading near the strong support area. Currently 70 percent FibboRetracement. The next strong bullish signal is long-term trendline supporting the levels below. This time, there is chance for a reversal on the market (EOS/BTC).
We can see, there is building up Falling wedge, which is also bullish signal. We are waiting for break. Currently we are attacking the up trendline of Falling wedge. The market broke this trendline. But there is still not confirmation. We need at least one day candle close above this pattern. But now, it seems positive.
Indicators seems good. Bear power is still negative, but it is raising up. Now we can see bullish divergence on this indicator. RSI is maximal OVERSOLD, but there is a trendline we need to break for another rally (up). On the other side i have to say, we are in strong downtrend from weekly and daily chart, but now, there is a possibility for reversal more than ever. If we break this strong trendline we could test previous bottom.
This is just my point of view, I'm not responsible for your loss. It is your own risk.
4H Chart is looking good.
Here is my opinion for trade:
BUY ZONE: 0.0009100-0.0010
TP: 1) 0.0010600
2) 0.0011
3) 0.0012
SL: 0.0008700

LTC RSI OversoldLitecoin has gone down very quickly, and a oversold bounce may occur. The RSI is at 15, and there is a mini double bottom. However, I'm not suggesting a long term bull market, just a short term bounce since Litecoin did break down from a huge descending triangle.

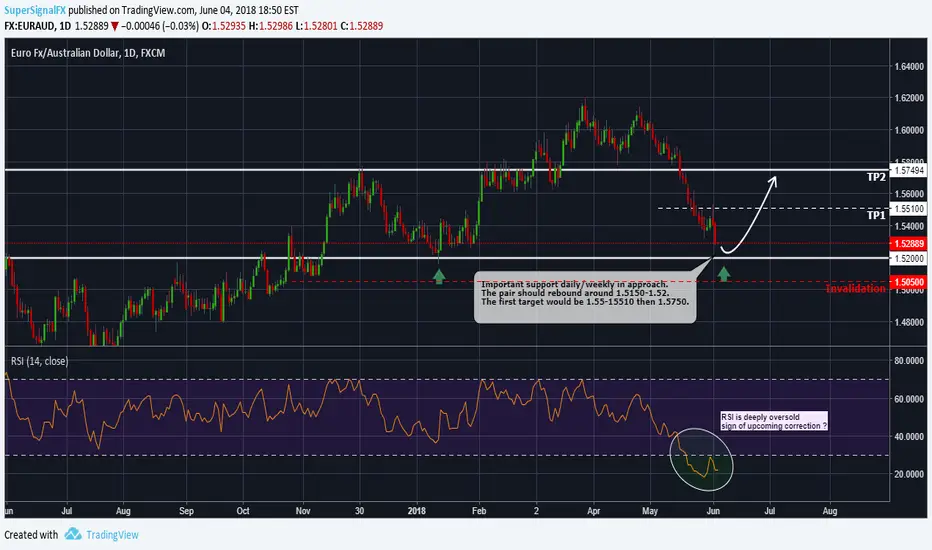
EURAUD - Forecast and technical setup for the next daysHi guys, I share with you my technical setup for EURAUD for the next days.
The chart speaks by itself.
If you find it useful please hit the like/follow button and leave a comment :)
Happy trading!
Don't worry DGD, soon you'll get betterStudy case for RSI , we have a falling wadge on the daily timeframe . StochRSI shows we're going down a bit more, maybe 10% more. Until now we have touched the first out of three main support levels, which are closely to one another. Don't panic if you bought earlier, buy more now and wait for the bounce. DGD 0.00% announced big news with it's child coin DGX -1.34% , backed by gold -0.17% , and no reason to worry. Many coins in the market have dumped hard in the last days, but this means that many people are filling up their bags at good prices and getting ready for the next wave, similar to two weeks ago.
Enjoy trading and stay calm, don't over trade and stick to your plan.

Daily Oversold target6500 provided the expected small support.
More support just above 6000, which should provide a bounce off the bottom of the triangle.
If the top of the triangle provides enough resistance BTC will drop to 5400 for a larger bounce.
This is all somewhat subjective and many clarifications and checks need to be seen before trading. It could go either way and it could be big, or small. Not a time to take risks.
I'll be keeping an eye on the daily RSI, watching for an oversold opportunity to coincide with other signals.
Caveat: I am not a professional trader or adviser. Do your own research before making any trade. Never trade more than you can afford to loose.

Bullish Gartley & Falling Wedge & Oversold RSIVTC is a very underrated coin. It has a great team working hard and great future up ahead. Price is a real joke atm.
Bullish gartley is just about to be formed. RSI is oversold on daily (never been that low for a long long time). You can see also a nice falling wedge.
So VTC has to go up where it's belong.

GbpUSD, Gartley bearish : D point hit. 3hour TMD point complete, let's get Down.
3 hour time frame.
Targets 1: 1.38860
Targets 2: 1.38185
Stop loss: 1.40820
RSI: oversold.
Let's get Down.

EURAUD 15M RSI 80-20 TRADING STRATEGYThis trade is from our free pdf "RSI 80-20 TRADING STRATEGY"
PM me if you have any questions, I will be happy to help.

ETH Correction Almost Over Ethereum is completing the final wave of an ABC correction. In fact, it's on the 5th subwave of wave C. It is only a matter of time before Ethereum starts impulsing. In addition, we see bullish divergence, and the volume picking up.
This correction is only temporary, and we need to take a look at the big picture to see how high Ethereum can rise to. We should not panic on these corrections as this will only look like a dip once the price starts impulsing. We have not yet completed the fifth and final wave. Due to the bullish nature of cryptocurrencies, the fifth wave often exceed our targets.
Entry: $600-$750
Stop: $400
Conservative Target: $1600
Expected Target: $1900
Aggressive Target: $2000+
Time: Up to 5 months

DGBBTC 5 Elliott Impulse Wave scenarioWhen the Triangle was broken upward we saw Elliott Correction wave which is a pink line A-B-C on the chart. An impulse growth usually heads after this pattern. Stoch RSI indicates oversold zone, moreover fundamentals are also great. The possible scenario is represented by 5 Elliott impulse wave, it is a long hold but profits are also great. Safe buy zone is below 0.00000500, while stop loss is below 0.00000425.

#APPC is very bullish#APPC is clearly bouncing within the triangle and is beginning to consolidate. RSI and Stoch are very bullish indicating a coming uptrend. MACD is also ready to cross over. AppsCoins is also very popular among the crypto community and is receiving a lot of hype from whales. Expect it to bounce within the triangle and break out soon. My bags are filled.

CAD/CHF long oppunity guys we find cypher pattern on cad/chf it is nice opportuinty to go long with the confluence of 200 EMA and with RSI over sold
if its complete look for buy setup at point D
stop below X level
i will update you ........
regards:
HAMZA MALIK

BTC : Time to Open some Long Positions!Hello guys,
Bitcoin is heading toward the last stage of it's correction. It looks like it is following an ABC / Complex correction, that it is going to momentarily brake support* before it starts a new market cycle towards 30k+ after it brakes resistance**
So, using Bitmex I am putting lots of small buy orders between 11000-12500 and I keep my liquidation price below 7k
Have fun and stay profitable! If you find these information useful please don't hesitate to donate some bitcoin!
* Support in this case is
1) the long lasting previous resistance bitcoin was following since October 2016 (pink line)
2) the exponential moving average (length = 60, source = low, offset = 0) which is working almost perfectly as a support, since Bitcoin's recovery at late 2015 (thick blue line). The arrows are pointing all the times BTC went below this line.
3) the red line which is the average price of the previous trend that lasted for about 10-11 months
These 3 supports are keeping the price between 10800 and 12300 usd
Now if the price goes further down (low probability) the next strong support level is waiting approximately at 8500 usd.
That is why I suggest that if you place a long position o btc keep you liquidation price below 7k
** the resistance at this instance is the first mustard lines which is an "ancient" trend line coming from the "early days" of late 2011 to early 2013 and it was working as a reliable support. It's strong significance got reaffirmed when it was broken at early 2015 and by mid to late 2015 a new market cycle had began.
In addition the RSI s appear to have some more room downwards.

Possible AB=CD pattern on Bitcoin/DollarBefore heading into the new years it seems like the Bitcoin dollar is potentially forming a bearing AB=CD formation. Still waiting for it to be confirmed with structural and RSI levels which form part of my personal strategy. Again, nothing is confirmed yet. Therefore, take action when the chart gives you assurance but this is definitely a pattern to keep your eyes on.
Happy New YEARS!

#REP is below the bottom#REP is so low I cannot believe it. It is so low that I couldn't even find a support line. All the technicals point to this coin popping very soon. It will break out of the triangle and spike greatly very soon. RSI is bullish and MACD is ready for a crossover. Anyone with a brain can tell this coin will come up.
