NASDAQ formed its 1st 4H Golden Cross in 7 months!Nasdaq (NDX) completed last Friday its first 4H Golden Cross formation in more than 7 months (since May 01). This is taking place while the index is inside a Channel Up, making a V-shaped recovery from the November 21 Low.
The last time all the above conditions were fulfilled was exactly during the May Golden Cross. With the 4H MA200 (orange trend-line) as its Support, the index eventually hit its previous All Time High (ATH).
As we've entered the Fed week, we can finally see this move to the ATH Resistance, so our short-term Target on Nasdaq remains 26200.
---
** Please LIKE 👍, FOLLOW ✅, SHARE 🙌 and COMMENT ✍ if you enjoy this idea! Also share your ideas and charts in the comments section below! This is best way to keep it relevant, support us, keep the content here free and allow the idea to reach as many people as possible. **
---
💸💸💸💸💸💸
👇 👇 👇 👇 👇 👇
Signals

GBPAUD Will Go Higher From Support! Long!
Please, check our technical outlook for GBPAUD.
Time Frame: 4h
Current Trend: Bullish
Sentiment: Oversold (based on 7-period RSI)
Forecast: Bullish
The market is approaching a key horizontal level 2.007.
Considering the today's price action, probabilities will be high to see a movement to 2.020.
P.S
We determine oversold/overbought condition with RSI indicator.
When it drops below 30 - the market is considered to be oversold.
When it bounces above 70 - the market is considered to be overbought.
Like and subscribe and comment my ideas if you enjoy them!

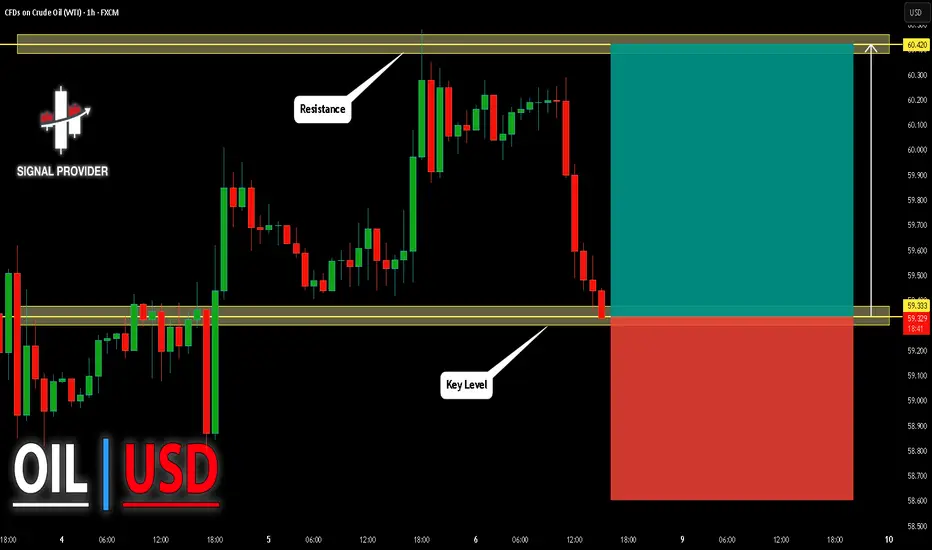
USOIL Will Go Up From Support! Buy!
Here is our detailed technical review for USOIL.
Time Frame: 1h
Current Trend: Bullish
Sentiment: Oversold (based on 7-period RSI)
Forecast: Bullish
The market is approaching a significant support area 59.333.
The underlined horizontal cluster clearly indicates a highly probable bullish movement with target 60.420 level.
P.S
Overbought describes a period of time where there has been a significant and consistent upward move in price over a period of time without much pullback.
Like and subscribe and comment my ideas if you enjoy them!
LITECOIN can easily hit $43 in the next 10 months.Litecoin (LTCUSD) started its new Bear Cycle after a rejection on the 4-year Lower Highs trend-line. Now that it sits below its 1W MA200 (orange trend-line), which was formally a Resistance during the Bull Cycle, we can claim that the next stage should be targeting the Higher Lows 1 trend-line.
Given that all previous Bear Cycles lasted for at least a year and that the last one dropped less than the 2018, we can expect LTC's new Bear Cycle to last up until August 2026 at least. Even a 'modest' decline should still see it targeting Higher Lows trend-line 2, which by the end of August 2026 should have hit $43.00 at least.
---
** Please LIKE 👍, FOLLOW ✅, SHARE 🙌 and COMMENT ✍ if you enjoy this idea! Also share your ideas and charts in the comments section below! This is best way to keep it relevant, support us, keep the content here free and allow the idea to reach as many people as possible. **
---
💸💸💸💸💸💸
👇 👇 👇 👇 👇 👇

Trading Global Assets: An Overview1. Types of Global Assets
Global assets can be broadly classified into several categories:
Equities (Stocks): International stocks allow investors to participate in the growth of companies worldwide. For example, investing in technology firms in the U.S., consumer goods companies in Europe, or emerging market businesses in Asia can provide diversified exposure to global economic trends. Stocks are typically traded on exchanges like the NYSE, NASDAQ, London Stock Exchange, or Tokyo Stock Exchange.
Bonds: Sovereign and corporate bonds issued by foreign governments or companies offer opportunities for income generation and portfolio diversification. For instance, U.S. Treasury bonds are considered safe-haven assets, whereas emerging market bonds may offer higher yields but higher risks.
Currencies (Forex): The foreign exchange market is the largest financial market in the world, with daily trading volumes exceeding $6 trillion. Investors trade currency pairs, such as EUR/USD or USD/JPY, to speculate on exchange rate movements or hedge against currency risks. Forex trading is highly liquid and operates 24 hours, providing constant opportunities for global traders.
Commodities: Gold, oil, silver, and agricultural products are traded globally through futures and spot markets. Commodities are influenced by global supply-demand dynamics, geopolitical tensions, and economic growth trends. For instance, oil prices may react to conflicts in the Middle East, while gold often acts as a safe haven during financial instability.
Derivatives: Options, futures, and swaps allow investors to speculate on the price movement of underlying global assets or hedge existing positions. For example, currency futures can protect multinational companies from adverse currency fluctuations, while equity derivatives can help traders leverage their market positions.
ETFs and Mutual Funds: Global exchange-traded funds (ETFs) and international mutual funds pool investor capital to invest in multiple international assets, providing diversification with relatively lower costs. These funds can focus on specific countries, regions, sectors, or themes, such as emerging markets, technology, or green energy.
2. Benefits of Trading Global Assets
Trading global assets offers several strategic advantages:
Diversification: Investing in multiple countries reduces reliance on a single economy or currency. For example, if the U.S. market underperforms, gains in Asia or Europe can offset losses.
Growth Opportunities: Emerging markets often experience higher growth rates compared to developed economies, offering potential for higher returns.
Hedging Against Domestic Risks: Global investments can protect portfolios from domestic inflation, interest rate changes, or political instability. For instance, holding foreign bonds or currencies may offset domestic stock market volatility.
Access to Innovative Sectors: Some sectors or companies may be dominant in specific regions, such as technology in the U.S., renewable energy in Europe, or manufacturing in China. Global trading allows investors to access these growth drivers.
3. Challenges and Risks in Global Asset Trading
While the opportunities are compelling, trading global assets carries specific risks:
Currency Risk: Investments denominated in foreign currencies are exposed to exchange rate fluctuations. A strong domestic currency can erode returns when foreign earnings are converted back.
Political and Regulatory Risks: Changes in government policies, regulations, or trade restrictions can impact asset prices. For instance, sudden capital controls in an emerging market can limit liquidity and access to investments.
Market Liquidity and Volatility: Some global markets, especially in developing countries, may have lower liquidity, leading to higher volatility and transaction costs.
Time Zone Differences: Global trading requires monitoring markets across different time zones, which can be challenging for individual traders. Major market sessions in New York, London, Tokyo, and Sydney affect liquidity and price movements.
Economic and Geopolitical Factors: Global macroeconomic events, such as interest rate changes, recessions, or conflicts, significantly influence asset prices. Commodity-dependent economies, for example, are vulnerable to fluctuations in oil or metal prices.
4. Trading Strategies for Global Assets
Investors and traders employ various strategies to navigate global markets:
Fundamental Analysis: Evaluating macroeconomic indicators, company earnings, interest rates, inflation, and geopolitical conditions helps investors identify undervalued assets and long-term growth opportunities.
Technical Analysis: Traders use price charts, trends, and technical indicators to forecast market movements. Technical analysis is particularly common in currency, commodity, and equity trading.
Arbitrage: Exploiting price differences of the same asset across multiple markets can generate risk-free or low-risk profits. For example, currency or commodity arbitrage takes advantage of exchange rate discrepancies.
Hedging: Corporations and institutional investors use derivatives like options, futures, and swaps to protect against price fluctuations, currency volatility, or interest rate changes.
Thematic and Sectoral Investing: Targeting specific global trends such as renewable energy, artificial intelligence, or emerging market consumerism allows investors to capitalize on long-term growth themes.
5. Role of Technology in Global Trading
Advancements in technology have revolutionized global asset trading:
Electronic Trading Platforms: Online brokerages and trading platforms enable retail and institutional investors to access international markets instantly.
Algorithmic Trading: Automated trading systems analyze market data and execute trades based on pre-set rules, improving efficiency and reducing emotional bias.
Mobile and Cloud Technology: Traders can monitor portfolios, execute orders, and analyze markets from anywhere in real-time.
Data Analytics and AI: Advanced analytics provide insights into market trends, risk management, and predictive modeling for better decision-making.
6. Regulatory Considerations
Trading global assets requires understanding and compliance with international laws and regulations. Each country has specific rules regarding foreign ownership, taxation, reporting, and trading practices. Regulatory bodies, such as the U.S. Securities and Exchange Commission (SEC), European Securities and Markets Authority (ESMA), and local central banks, govern trading activities to ensure transparency and investor protection. Investors must also be aware of tax implications for capital gains, dividends, and foreign income.
7. Conclusion
Trading global assets opens a world of opportunities for diversification, growth, and risk management. It allows investors to participate in the performance of companies, currencies, commodities, and financial instruments across continents. However, it requires careful consideration of risks, including currency fluctuations, geopolitical instability, regulatory differences, and market volatility. A well-structured approach—combining fundamental and technical analysis, leveraging technology, and adhering to risk management principles—can help investors navigate the complexities of global markets successfully.
In the modern financial landscape, globalization, technology, and innovative financial instruments have made global asset trading more accessible than ever. For long-term investors, it offers exposure to growth engines around the world. For traders, it provides opportunities to capitalize on short-term market inefficiencies. Understanding the dynamics of global economics, market psychology, and risk management is essential for anyone aiming to succeed in this interconnected financial ecosystem.

BTC 87K LOWS ARE VITAL FOR THE BULLS NOWMorning folks,
So, the pullback that we discussed has happened, although it was a bit deeper - right to ~87.75-88K area, while we were talking about 89-90... anyway, the bounce up happened and currently this 87-87.5K is becoming critical for the bulls.
Downside breakout significantly will increase chances to return back to 80K. But at the same time, it means that it is easy to consider a long position. If you think about it - you can buy at some pullback against 87.5 lows.
If you already bought, think about moving stops to breakeven levels.
As our big upside AB=CD pattern is still valid, we keep intact our 96-97K target.

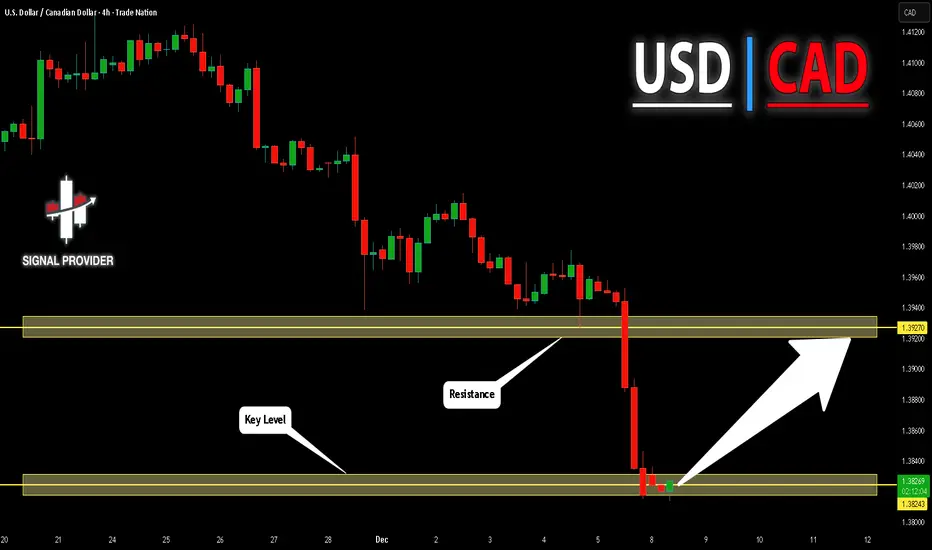
USDCAD Will Go Higher! Long!
Take a look at our analysis for USDCAD.
Time Frame: 4h
Current Trend: Bullish
Sentiment: Oversold (based on 7-period RSI)
Forecast: Bullish
The market is on a crucial zone of demand 1.382.
The oversold market condition in a combination with key structure gives us a relatively strong bullish signal with goal 1.392 level.
P.S
Please, note that an oversold/overbought condition can last for a long time, and therefore being oversold/overbought doesn't mean a price rally will come soon, or at all.
Like and subscribe and comment my ideas if you enjoy them!
EURAUD Will Go Down! Short!
Please, check our technical outlook for EURAUD.
Time Frame: 1h
Current Trend: Bearish
Sentiment: Overbought (based on 7-period RSI)
Forecast: Bearish
The price is testing a key resistance 1.756.
Taking into consideration the current market trend & overbought RSI, chances will be high to see a bearish movement to the downside at least to 1.750 level.
P.S
The term oversold refers to a condition where an asset has traded lower in price and has the potential for a price bounce.
Overbought refers to market scenarios where the instrument is traded considerably higher than its fair value. Overvaluation is caused by market sentiments when there is positive news.
Like and subscribe and comment my ideas if you enjoy them!

GOLD ANALYSIS 12/08/20251. Fundamental Analysis:
a) Economy:
- USD:
• The USD continues to weaken due to more dovish comments from the Fed and growing expectations of early rate cuts in 2026.
• U.S. Treasury yields are falling, putting additional pressure on the USD and supporting gold.
- U.S. Stock Market:
• U.S. equities saw a slight correction after a strong rally, mainly due to end-week profit-taking.
• However, the overall trend remains risk-on, preventing gold from breaking out but also limiting the downside.
- Federal Reserve:
• Expectations of 2–3 rate cuts in 2026 are increasing.
• Recent weaker labor data → strengthens the view that the Fed will shift toward easing, supporting gold in the mid-term.
- Trump Administration:
• The Trump administration prioritizes tax cuts and growth stimulus → could temporarily strengthen the USD → short-term negative for gold but positive in the long-term.
• At the same time, unpredictable policies increase geopolitical risks → benefiting gold.
- Gold ETF – SPDR:
• On December 5, SPDR sold 0.33 tons as a test; the probability of continued selling is high → watch out for unexpected drops.
• This is a very important bearish factor, especially while the market is waiting for major news.
b) Politics:
• Tensions in the Middle East continue to escalate step by step → providing support for gold.
• Russia–NATO tensions persist; Ukraine is preparing for winter warfare → adding safe-haven demand.
c) Market Sentiment:
• Slightly risk-on sentiment dominates, but defensive gold buying remains steady.
• Capital is waiting for attractive price zones to buy, after the drop and technical rebound on December 5.
2. Technical Analysis:
- On the 15m timeframe:
• Price is retesting the ascending trendline support + demand zone at 4193.
• RSI is oversold and forming mild bullish divergence, signaling weakening selling pressure.
• Structural expectation: gold may dip one last time before bouncing strongly, fitting a retest-trend pattern.
- Main scenario:
→ Form a bottom around 4193 → move sideways → break 4219 → rise toward 4239–4263 in the next session.
Early buy setups expected tomorrow morning, December 8.
RESISTANCE: 4,219 – 4,239 – 4,263
SUPPORT: 4,193 – 4,174 – 4,163
3. Market Review (Dec 5, 2025):
• Gold dropped sharply by 70 dollars and remained flat at the bottom — something not seen recently.
• RSI oversold but no confirmed reversal signal yet.
• This could be the final move of the downtrend, preparing for accumulation and an upward cycle.
4. Strategy for Today (Dec 8, 2025):
🪙 SELL XAUUSD | 4234 – 4232
SL: 4238
TP1: 4226
TP2: 4220
🪙 BUY XAUUSD | 4168 – 4170
SL: 4164
TP1: 4176
TP2: 4182

Lingrid | GOLD Weekly Analysis: Calm Before the Fed-Driven StormOANDA:XAUUSD price action this week has been a masterclass in consolidation, trading in a tight, choppy range just around $4,200 technical level. This sideways movement is not a sign of weakness but rather a necessary pause after the recent parabolic rally, allowing traders to digest gains and build fresh momentum. The market has found a solid floor at the $4,150 zone, which now acts as a formidable support barrier. Looking ahead, the path of least resistance remains upward; a decisive break above the current congestion zone opens the door for a powerful retest of the all-time high region, with a clear target of $4,285 if bullish conviction returns.
The 4H chart shows the intricate battle between buyers and sellers. We can see a clear sideways move formed within a broad channel, bounded by an ascending support line and a descending resistance line. The presence of a swap zone around $4,150 indicates heavy institutional activity, where large positions are being exchanged, often preceding significant moves. The downward-sloping trendline acts as immediate support; a clean rejection would signal the end of consolidation and the start of the next leg up.
Fundamentally, all eyes are on the upcoming FOMC meeting and the Federal Reserve’s next move on the Federal Funds Rate. Any hint of a prolonged “higher for longer” stance could pressure gold short-term, while dovish signals or acknowledgment of cooling inflation may ignite a breakout. Until then, the market is likely to remain range-bound, as participants refrain from aggressive positioning ahead of the Fed’s guidance. The weekly doji candle underscores this indecision, suggesting that volatility is coiling for a post-statement directional move—most likely to the upside if the Fed softens its rhetoric.
If this idea resonates with you or you have your own opinion, traders, hit the comments. I’m excited to read your thoughts!

EUR/USD Is Walking Into a Trap: Liquidity Sweep is coming!Price Action & Structure
The current structure shows a corrective rally unfolding within an ascending channel (green dashed lines).
Price action is printing higher highs without fresh momentum, a typical sign of “distribution during a pullback.”
The market is now trading in the upper half of the channel, approaching a daily premium zone just below 1.1700–1.1750.
Daily RSI sits around 60–65, which aligns with an extended pullback, not the beginning of a true bullish trend.
COT Analysis
EUR Futures (CME)
Large speculators are increasing shorts more aggressively than longs → bearish reading on the euro.
Commercials
Commercial traders are adding longs while reducing shorts.
→ This is classic hedging behavior during extended bullish corrections.
USD Index COT
Non-Commercial:
Positioning shows speculators are covering USD longs, but not turning bullish on the euro.
This suggests a temporary squeeze, not a structural trend reversal.
Retail Sentiment
70% SHORT EUR/USD
30% LONG
Retail traders are heavily short and consistently squeezed during upside moves.
This is a classic setup for a fake bullish rally into premium zones, after which larger players typically reverse price.
EUR/USD Seasonality (December)
December is statistically bullish, with average performance between +0.8% and +1.4%.
Seasonal curves show a rise into mid/late December, followed by:
→ a pullback near month-end
→ a bearish setup after January 3rd (typical early-year USD strength)
Thus, the current rally aligns perfectly with seasonality:
December rally → distribution → January drop.
Conclusion
EUR/USD is completing a structural bullish pullback, not forming a new bullish trend.
The move toward 1.1700–1.1750 looks like:
✔️ a liquidity grab
✔️ seasonal pump
✔️ exhaustion before reversal

Lingrid | EURUSD Trend Continuation Pattern Break Confirmed ?FX:EURUSD perfectly played out my previous trading idea . Price has broken above the descending trendline and the flag formation, confirming renewed bullish momentum within the broader upward channel. Price defended the higher-low area near the channel support and reclaimed the mid-range zone, signaling strong buyer control after consolidation. The structure now favors continuation rather than rejection, with momentum gradually building.
As long as price holds above the 1.1640 support range, buyers remain in control and the pair can rotate higher toward the 1.1700 resistance band. A clean push through this level would open space for further extension along the ascending channel, while shallow pullbacks are likely to be absorbed.
➡️ Primary scenario: structure holds → continuation toward 1.1700.
⚠️ Risk scenario: break below channel exposes a deeper retracement into the lower support zone.
If this idea resonates with you or you have your own opinion, traders, hit the comments. I’m excited to read your thoughts!

BTCUSDT.P - December 8, 2025Bitcoin is stabilizing after a prior downside leg and is now trading in a broad consolidation just above the highlighted mid-range support band around 88,500–90,000, with a clearly defined resistance zone at 97,000–98,000. A break and sustained close above that resistance would confirm a bullish continuation toward the projected 105,000–106,000 area, with invalidation below the 93,300 stop region. Conversely, rejection from resistance followed by a loss of the 88,500–90,000 support band would reassert the broader downtrend and open the way for a deeper move toward the lower 80,000s.

Bitcoin – Selling Pressure Rises as the Downtrend FormsHello everyone,
Bitcoin is showing a clear corrective leg on the H4 timeframe after failing to sustain the bounce near 94,000 USD. Price sliced through the closest FVG and retreated back to the 88,500–89,000 USD demand zone, signalling that buyers are present but not strong enough to shift the structure. The overall technical picture now leans towards a short-term bearish trend, with the spike to 96,000 acting merely as a liquidity grab before sellers resumed control.
BTC has already formed a lower high at 94,000 and confirmed a new lower low by breaking the lower FVG, fully activating the short-term downtrend. The Ichimoku cloud has turned red and thickened, creating a strong barrier between 90,500–92,000 that continues to reject every recovery attempt. Buy-side volume also remains noticeably weaker than sell-side activity, reflecting defensive rather than aggressive bidding.
On the fundamental side, Bitcoin remains under pressure as the US Dollar Index (DXY) rebounds and US Treasury yields climb, drawing short-term flows away from crypto. With markets now anticipating NFP and PCE data, caution dominates; historically, BTC tends to soften before major macro releases as traders avoid adding risk.
Let’s see how BTC reacts once the data hits — this move may determine whether the correction deepens or stabilises.

EUR-GBP Free Signal! Buy!
Hello,Traders!
EURGBP has tapped into a horizontal demand area after sweeping sell-side liquidity beneath prior lows, forming an SMC accumulation structure that favors a corrective move toward the upper buy-side target.
--------------------
Stop Loss: 0.8718
Take Profit: 0.8750
Entry: 0.8734
Time Frame: 6H
--------------------
Buy!
Comment and subscribe to help us grow!
Check out other forecasts below too!
Disclosure: I am part of Trade Nation's Influencer program and receive a monthly fee for using their TradingView charts in my analysis.

USD-JPY Bullish Bias! Buy!
Hello,Traders!
USDJPY has tapped into a horizontal demand area after taking sell-side liquidity beneath recent lows, forming an SMC accumulation setup that favors a corrective push toward the next buy-side target above. Time Frame 6H.
Buy!
Comment and subscribe to help us grow!
Check out other forecasts below too!
Disclosure: I am part of Trade Nation's Influencer program and receive a monthly fee for using their TradingView charts in my analysis.

NZD-USD Will Fall! Sell!
Hello,Traders!
NZDUSD is reacting from a horizontal supply area after sweeping buy-side liquidity sitting above previous swing highs, forming an SMC distribution setup that favors a corrective move toward the next inefficiency and demand pocket below. Time Frame 5H.
Sell!
Comment and subscribe to help us grow!
Check out other forecasts below too!
Disclosure: I am part of Trade Nation's Influencer program and receive a monthly fee for using their TradingView charts in my analysis.

SILVER: Bearish Continuation & Short Trade
SILVER
- Classic bearish pattern
- Our team expects retracement
SUGGESTED TRADE:
Swing Trade
Sell SILVER
Entry - 58.349
Stop - 58.743
Take - 57.644
Our Risk - 1%
Start protection of your profits from lower levels
Disclosure: I am part of Trade Nation's Influencer program and receive a monthly fee for using their TradingView charts in my analysis.
❤️ Please, support our work with like & comment! ❤️

EURUSD | Into The Next WeekLooking for a bullish continuation into the next week for both EURUSD and GBPUSD. Both looking strong.
I have 2 best case possibilities shown on the chart.
we either see a direct move to the upside, will be looking for bullish setups for the rest of the week.
Or we see a small drop first into the lower time frame support, and again a move up.
Let me know what your outlook is on EURUSD!
Stay safe out there and do your own due diligence, this is not investment advise!

EURUSD Early Week Bullish Outlook After Tokyo SweepQuick Summary
EURUSD remains strongly bullish, and the recent corrective decline is healthy for bullish continuation. Price is expected to dip early in the week to sweep the previous Tokyo low and go deeper into the hourly orderblock that aligns with the ascending trendline before resuming its upward move.
Full Analysis
The EURUSD continues to show strong bullish momentum, and the recent pullback is completely in line with a healthy trending market. Despite the strength of the prior upward move, the pair produced a controlled correction
This corrective move is particularly meaningful because price tapped into a clean hourly orderblock that aligns perfectly with an ascending trendline. Such confluence typically provides a strong foundation for buyers, showing that the market structure remains intact and supportive of further upside.
As we head into the new week, the expectation is that EURUSD may continue to dip slightly to sweep the previous Tokyo low. This potential sweep is important because the liquidity resting below that level can act as fuel for the next bullish expansion. Once the liquidity beneath Tokyo is taken, price is likely to react strongly from the same hourly orderblock zone and resume its upward trajectory.

NZDUSD CORRECTION EXPECTED|SHORT|
✅NZDUSD price is reacting from a premium supply zone after engineering buy-side liquidity into the upper range, creating an ICT rejection that shifts short-term order-flow toward the demand block below where discount pricing awaits. Time Frame 6H.
SHORT🔥
✅Like and subscribe to never miss a new idea!✅

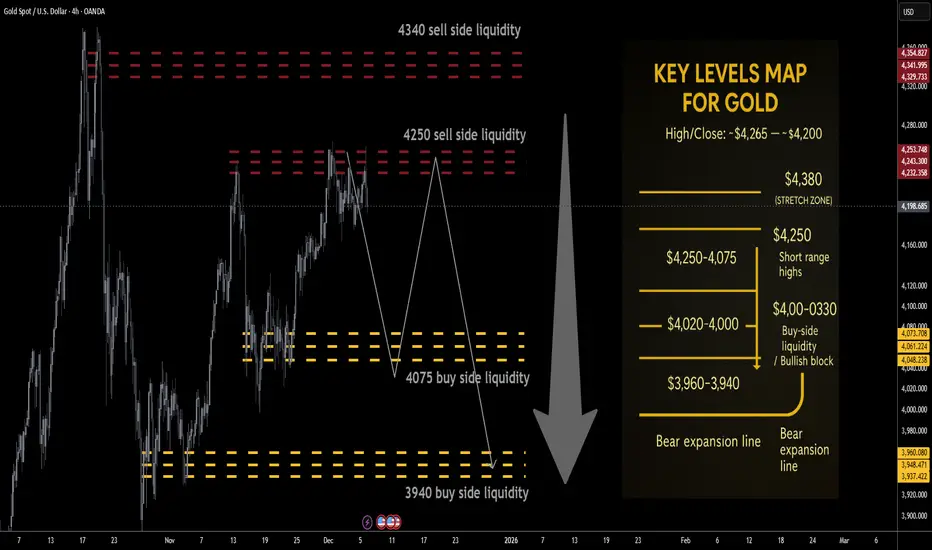
Gold next week Key S/R Levels and Outlook for Traders🔥 GOLD WEEKLY SNAPSHOT — BY PROJECTSYNDICATE
🏆 Swing High / Swing Low
$4,265 → ~$4,164 — clean rejection from the 4,26x breakout zone with a long upper wick, but weekly close still near $4,200, keeping price pinned in the upper part of the broader $4k range.
📈 Trend
Higher-timeframe: Structural bull trend intact while price holds above the $3,940–$4,000 block.
Tactical: Last week’s failed extension above $4,250 and the close back near $4,200 tilt the tape into distributive mode:
Rallies into $4,250 / $4,340 = sell-side liquidity magnets.
Downside liquidity sits lower at $4,075 / $3,940, making upside risk/reward look asymmetric to the downside from current levels.
🛡 Supports – Buy-Side Liquidity / Downside Objectives
$4,130–$4,100:
Short-term intraday pivot where buyers repeatedly stepped in last week; first micro-reaction zone on any flush.
$4,090–$4,075 🟢 Buy-side liquidity #1
First true BSL pocket below the close; ideal TP1 for shorts from above and a spot where responsive dip-buyers are likely to probe.
$4,020–$4,000:
Psychological shelf; loss of 4k would confirm that local distribution is winning and open the deeper BSL run.
$3,960–$3,940 🟢 Buy-side liquidity #2 / structural block
Higher-timeframe demand and key liquidity magnet for a fuller corrective leg. A sustained break/acceptance below $3,940 would signal that the 2025 blow-off is transitioning into broader mean-reversion rather than shallow consolidation.
🚧 Resistances – Sell-Side Liquidity / Short-Side Focus
$4,220–$4,250 🔴 Sell-side liquidity #1
First overhead supply from the prior week’s failed breakout structure and just under recent highs. Clean area for “sell the rip” probes and for late longs to de-risk.
$4,300–$4,340 🔴 Sell-side liquidity #2
Extension / SLI pocket aligned with the upper part of last week’s range and just below the prior $4,38x–$4,40x all-time high band. Ideal for scaling adds if a news-driven squeeze runs stops above 4,250.
Stretch: $4,380–$4,400:
Prior record spike / stop-run area; only expected on a full-on squeeze into the Fed, but a tag here would likely be exhaustion rather than a new sustainable trend leg higher.
🧭 Bias Next Week
Base tactical bias: fade strength / short rallies, not chase upside.
the tape favors a liquidity grab higher → rotation lower scenario:
Look for wicks into $4,220–$4,340 to be sold.
Downside path of least resistance: $4,090–$4,075 → $4,020–$4,000 → $3,960–$3,940.
⚖️ Base Case Scenario
Open/early week:
Price opens near $4,200 and either trades flat or spikes briefly into $4,220–$4,250 on weekend gap/early flow.
Liquidity sweep into resistance:
Rejection from SLI:
Failure to accept above $4,250/4,300 leaves upper wicks on 4H/daily, signaling distribution.
Rotation into BSL:
First objective: $4,090–$4,075 (TP1)
Secondary objective: $4,020–$4,000 (TP2)
Stretch / full flush: $3,960–$3,940 (TP3) into the structural demand block and buy-side liquidity pocket.
🚀 Breakout / Invalidation Trigger
Bearish framework invalidation:
A strong daily/weekly acceptance above $4,380 would imply shorts caught offside and re-open the path toward $4,450+ in line with the higher Street targets for 2026.
In that case, shift from short-the-rip → neutral / buy shallow pullbacks until a new top structure forms.
🔓 Bull / Bear Trigger Lines
Structural bull line:
Above $3,940–$4,000: long-term bull structure remains intact. Even if you’re tactically short, treat deep moves into this area with respect – this is where higher-timeframe players are likely to re-accumulate.
Bear expansion line:
Below $3,940: opens scope for a faster liquidation wave toward $3,880–$3,850 and potentially a broader 2025–26 consolidation phase instead of immediate continuation higher.
🧭 Recommended Strategy – Short at Market Open
⚠️ Illustrative trade plan, not financial advice. Size and risk-manage according to your own rules.
1️⃣ Primary Short – Open + Fade the Rips
Short at/near market open around the $4,195–$4,210 zone if price opens below $4,220 and orderflow confirms rejection of higher bids.
Add / build zones:
Add 1: into $4,220–$4,250 (first SLI band / prior breakout zone).
Add 2 (only if spike): $4,300–$4,340 (second SLI; look for clear blow-off / stop-run behavior before loading the last clip).
Stops / invalidation:
Tactical stop: hard stop above $4,380.
More conservative: soft line at $4,340, hard stop $4,390–$4,400 to allow for intraday wicks.
Targets (aligned with buy-side liquidity):
TP1: $4,090–$4,075 → take partials and reduce risk.
TP2: $4,020–$4,000 → core target for the week if distribution plays out.
TP3: $3,960–$3,940 → full BSL sweep into structural demand; expect responsive buying attempts here.
GOLD RISING TRENDLINE AHEAD|LONG|
✅XAUUSD price is reacting off the rising trendline after sweeping internal sell-side liquidity, creating an ICT-style rejection that signals a bullish draw toward the next buy-side inefficiency above. Continuation is favored as long as the trendline holds. Time Frame 2H.
LONG🚀
✅Like and subscribe to never miss a new idea!✅
