Buy the Dip on Amazon
BUY @ 200-210
Long hold
Still waiting for AMZN to catch up on the AI race, they have such great sticky ecosystem for leveraging AI integration in robotics, automation and IOT.
Not to mention the lacklustre monetization in their existing robotics arm.
On this aspect it is possible for almost full replacement of headcounts in AMZN's fulfilment centers with automation and robotics - hence heavy decrement in recurring manpower costs.
I foresee an amazon Trainium resurgence from Anthropic's collaboration with AWS.
Overall, adding a big bag to this one
Stocktrading

MSFT - High-Risk Reaction Trade at HTF SupportNASDAQ:MSFT is now down nearly 80% from its all-time high, approaching a major higher time frame (HTF) support zone. This is not a trend reversal play — it's a reaction trade at a critical level where a bounce is possible if sentiment stabilizes. The risk is high, but so is the short-term reward potential if the level holds.
📌 Trade Setup:
Entry Zone: $100 – $102
Take Profit: $120 – $140
Stop Loss: $88.00
This trade relies on a tight risk management strategy, given the strong downtrend. We’re looking for a bounce, not a reversal — if support cracks, we’re out.
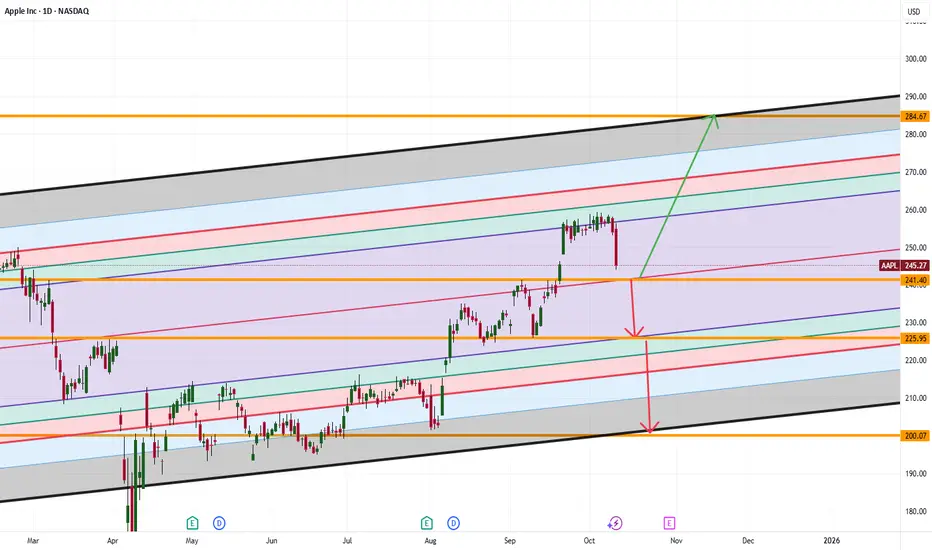
Apple’s $241 Bounce or Breakdown: Is This the Next Big Move?Apple’s stock price is moving down toward $241. This is an important zone. If Apple can stay above $241, it could jump up to $284. But if it falls below $241, the price might drop even more; maybe to $225 or even $200.
What do you think will happen next? Would you buy Apple if it drops to $241, or would you wait for a bigger move?
If you’re not sure what to do or have questions, ask me! Sometimes asking the right question gives you the answer you need to trade smarter. What’s your question about Apple right now?
Mindbloome Exchange
Trade Smarter Live Better
Clear double Top on AMD - Ready Buy LimitsClear double top
Gap always closes
This trade is placed to catch a falling knife
Ready buy limits at 160
TP @ 260

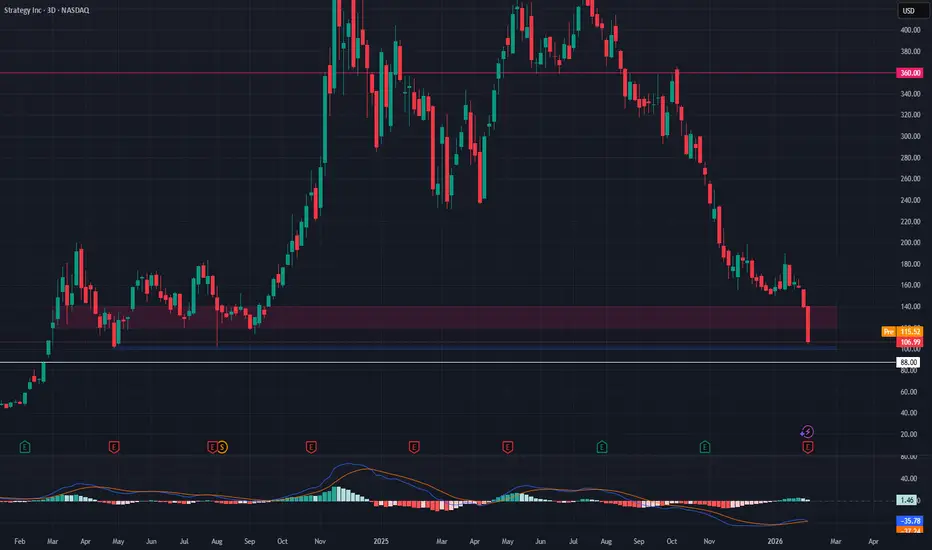
MSTR: What's the strategy? If you find this information inspiring/helpful, please consider a boost and follow! Any questions or comments, please leave a comment!
Questions Waiting for Answers
MSTR at the larger degree of the Elliott Wave structure is still being resolved. What stands out is the most recent move down, which has the look and behavior of a motive wave. If that interpretation is correct, this impulse may be nearing completion.
Price is now moving into a key area of interest between 118 and 89. This is a larger degree AOI where reactions matter, not predictions. This zone alone is not enough to justify a long. It is simply where I expect the market to start giving information.
The real test sits higher. 150 is the level that answers the bullish question.
If price breaks above 150 with a clear motive structure and holds, that would signal strength and open the door for higher targets. If price rallies into 150 and rejects, that keeps the bearish structure intact and increases the odds that this is still corrective behavior within a larger downtrend.
For a long setup, I am watching for a completed impulsive pattern at the smaller degree, then two things. First, a motive move up off the AOI. Second, a higher low that confirms structure rather than just a reaction.
Momentum is also important here. I am watching the EWO for divergence to develop as price works through this zone. Divergence combined with structural confirmation would significantly increase confidence.
Until price proves itself, this remains a wait and watch environment. Let the market answer the questions instead of forcing a conclusion.
Trade Safe!
Trade Clarity!

S&P 500 Breakdown Retest — Bears in Control, Bigger Drop Ahead?Today, I want to share a short setup on the S&P 500( SP:SPX ). Given that the crypto market—especially Bitcoin( BINANCE:BTCUSDT )—has recently regained strong correlation with the S&P, this analysis may be important for the crypto community too.
The S&P 500, over the past 20 days, has shown upward moves with low volume, while downward moves have had stronger momentum and volume. This indicates bears (sellers) have more control. The reasons include Federal Reserve policy shifts and escalating Middle East tensions. Historically, such tensions have led to S&P declines.
From a technical perspective, on the 4-hour timeframe, the S&P 500 has broken its support zone($6,956-$6,925) and is pulling back to it.
From an Elliott Wave perspective, it seems the S&P 500 is completing its main wave 4, which likely has a Double Three Correction(WXY) structure.
I expect the S&P 500 to decline toward the support lines. If broken, we could see the index drop further to at least $6,853.
Note: If Middle East tensions escalate further, as news suggests, the index could drop suddenly. Conversely, any agreement (e.g., between Iran and the U.S.) could support a recovery. Stay tuned to the news flow.
Note: A decline in the S&P 500 to at least 6,850 could also lead to the loss of Bitcoin’s heavy support zone($78,260-$70,080).
First Target: Support lines
Second Target: $6,853
Stop Loss(SL): $6,979(Worst)
Points may shift as the market evolves
Can gold resume its bullish trend, or should we expect deeper corrections?
💡 Please respect each other's opinions and express agreement or disagreement politely.
📌 S&P 500 Index Analyze (SPX500USD), 4-hour time frame.
🛑 Always set a Stop Loss(SL) for every position you open.
✅ This is just my idea; I’d love to see your thoughts too!
🔥 If you find it helpful, please BOOST this post and share it with your friends.

VIX short-term TASince the beginning of February the VIX has started an uptrend again, you should be cautious of market volatility in the upcoming days.

MSFT BUY - Market Overreaction!Market overreaction due to OpenAI making up for 45% of MSFT's Azure Remaining Performance Obligations (RPO) - raising questions about circular financing.
Disregarding the RPO the remaining revenue growth is still sustained and considerable
With a mag7 at PE near 25~, MSFT has never been cheaper
Buy @ 385 - 400
Near Weekly 200SMA
Target @ 482, 550
Long hold

BUY for META at Discounted Price - AI CAPEX Priced In!Market sentiment dragging prices down due to concerns over AI CAPEX, but from what I see, these are one time costs with sustained future ROI and non-linear positive scaling effect on META's family of apps and advertising services.
Catalysts upcoming include META's AI Frontier models release - Avocado.
META has also not fully leveraged profit margins on threads and whatsapp unlike instagram and facebook which has global advertising footprint.
BUY @ below 685
TARGET @ 850, 1000, Long hold

Live Trade on Micron Technology (MU)The price is currently at the bottom of its channel and meets all the conditions of one of our trading systems for a buy setup.
Follow proper risk and money management.
This is just my personal view, so please trade based on your own strategy and trading system.
Follow me on TradingView for more analyses and live stock trades.
NASDAQ:MU

LIVE Trading on Lam Research (LRCX)LIVE Trading on Lam Research (LRCX)
Price is currently positioned at the lower boundary of its valid channel, while at the same time two valid divergences are present on the MACD and RSI. In addition, all the specific conditions of one of my personal trading systems have been met.
Follow proper risk and money management.
This is just my personal view, so please trade based on your own strategy and trading system.
Follow me on TradingView for more analyses and live stock trades.
NASDAQ:LRCX

Energy Fuels (UUUU) — U.S. Uranium + Rare Earths Scale-UpCompany Overview
Leader in U.S. uranium with the White Mesa Mill (only operating conventional mill in the U.S.). 2025 production >1M lbs U₃O₈, riding nuclear demand, SMRs, reactor life extensions, and policy support for domestic supply.
Rare Earths Transformation
NdPr expansion at White Mesa: low-cost ramp, with heavy REE commercialization targeted for 2026, moving toward mine-to-metal integration for EVs, wind, and defense.
ASM acquisition (A$447M): Adds advanced processing/alloying, elevating Energy Fuels to a non-Chinese, global, vertically integrated rare earth supplier. Australian Strategic Materials
Why It Matters
Dual engines: Cash-flow visibility from uranium + margin expansion from rare earths.
Strategic assets: White Mesa enables domestic processing optionality few peers can match.
Policy tailwinds: U.S. energy security + critical minerals initiatives support long-term pricing and offtakes.
Investment View
Bullish above: $18.50–$19.00
Target: $40–$42 — backed by uranium leadership, REE vertical integration, and the ASM scale-up.
📌 AMEX:UUUU — from America’s uranium core to a rare earths champion.

GOLD pullbackGOLD in a pullback, waiting for confirmation to go LONG. Look for a bounce off channel and an extra confirmation such as a strong engulfing candle.

Apple Reclaims Momentum as iPhone Rebound Meets BreakoutLast week, Apple beat fiscal first-quarter forecasts, posting a 16% jump in revenue and a sharp lift in profits as iPhone demand rebounded. iPhone sales climbed 23%, driven by strong uptake of the latest models and an especially solid showing in Greater China. Mac and wearables underperformed expectations, but management struck a confident tone, guiding to double-digit revenue growth next quarter despite supply constraints. Services growth is expected to broadly maintain its recent pace, while the company returned nearly $32 billion to shareholders through buybacks and dividends.
Technically, the chart is starting to look constructive. The EMAs have crossed bullishly and are beginning to show clear angle and separation. Price has also broken above a downward-sloping trendline, signalling that the selling pressure seen since early December has eased materially. This improvement is reinforced by RSI, which has moved above 50. If RSI can hold above this level, momentum should remain supportive of prices. A drop back below 50 would undermine that view and point to renewed weakness rather than strengthening conditions.

Citigroup (C) Bullish Continuation via HULL MA Pullback🚀 CITIGROUP LAYERED ENTRY PLAYBOOK: THE THIEF STRATEGY 💰
NYSE: C | Bullish Swing Trade Setup | Hull Moving Average Pullback Activation
📊 SETUP OVERVIEW 🎯
The banking titan Citigroup is setting up a beautiful bullish retracement opportunity! After a commanding rally pushing price action into overbought territory, we're positioning for a strategic pullback entry utilizing the legendary Hull Moving Average as our confirmation indicator. This isn't just another setup—it's a layered institutional-style entry strategy designed to maximize risk-reward through multiple scaling levels.
Current Market Price: 💵 $123.46 USD (+0.12%) | 52-Week Range: $55.51 - $124.17
🎪 THE THIEF STRATEGY FRAMEWORK
Master the art of precision entries with multi-tier limit orders
Our approach abandons the FOMO trap and implements sophisticated accumulation methodology. Rather than chasing price in real-time, we strategically place limit orders at declining price levels—capturing premium entry points as sellers capitulate.
🔓 ENTRY LEVELS - THE LAYERED ACCUMULATION APPROACH
🔴 Tier 1 @ $114.00 — Initial dip buyers activation zone (25% position)
🟠 Tier 2 @ $115.00 — Secondary support confluence (25% position)
🟡 Tier 3 @ $116.00 — Hull MA proximity validation (25% position)
🟢 Tier 4 @ $117.00 — Ascending trend reversal confirmation (25% position)
Pro Tip: You control your destiny here! Customize these layers based on your risk tolerance and position sizing. Want smaller positions? Reduce tier allocations. Going aggressive? Add layers at $113.50 and $117.50. This is YOUR game. 🎲
🎯 PROFIT TARGET - THE RESISTANCE BARRICADE
PRIMARY TARGET: 💎 $121.50 USD
This level represents a critical confluence zone where:
✅ Prior swing resistance creates a "police barricade" effect
✅ Overbought RSI conditions suggest potential trap-style reversals
✅ Risk-reward ratio maximizes at approximately 1:3.5 on Tier 1 entries
✅ Multiple failed breakout attempts provide statistical confirmation
Strategy Note: Once price reaches $121.50, monitor for either breakout confirmation or trap signals. Take partial profits and let winners run—that's the Thief OG way! 🎰
🛑 STOP LOSS PLACEMENT - THE THIEF'S ESCAPE HATCH
HARD STOP: 🔥 $113.00 USD
This level sits approximately 1% below our lowest entry tier, providing:
⚔️ Tight risk containment (ideal for position sizing)
⚔️ Clear daily chart support validation
⚔️ Defined loss parameter for risk management protocols
Critical Disclaimer: We do NOT recommend setting this exact stop loss—it's OUR baseline. Your stop should align with YOUR risk appetite and portfolio parameters. Only you know your account tolerance! 💪
📈 TECHNICAL FRAMEWORK - HULL MOVING AVERAGE CONFIRMATION
The Hull Moving Average serves as our directional compass:
🔷 Bullish Crossover Signal: When price oscillates above the Hull MA, it confirms uptrend vigor
🔷 Pullback Zones: Current consolidation creates a "springboard" formation typical before explosive moves
🔷 Momentum Rhythm: The gradient slope indicates acceleration potential—this setup leverages that rhythm
Additional Confirmation Indicators:
MACD histogram showing bullish divergence ✨
Volume profile supporting breakout structure 📊
Ichimoku Cloud positioning price above Senkou Span B 🌤️
💼 FUNDAMENTAL & ECONOMIC CATALYSTS
Citigroup's Current Narrative (Q4 2025 - 2026):
🏦 Strategic Repositioning: Citi is mid-transformation, spinning off non-core assets while reinvesting heavily in commercial banking and wealth management. This positions the bank for structural profitability improvement.
📊 Earnings Momentum: Q4 2025 showed positive earnings trajectory with management guiding towards 2026 growth acceleration. Analysts project continued upside—12-month consensus target: $133.64 USD (Current upside: +8.3% from technical levels).
💰 Dividend Sustainability: Maintaining a 1.95% yield with consistent payout from adjusted earnings. Demonstrates financial fortress positioning.
🚨 Regulatory Relief: Recent withdrawal of 2024 consent order amendments removes compliance headwinds that previously suppressed valuations. This is a game-changer for institutional buying pressure.
⚡ Macro Headwinds to Monitor:
Credit card interest rate cap discussions (political risk but limited impact on earnings)
Banking sector margin compression from potential rate volatility
Commercial real estate exposure—watch for any CRE market deterioration
Economic Timeline: Next earnings release April 14, 2026—expect pre-announcement rallies if economic data remains supportive.
🌍 CORRELATED PAIRS TO MONITOR
Watching these relationships helps validate our C trade thesis:
🔗 JPM (JPMorgan Chase) - Correlation: 0.87
The bellwether for large-cap banking. If JPM breaks above $195, expect C to follow with conviction. Watch for sector rotation into financial services during equity market pullbacks.
🔗 BAC (Bank of America) - Correlation: 0.84
Consumer banking proxy. BAC strength validates thesis that retail banking normalization supports sector-wide upside. Key level: $38.50 breakout suggests C could gap higher.
🔗 GS (Goldman Sachs) - Correlation: 0.79
Investment banking indicator. GS moves often precede institutional capital reallocation toward Citi's commercial banking division. Watch quarterly M&A activity levels.
🔗 XLF (Financials ETF) - Correlation: 0.91
Macro sector barometer. XLF $42+ levels unlock synchronized financial sector rallies. Use as confirmation for our entry triggers.
🔗 TLT (Treasury Bonds) - Inverse Correlation: -0.65
Rising bond yields = wider net interest margins = bank profitability tailwinds. Watch for TLT weakness to confirm bullish C setup.
Key Insight: Monitor these correlations during pre-market hours. If JPM/BAC spike on positive earnings, front-run C entries by 30 minutes—institutions often cascade capital allocation sequentially. 📡
💡 WHY THIS SETUP WORKS
✨ Probability Stacking: Multiple confirmation signals (technical, fundamental, correlative) reduce false breakout risk
✨ Asymmetric Reward: 1% risk capturing 3.5% upside = institutional-grade risk-reward
✨ Market Psychology: Thief layering exploits capitulation—each tier entry captures panic selling exhaustion
✨ Regulatory Tailwinds: Consent order relief provides surprise catalyst potential
✨ Sector Rotation: Banking stocks entering leadership cycle as macro data stabilizes
⚠️ TRADE MANAGEMENT FRAMEWORK
Upon Entry Execution:
1️⃣ Once ANY tier fills, set a mental "trail stop" 2% below entry
2️⃣ At 50% of target ($119.75), close 50% position
3️⃣ Move stop to breakeven on remaining position (shift winners to risk-free)
4️⃣ At target ($121.50), evaluate breakout potential or reverse
If Target Breaks:
🎯 Target breached above $122? Ride momentum to next resistance: $124.00 (52-week high vicinity)
🎯 Rejection at target? Treat as distribution zone, reduce exposure, prepare for retest of entries
If Stop Hits ($113.00):
The trade is invalidated—market structure changed. Don't revenge trade. Wait for fresh setup confirmation. Loss management beats hope. 📍
🎪 FINAL THIEF OG BLESSING
The chart doesn't lie. The fundamentals support upside. The correlations validate the thesis. The risk-reward screams "institutional quality."
Now it's YOUR move. Place those limit orders. Manage your risk. Take your profits. And remember—the best trade is one where you sleep soundly knowing your downside is protected. That's how Thief OGs survive and thrive in markets that test conviction daily. 🏆
May your entries be filled and your exits be profitable, legends. This is NOT financial advice—it's a technical framework for YOUR analysis. Trade what YOU see, not what I see. 🚀

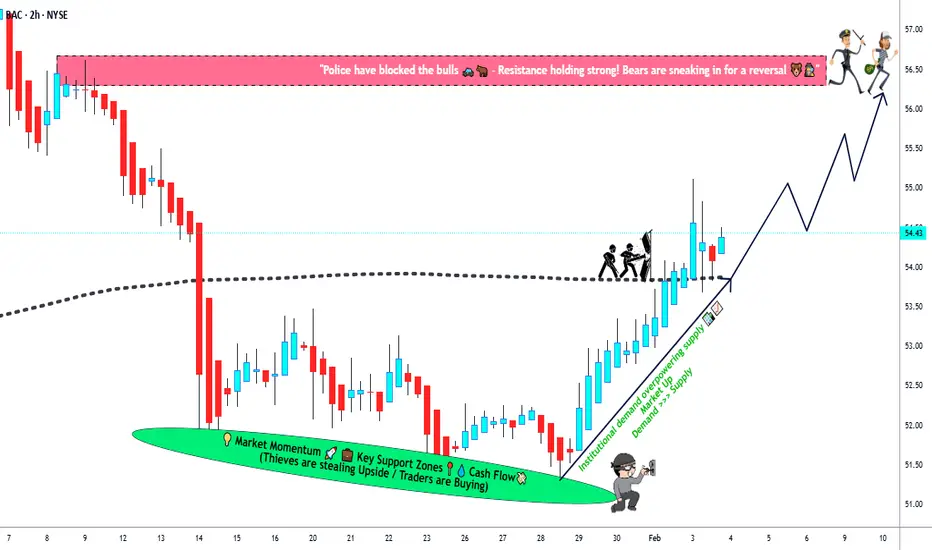
Bank of America (BAC) — Breakout Structure Analysis🏦 BAC Bank Heist Alert: Moving Average Breakout & Retest Play! 💰
📊 BANK OF AMERICA CORPORATION (NYSE: BAC)
Market Strategy: Bullish Day/Swing Trade Setup 🎯
Trading Style: Thief's Layered Entry Method
🎯 THE SETUP
📍 Entry Strategy: Flexible Multi-Layer Approach
The "Thief Strategy" utilizes multiple limit orders (layering technique) for optimal positioning:
💎 Suggested Buy Limit Layers:
Layer 1: $53.50
Layer 2: $54.00
Layer 3: $54.50
Note: You can add more layers based on your capital allocation and risk tolerance
🚀 Bullish Trigger: Moving Average BREAKOUT & RETEST confirmed
🎯 PROFIT TARGET
Take Profit Zone: $56.50 🏆
Why This Target?
The moving average is acting as a "Police Barricade" 🚧 — strong resistance zone combined with:
📈 Overbought conditions developing
Potential bull trap formation
⚠️ Lock in profits before the crowd exits
Important: This is a suggested target. Feel free to adjust based on your own analysis and risk management. Your profits, your rules! 💪
🛡️ RISK MANAGEMENT
Stop Loss: $53.00 🛑
Disclaimer on SL: This stop level is based on the Thief OG strategy framework. However, YOU are the boss of your own trades — adjust your stop loss according to your risk tolerance and account size.
📰 FUNDAMENTAL & ECONOMIC FACTORS
💡 Key Catalysts Driving BAC:
📊 Q4 2025 Earnings: Bank of America delivered strong quarterly results with $7.6B in net income and $28.4B in revenue, driven by trading, investment banking, and asset management growth
🏛️ Federal Reserve Policy: The Fed held rates steady at 3.5%-3.75% in January 2026, with BofA economists projecting the 10-year Treasury yield ending at 4-4.25%, potentially supporting lending margins if rates stabilize
📈 Economic Growth: BofA's global research team forecasted stronger-than-expected U.S. economic growth for 2026 at 2.4% GDP, driven by AI investments, fiscal stimulus, and tariff moderation
💼 Digital Transformation: The company's emphasis on digital transformation, including expansions in workplace benefits and AI-enhanced services, positions it to capture growth in fee-based revenues
💰 Dividend News: Bank of America declared a $0.28 per-share dividend on common stock payable March 27, 2026
📊 RELATED PAIRS TO WATCH
🏦 Banking Sector Correlation:
NYSE:JPM (JPMorgan Chase): Largest U.S. bank by market cap, strong correlation with BAC in lending margins and Fed policy sensitivity
NYSE:WFC (Wells Fargo): Similar regional exposure and consumer banking focus, moves in tandem during sector rotations
$C (Citigroup): BAC shares rose alongside peers like Wells Fargo and Citigroup amid discussions of banks regaining earnings momentum
NYSE:GS (Goldman Sachs): Investment banking activities correlation, especially during M&A cycles
AMEX:XLF (Financial Select Sector SPDR): Overall financial sector ETF - indicates broader market sentiment towards financials
Key Correlation Points:
Fed interest rate decisions impact all major banks simultaneously ⚡
Net interest margin compression/expansion moves sector together 📊
Regulatory changes affect banking sector uniformly 📜
Credit quality concerns spread across financial institutions 🔍
⚠️ RISK FACTORS TO MONITOR
🔴 Potential Headwinds:
Regulatory changes in consumer protection and capital requirements could impact cost structures
Moving average resistance creating sell pressure
Overbought technical conditions developing
Geopolitical tensions or inflation surprises could create market pressures
🎯 THIEF'S FINAL WORD
This setup combines technical breakout momentum with solid fundamental backing. The layered entry strategy allows you to average in as the stock moves, while the moving average resistance provides a clear profit-taking zone. Remember, banks are rate-sensitive beasts — watch Fed announcements! 🦅
Trade Smart. Trade Safe. Escape with Profits. 💎🚀
✨ If you find value in my analysis, a 👍 and 🚀 boost is much appreciated — it helps me share more setups with the community!
GME Bulls Reloading? MA Breakout Strategy Explained🎮 GAMESTOP (NYSE: GME) — "THIEF HEIST LAYERING STRATEGY" 💰
Multi-Entry Breakout Accumulation Playbook | Day/Swing Trading
🔥 "THE GRAND THEFT PROFIT OPERATION" — Executive Setup
Current Market Data ✅ Feb 4, 2026 — Real-Time Feed
Price: $24.52 | Range: $23.84 - $26.09 (Today) | Trend: Bullish Momentum 📈 | Volume: Above Average | Bias: LONG
🎯 THE HEIST BREAKDOWN
What's the Setup? 🎪
Think of this like a professional heist crew approaching a vault. We're using a moving average breakout + retest strategy combined with multi-layer limit orders (Thief layering technique) to accumulate positions at discounted levels. When price pulls back to confirm support on the MA line, that's our signal to stack the bags like a seasoned criminal! 😎
Technical Foundation: 🛠️
Indicator: Double Exponential Moving Average (DEMA) — acts as dynamic support on pullbacks
Pattern: Breakout + Retest continuation (classic bullish reversal pattern)
Timeframe: 3-Hour candles (optimal swing trade window)
Risk Profile: Moderate-High (GME volatility = 8.43%) ⚡
💎 ENTRY STRATEGY — "BUILDING THE HEIST CREW"
Multi-Layer Buy Limit Orders (The Thief Layering Method) 🔓
Instead of YOLO'ing into one entry, we deploy MULTIPLE limit orders at strategic price levels. This is how professionals steal profits! 🏴☠️
🔴 ENTRY LAYER 1: $23.00 ← Scout Position (Risk Capital)
🔴 ENTRY LAYER 2: $23.50 ← Core Accumulation (Main Position)
🔴 ENTRY LAYER 3: $24.00 ← Momentum Confirmation
🔴 ENTRY LAYER 4: $24.50 ← Final Entry (Breakout Confirmation)
🎓 PRO TRADER NOTES:
You can CUSTOMIZE YOUR LAYERS based on:
💰 How much capital you're willing to deploy
📊 Your risk tolerance & position sizing
⚡ Volatility conditions (add more layers if IV is high, fewer if calm)
📈 Support/resistance levels on your chart
This is YOUR game — set 2 layers, 5 layers, 10 layers — whatever matches YOUR plan!
🎯 PROFIT TARGET — "THE GREAT ESCAPE WITH LOOT"
Primary Target: $28.00 🚀💵
Why $28?
✅ +14.3% Upside from current $24.52 entry zone
✅ EMA Resistance Cluster — where previous rallies stalled (Police Barricade) 🚓
✅ Overbought Zone Approaching — RSI signals caution above 70
✅ Natural Profit-Taking Level — institutions dump here historically
The "Trap Alert" 🪤
Price often tricks retail into holding too long after touching resistance. When you see RSI > 70 + price touching MA resistance + volume declining, that's the escape signal! Take profits, don't get greedy.
⚠️ CRITICAL DISCLAIMER ON PROFIT TARGETS:
🎤 Dear Thief OG's & Trading Fam, this $28.00 target is just a suggestion based on technical analysis. YOU control your exits! Taking profits at $26, $27, $27.50, or $29 is 100% YOUR choice. Different market conditions = different exits. Risk-reward ratios matter more than hitting exact levels. Do NOT blindly follow my target — adapt like a professional.
🛑 STOP LOSS — "THE EMERGENCY ESCAPE PLAN"
Hard SL: $22.00 🚨
Why $22?
✅ -8.25% Risk/Position — acceptable loss for swing trade framework
✅ Below Key Support Zone — breaks here = downtrend confirmed
✅ Protects Your Capital — if fundamentals shift, you're protected
⚠️ CRITICAL DISCLAIMER ON STOP LOSS:
🎤 Dear Thief OG's, your stop loss is YOUR responsibility! Setting it tighter ($21.50), wider ($21.00), or using trailing stops is your discretion. Position sizing matters more than SL placement. Protect capital first, chase profits second. This is education, not financial advice.
📊 FUNDAMENTAL CATALYSTS — "THE REAL TREASURE MAP"
🔥 GAME-CHANGING EVENTS (Next 2-3 Months)
1. TRANSFORMATIONAL M&A MEGA-DEAL 🏢💰
CEO Ryan Cohen announced plans for a "very, very, very big" acquisition of a publicly traded consumer company. This is potentially 10x market cap expansion! He's targeting a Berkshire Hathaway-style holding company model. Timeline: Q1 2026 announcement possible. Impact: Could trigger 20-100% rally if deal announced. Capital: $9B war chest ready to deploy.
2. SHAREHOLDER VOTE — COHEN PERFORMANCE AWARDS ⏰📅
Event: Special meeting March/April 2026
Details: 171.5M share options at $20.66 strike
Vesting: Full payout if $100B market cap + $10B cumulative EBITDA achieved
Signal: Cohen is 100% aligned with shareholders — "skin in the game" = bullish psychology
3. INSIDER BUYING ACCUMULATION 💼📈
Ryan Cohen personally bought 500K shares on Jan 20-21 at $21.11 average. He now owns 9.2% of company (41.58M shares). When insiders buy heavy, smart money follows. This is real capital at risk from the CEO himself.
4. MICHAEL BURRY BACKING THE PLAY 🎯
Famous "Big Short" investor Michael Burry disclosed he's BUYING GME shares! Burry stated: "I believe in Ryan... the setup, governance, and strategy are compelling." This adds institutional credibility to the transformation narrative. Burry doesn't make casual bets.
💹 POSITIVE ECONOMIC TAILWINDS
✅ Q1 2026 Earnings Beat — Last quarter surprised 20% above estimates (EPS: $0.24 vs $0.20 expected)
✅ Next Earnings: March 31, 2026 (estimated $0.37 EPS)
✅ Free Cash Flow Positive: $130-160M annually — company is self-sustaining
✅ $9B+ War Chest: Fortress balance sheet for aggressive expansion
✅ Retail Sector Sentiment: Improving as Fed signals spring rate cuts
⚠️ RISK FACTORS TO MONITOR
❌ Execution Risk: M&A integration historically difficult in retail
❌ Macro Slowdown: Consumer discretionary vulnerable to recession
❌ Valuation Risk: Requires flawless execution to hit $100B target
❌ Bitcoin Exposure: $368M holdings could be liquidated (creates uncertainty)
❌ Inflation Persistence: Weak consumer spending in lower-income brackets
🔗 CORRELATED PAIRS TO WATCH — "THE CREW'S RELATED PLAYS"
Consumer Discretionary Sector Movers 📊
Strong Correlation Pairs:
🔵 BBY (Best Buy) — $65.57 — Electronics retailer, benefits from Fed rate cuts
Key Correlation: +0.67 correlation to GME (positive tech trend moves together)
Watch: Q1 earnings, consumer electronics demand trends
🔵 HD (Home Depot) — Furniture/Home Focus — Consumer discretionary bellwether
Key Correlation: +0.54 (macro consumer health indicator)
Watch: Housing starts, mortgage rate movements
🔵 TJX (TJMaxx) — $90+ range — Value retail leader with strong fundamentals
Key Correlation: +0.48 (bargain-hunting consumer sentiment)
Watch: Discount retailer strength = weakness in full-price retail
🔵 XRT (Retail Sector ETF) — Broad retail exposure
Key Correlation: +0.61 (sector momentum indicator)
Watch: If XRT breaks above 50-day MA, GME tailwinds strengthen
Inverse Correlation (Risk Monitor):
🔴 VIX (Volatility Index) — Stock market fear gauge
Watch: If VIX spikes above 25, expect sector rotation OUT of retail
Key Points on Correlations:
🎯 When consumer discretionary sector rallies (interest rate cuts expected spring 2026), GME typically follows higher. If Fed holds rates "higher for longer," discretionary plays face headwinds.
🎯 GME has lower beta (0.54) than broader market = more stable than sector peers, but higher than S&P 500.
🎯 If BBY or HD earnings disappoint, GME could face sympathy selling despite strong fundamentals.
🎓 TRADER'S MINDSET — "THE THIEF CODE"
💪 Rule #1: Never bet what you can't afford to lose — this is speculation, not investment
💪 Rule #2: Your entry layers = YOUR choice, not mine
💪 Rule #3: Your exit price = YOUR choice, not mine
💪 Rule #4: Position size = YOUR responsibility
💪 Rule #5: Enjoy the journey, respect the risk 🎯
✨ If you find value in my analysis, a 👍 and 🚀 boost is much appreciated — it helps me share more setups with the community!
📌 DISCLAIMER — "THIEF STYLE TRADING STRATEGY — ENTERTAINMENT ONLY"
This analysis is created purely for educational entertainment purposes using the "Thief Strategy" concept for creative flair. This is NOT financial advice, and I am not a registered financial advisor. GameStop (GME) is a volatile, speculative stock with significant risk. Past performance does not guarantee future results.
Your Capital, Your Responsibility:
Do not trade with money you can't lose
Always conduct your own due diligence
Consult a licensed financial advisor before making investment decisions
GME remains a high-risk speculation — position size accordingly
The acquisition thesis is unproven; execution risk is real
Trade with intelligence, trade with discipline, trade with respect for risk. 🎯

APLD :: Bullish Price Action After Controlled Pullback🟢 APLD (Applied Digital Corporation) — NASDAQ
Market Profit Playbook | Day / Swing Trade
🧠 Trade Thesis (Why This Setup?)
APLD is showing bullish continuation behavior after prior expansion, now respecting a Double Exponential Moving Average (DEMA) pullback on the 3H timeframe.
This type of pullback often attracts institutional dip participation when trend structure remains intact.
Think of this as a controlled pullback inside a broader bullish environment, not a random dip.
📊 Technical Structure Breakdown
🔹 Trend
Primary bias: Bullish
Price holding above key trend structure
Pullback into Double EMA zone (3H) → classic trend continuation zone
🔹 Entry Method (Layered Accumulation)
Institutional-style scaling, not a single all-in entry.
Buy Limit Layers (example):
🟩 36.00
🟩 35.00
🟩 34.00
🟩 33.00
📌 You may add or adjust layers based on your own risk model and volatility tolerance.
🎯 Target Zone (Profit Escape)
Target: 🎯 42.00
📍 Rationale:
Prior supply / resistance zone
Momentum historically stalls here
Overbought + liquidity trap potential
Smart money often distributes here — grab profits, don’t negotiate
🛑 Risk Control (Capital Protection)
Stop Loss: ❌ 30.00
📌 Below key structure → invalidates bullish thesis if breached.
⚠️ Risk Notes (Read Carefully)
Targets and stops are reference levels, not mandatory instructions
Partial profits are always valid
Manage position size responsibly
This playbook shows structure — execution discipline is on you.
🏦 Fundamental & Macro Context (Why This Matters):
🔹 Company Angle (APLD)
Applied Digital operates in high-performance computing & digital infrastructure
Sector sensitive to:
AI / data center demand
Energy costs
Capital market liquidity
🔹 Macro Factors to Watch
📈 US Treasury Yields → higher yields can pressure growth stocks
🏦 Fed Policy Expectations → easing bias supports speculative tech
⚡ Energy Prices → impacts operational costs
📊 NASDAQ sentiment → APLD moves with risk-on / risk-off flows
Upcoming macro data that may impact volatility:
US CPI / PPI
FOMC statements
Bond auction demand
🔗 Correlated Assets to Monitor
NASDAQ:NDX / NASDAQ:QQQ → Tech sentiment driver
SP:SPX → Broader risk appetite
CRYPTOCAP:BTC → Speculative capital flow proxy
TVC:US10Y → Yield pressure indicator
📌 If NASDAQ weakens sharply or yields spike, expect higher volatility in APLD.
🧠 Final Thought
This is not prediction trading — it’s probability management.
The edge comes from structure + patience, not hype.
✨ “If you find value in my analysis, a 👍 and 🚀 boost is much appreciated — it helps me share more setups with the community!”

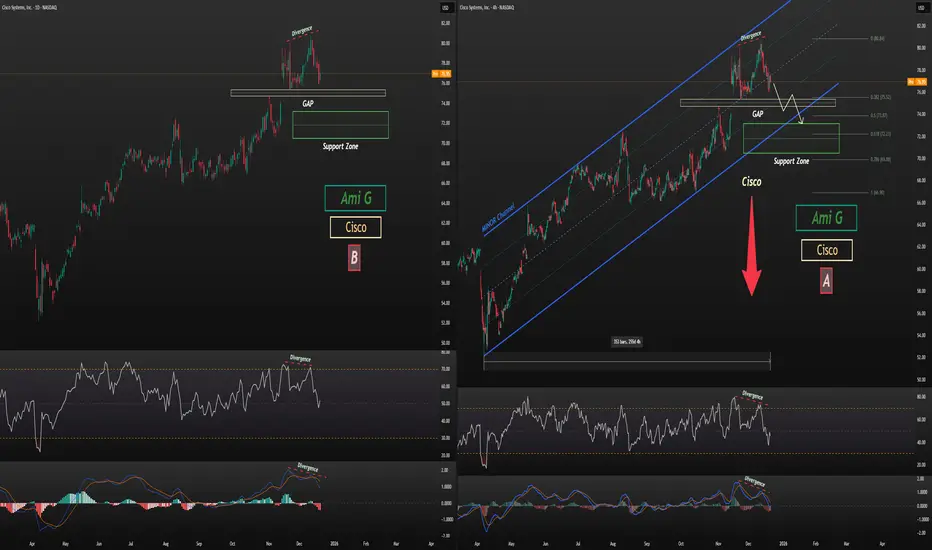
CSCO Correction TargetCisco (CSCO) Stock Analysis
As shown on the chart, Cisco is trading near the upper boundary of its 9-month channel. After forming two strong divergences on the 4H chart (Chart A) and the daily chart (Chart B)—confirmed by both MACD and RSI—the stock has entered a corrective phase.
Given the presence of a very strong gap marked on the chart, price is likely to correct at least toward the gap zone, and potentially extend further to the support zone, which may also align with the lower boundary of the 9-month channel.
Analysis will be updated.
Follow me on TradingView for more analyses and live stock trades.
NASDAQ:CSCO
Oracle: Calling for a Turn?If you find this information inspiring/helpful, please consider a boost and follow! Any questions or comments, please leave a comment!
Markets rarely move in a straight line forever. After an extended period of lower lows and lower highs across multiple degrees, the question eventually shifts from how far can this go to when does the structure begin to change. Right now the focus is not on calling a bottom, but on objectively assessing whether conditions are starting to align for a potential turn.
Price has been trending lower with clean structure across several degrees, reinforcing the bearish bias. That trend remains intact. However, momentum has begun to slow, and that change in behavior is important. Slowing momentum does not mean a reversal is guaranteed, but it often precedes structural transitions that are worth monitoring closely.
At this stage, there are two valid Elliott Wave counts that suggest the current decline may be approaching completion. Both counts allow for a near term resolution, but neither count on its own is enough to justify acting early. The market still needs to prove it.
Key Levels of Interest:
The next larger level of interest sits at 146. This is a meaningful area where a reaction would be expected, even if the broader trend ultimately continues lower. A response here helps answer an important question. Is price simply pausing before continuation, or is demand beginning to assert itself at a higher degree?
Above that, the most immediate level of interest is 173. This level represents the line in the sand for any bullish case to begin forming. Until that area is reclaimed with strength, the downside structure remains dominant.
The true test for a potential turn is not price reaching a level, but how it behaves after interacting with that level. What matters most is structure.
A sign of strength would be a break above 173 with an impulsive or motive move, followed by acceptance and holding above that level. Even a break at lesser degree pivots would be meaningful, as it would indicate that the sequence of lower highs is starting to fail.
Without that, any bounce remains corrective in nature and vulnerable to being sold into. The goal is not to anticipate the reversal, but to wait for the market to confirm that a change in character is underway.
This is a classic waiting game. Momentum divergence and overlapping wave counts suggest we may be close to a decision point, but price has not confirmed it yet. Until it does, the bearish structure deserves respect.
Letting the market show its hand reduces risk and keeps analysis aligned with reality rather than expectation. If strength appears, there will be opportunity. If it does not, the trend remains intact and downside scenarios stay in play.
The focus remains on observation, not prediction. Levels at 146 and 173 define the current battlefield. How price reacts around these areas will determine whether this move is simply another pause in a downtrend or the early stages of something more constructive. If 173 breaks, the move up could lead some substantial up side, even if it is just an internal retrace at the highest degree.
Trade Safe!
Trade Clarity!

MRAM — Persistent Memory for Mission-Critical AI & EdgeCompany Overview
Everspin is the market pioneer in NASDAQ:MRAM (~30% share), supplying Toggle MRAM, STT-MRAM, and TMR sensors for industrial, automotive, aerospace, and data-center use—where speed, durability, low power, and persistence are non-negotiable.
Key Catalysts
Secular tailwinds: MRAM market poised for ~13% CAGR through 2033, driven by AI at the edge, automotive electrification, and industrial automation.
Product leadership: 2025 launch of PERSYST MRAM targets aerospace/defense/industrial—segments that value high endurance + radiation tolerance, enabling premium pricing.
Momentum into 2026: Shares have pushed to multi-year highs near $17 on heavy volume as investors recognize MRAM’s role in fast, persistent scratchpads, black-box logging, and instant-on systems.
Balanced portfolio: Toggle for extreme endurance + STT-MRAM for higher density → covers a wide range of latency, write-endurance, and power envelopes.
Why it matters
✅ Mission-critical reliability vs. volatile DRAM or wear-limited NAND
✅ Deterministic writes for safety-class automotive and avionics
✅ Lower system power (no refresh) → smaller thermal budgets at the edge
Investment Outlook
Bullish above: $11–$12
Target: $20–$22 — supported by category leadership, premium end-markets, and expanding MRAM use-cases across AI/edge and transportation.

GOLD reverse?GOLD has been continuing to drop upon market open. Waiting for confirmation as it is near the SUPPORT zone for a possible climb back up.

BILI mid-term TABilibili is building a strong and solid uptrend, there's a positive trend strength on daily and weekly time frames and it keeps accelerating. The channel within $30-35 was a good supply area and currently it is trying to fix above the channel upper resistance and continue the uptrend acceleration.
