Solana ~ TRADE The CHOP: 3 Ways to Make ATLEAST +15%Choppy markets are identified by low volume and sideways trading / range trading. It seems uninteresting in most cases, but you don't have to sit around and wait for the next big impulse wave!
Here are three plays YOU can take during choppy markets:
1) 4H : Short Resistance
Chop trading can be a blessing - the price often touches the same support zone and the same resistance zone 2 - 3 times, before breaking out either way. This means that if you spot your zone early, you could take a short timeframe swing trade. Another way to find a trade is to look for gaps in the candles, for example:
2) 4H : Long Support
South Africa is in a time of turbulence, and the Rand is unpredictable as the effects of G20 settle in. During these times, and this counts for all markets, placing a low risk leveraged long on support is a way to trade the chop:
3) Daily : SPOT Hold to TP Zone
Nothing like a classic low risk trade - but you may need some patience with it! If you're not willing to look at charts all day, or have alarms wake you up at 2:30am to take a trade then this is your style., for example:
What do you do during choppy markets?
Support and Resistance

GBPUSD 1HA structured approach to market analysis combining Fibonacci retracement levels with key Support & Resistance zones.
Price action is monitored to identify reaction points, liquidity zones, and potential reversal or continuation setups.
The analysis focuses on high-probability confluence areas where Fibonacci ratios align with historical structure levels, helping traders spot optimal entry points, stop-loss zones, and profit-taking targets.

XAU/USD Daily Outlook – Tuesday Strategy
The Tokyo session offered a decent buying opportunity, which I utilized by opening a position at 4175.5 and closing at 4185. This early move reinforces the view that intraday selling pressure remains limited, aligning with my mid-term bullish bias.
Market Context
Investors have largely priced in a Federal Reserve rate cut, but the real risk lies in the magnitude of the easing cycle. A milder-than-expected approach could disrupt linear bullish momentum and introduce volatility. With the Fed decision scheduled for Wednesday, the market is in a cautious stance, balancing technical setups with macro uncertainty.
Technical Outlook
Key Resistance: 4200 (psychological benchmark)
Bullish Scenario: I’ll remain on the sidelines until we see a clean break above 4200.
Once confirmed, I’ll engage long positions targeting 4219 as the next resistance zone.
Bearish Scenario: Price action below 4176 could give sellers momentum, but I’ll avoid shorts unless 4164 is invalidated.
If that happens, targets will be 4152 and 4135.

EURUSD 1H A structured approach to market analysis combining Fibonacci retracement levels with key Support & Resistance zones.
Price action is monitored to identify reaction points, liquidity zones, and potential reversal or continuation setups.
The analysis focuses on high-probability confluence areas where Fibonacci ratios align with historical structure levels, helping traders spot optimal entry points, stop-loss zones, and profit-taking targets.


BTC updates
Here’s the Bitcoin result as well: it has gained 4%, and as expected, the 90,500 level pushed the price upward with high precision.
If you’d like to see more of my analyses, make sure to follow.

IS this the XAUUSD next possible move?XAU/USD has been showing bullish momentum after a recent Break of Structure (BoS). Price action suggests that we could be entering a new bullish leg, especially as we approach key support zones that align with Institutional Order Flow (IOF).
🔑 Key Concept - ICT BISI:
This setup is driven by BISI (Break of Structure, Institutional Order Flow, and Smart Money Concepts). Here's how we're setting up:
1. Break of Structure (BoS):
We recently saw the price break above the previous high, confirming the market has shifted to a bullish trend. A higher timeframe bullish market structure is forming, suggesting a continuation of the upward trend.
Current Level: Price is now testing key support levels and consolidating at previous demand zones. If price holds above this level, we’re likely to see a continuation higher.
2. Institutional Order Flow (IOF):
Liquidity Hunt: We’ve identified an imbalance in order flow, where price is moving towards a liquidity pool below the current level. The institutional buying is likely to accelerate, and smart money is starting to accumulate long positions.
The order block is visible in the lower timeframes, indicating where large buyers are stepping in.
3. Smart Money Entry (SME):
We’re looking for a breakout entry above the recent swing highs (current resistance), as smart money starts driving prices higher. A bullish confirmation candle (like a bullish engulfing or a strong close above resistance) would validate the continuation of the trend.
Entry Trigger: The confirmation comes when price breaks above the last swing high around (mark this level for precision).
4. Entry, Stop Loss & Take Profit (1:3 RR):
Entry Point: Look for an entry at after a breakout or retracement to the demand zone.
Stop Loss: Place the stop loss just below the recent swing low or demand zone around . This keeps the risk contained.
Take Profit (TP): Target the next major resistance level or liquidity pool at for a 1:3 RR risk-to-reward ratio.
🔍 Trade Summary:
Trade Type: Buy
Entry:
Stop Loss: (just below recent low)
Take Profit: (next resistance/target)
Risk-to-Reward: 1:3
🔔 Key Watch Areas:
Breakout Confirmation: Watch for a bullish breakout above the recent swing high.
Support Zone Reaction: Monitor how price reacts at the demand zone for any sign of institutional buying.
Volume & Order Flow: Pay attention to increased volume or price action shifts in line with smart money.
📈 Risk Management:
Always trade with proper risk management. The trade setup provides a 1:3 RR ratio, but adjust your position size according to your trading plan.
💡 Conclusion:
We’re anticipating a bullish continuation in XAU/USD, and this setup offers a clear 1:3 RR opportunity. With smart money entering the market, the risk-to-reward ratio is in our favor.
Feel free to adjust the levels for entry, stop loss, and take profit based on your chart analysis. Keep an eye on price action, and happy trading! 🚀

EURUSD updates
EUR/USD launched from the second support level at 1.16234 and has reached a 4.6 reward. The position is currently running in profit.

XIC LongTrend Respect Continues - Pullback Entry Executed
Just entered XIC on a clean structural pullback into the 1-hour MA cluster. The broader trend remains intact, with rising 20MA and 50MA on the 1h and solid support from the Daily 50MA well below. Recent price action shows momentum cooling without breaking structure, which fits the system’s ideal reset conditions.
Why I entered:
Trend confirmed:
1h 20MA > 50MA, both rising. Price continues to hold above the 1h200 and is respecting the staircase of higher lows.
Daily structure is supportive with the 1D 50MA still trending upward beneath price.
Pullback behaved correctly:
Price retraced cleanly into the 20/50 buy window, CCI reset, and now recrossed back into positive momentum.
RSI held midline structure, no breakdown.
Structure-led risk placement:
Initial stop placed at the purple level beneath the most recent swing lows.
As trend progresses, the plan is to move the stop up toward the Daily 50MA (standard system approach for slow-moving ETFs).
XIC is typically a steady mover, not explosive, but it respects structure extremely well. The goal here is slow compounding and disciplined trailing rather than chasing momentum.

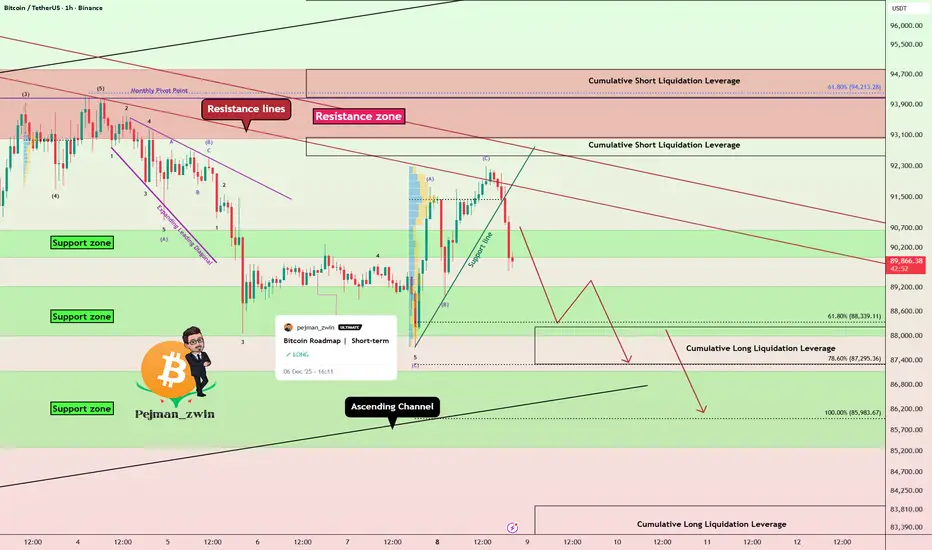
Bitcoin Breakdown After Perfect Bounce — Short Setup LoadingAs I expected , Bitcoin bounced from the support zone and reached its targets.
Right now, Bitcoin has rejected from resistance lines and successfully broke both the support line and the support zone($90,650-$90,000).
From an Elliott Wave perspective, it appears that Bitcoin has completed a ZigZag structure, and we should now anticipate the start of a bearish wave sequence.
The S&P 500 index( SP:SPX ) also shows a bearish outlook, and given Bitcoin’s correlation with SPX, further downside in BTC is not surprising.
At the same time, USDT.D%( CRYPTOCAP:USDT.D ) has turned bullish again—at least in the short term—which can add additional pressure on Bitcoin.
I expect Bitcoin to continue its downward movement, at least toward the next support zone($87,140-$85,290) and the lower line of the ascending channel.
Note: It’s better to wait for a bullish correction before entering, and then take a short position according to your own strategy.
Cumulative Short Liquidation Leverage: $98,260-$96,690
Cumulative Short Liquidation Leverage: $93,040-$92,560
Cumulative Long Liquidation Leverage: $94,840-$94,100
Cumulative Long Liquidation Leverage: $83,900-$82,400
Target: $87,733
Stop Loss(SL): $92,723(Worst)
Points may shift as the market evolves
💡 Please respect each other's opinions and express agreement or disagreement politely.
📌Bitcoin Analysis (BTCUSDT), 1-hour time frame.
🛑 Always set a Stop Loss(SL) for every position you open.
✅ This is just my idea; I’d love to see your thoughts too!
🔥 If you find it helpful, please BOOST this post and share it with your friends.
Gold Consolidation Outlook – Bullish Bias Above Local SupportGold is consolidating within its current range and is showing signs of a potential bullish continuation, supported by its reaction to local support levels.
Technically, gold strengthened following the latest U.S. economic data, while investors await comments from Fed Chair Jerome Powell Recently, price tested the 4200 zone and quickly broke above it, signalling strong upward momentum. As long as the 4200 support level holds, gold is likely to remain bullish. However, this week’s fresh labour data has added some uncertainty to the medium-term policy outlook.
If bulls manage to sustain a bounce above the 4200 support, maintaining strong momentum, the next upside targets and resistance zones are seen at 4240–4265.
You may find more details in the chart,
Trade wisely best of luck buddies.
Ps; Support with like and comments for better analysis thanks for supporting.

$DJIPrices are elevated, and buyers may not be willing to keep absorbing at these high levels.
To attract fresh liquidity, the market might need to pull back or offer cheaper entry points, otherwise sellers could step in to rebalance the price.
This type of setup usually means volatility is coming as the market searches for fair value.

Gold Faces Pressure at 4200, Start Buying Near 4170From a fundamental perspective, the market’s expectation for a 25 bps rate cut remains as high as 89%, and this has not shown any major change. Geopolitically, the prolonged Russia–Ukraine conflict and Trump’s proposed tariff hikes on multiple categories continue to provide a safe-haven cushion for gold. However, the repeated fluctuations in the U.S. Dollar Index and U.S. Treasury yields are simultaneously suppressing gold’s upside momentum.
Therefore, for the first half of this week, the overall outlook should still be treated as range-bound, with the main focus remaining on Wednesday’s interest rate decision.
From a technical standpoint, gold failed to stabilize above 4215 yesterday and subsequently retreated to around 4176.
Although price rebounded toward 4200 today, it still failed to break through and has since oscillated lower, even piercing 4170.
The 4170 level offers weak support, while the more significant support zone remains at 4156–4143. If price can pull back into this area today, it would present a relatively ideal opportunity for long positions. The immediate upside resistance is located at 4196–4210.
Regarding yesterday’s trades:
After gold failed to hold above 4215, a follow-through short position yielded a small profit;
Later, a light-position long below 4185 also produced a modest gain.
Overall profits were not impressive, mainly because the price did not reach the ideal trading zones.
💵 Trading Strategy for Today
📉 Sell on Rebounds
Watch around 4200 as resistance.
If price fails to break through, consider light short positions.
If a strong breakout occurs, monitor the 4210–4215 area for continuation.
📈Buy on Pullbacks
Focus on the 4170–4160 support zone → suitable for light long entries.
If price extends lower toward 4156 or even 4140-4130, consider adding long positions gradually.

Bitcoin Trading range between two Points Resistance or Support Bitcoin Price is currently fluctuating within a defined range between 92k and 89K. The highlighted zone shows a period of consolidation with both bullish and bearish reactions inside the range.
Technically Bitcoin is maintaining its position inside this channel, but the overall structure is leaning bearish as price repeatedly tests the lower boundaries focus on the key levels, price may decline deeper toward the next major support areas at 87K and possibly 85K
If price holds above 90K a bullish rebound is possible, with potential upside targets at and 93K further at the upper channel level near 95k bullish scenario, where price bounces upward and breaks the upper region of the range, rising toward the marked targets.
If the price reacts to the bearish side where price fails to hold above support and follows a downward continuation downside then support level would be 87K to 85K,
You may find more details in the chart,
Trade wisely best of luck buddies.
Ps; Support with like and comments for better analysis thanks for supporting.

BTCUSDT Bullish channel holding strongAs observed on the chart, Bitcoin is trading within a newly formed ascending channel and is currently testing the lower boundary of this structure. This level represents a strategic support zone within the bullish technical framework, offering a favorable opportunity to consider initiating or adding to long positions with appropriate risk management.
Also if this channel resistance break to the upside then market is again bullish after a while.
DISCLAIMER: ((trade based on your own decision))
<<press like👍 if you enjoy💚

DOGE soon will break 0.15$ and then again bull marketDOGE is currently consolidating within a defined range near the major support zone of $0.08 to $0.12. This range-bound action suggests a period of accumulation, and a breakout above the descending trendline—particularly with a decisive move past the $0.15 resistance—would signal the likely resumption of bullish momentum.
In such a scenario, measured upward projections point toward initial targets near $0.22, followed by a secondary objective around $0.29, contingent upon sustained buying pressure and volume confirmation following the breakout.
DISCLAIMER: ((trade based on your own decision))
<<press like👍 if you enjoy💚

GOLD BUYS 4200 taking a 1:3 rr buy trade on gold based on ICT concept BISI as shown on 5m tf pic
This trade is based on the ICT concept of **BISI (Break of Structure, Institutional Order Flow, and Smart Money Concepts)**.
1. **Break of Structure (BoS)**:
We observed a **bullish market structure** break at the recent low, confirming that the price is likely to move upward in the near future. The last significant swing low was breached, indicating a potential reversal or continuation of the bullish trend.
2. **Institutional Order Flow (IOF)**:
The **smart money** is entering the market, as we see higher time frame order blocks and **liquidity zones** aligning with the current market price action. The buying pressure from institutions is evident as we see aggressive price action and volume in the order flow.
3. **Smart Money Entry (SME)**:
A **smart money entry** was identified near the recent demand zone, where institutional buying activity has been observed. The entry point is located at a **discount price** relative to the recent bullish move, allowing us to get in at a favorable risk-to-reward setup.

ADAUSDT the 0.6$ soon will hit againAs observed on the chart, ADA has executed a decisive breakout above a major resistance zone, confirmed by a strong bullish candle accompanied by significantly high trading volume. This combination of price action and volume indicates substantial buying pressure and validates the breakout's strength. Consequently, the technical structure now supports a continuation of the upward momentum, with the next primary target projected at the $0.60 level.
DISCLAIMER: ((trade based on your own decision))
<<press like👍 if you enjoy💚

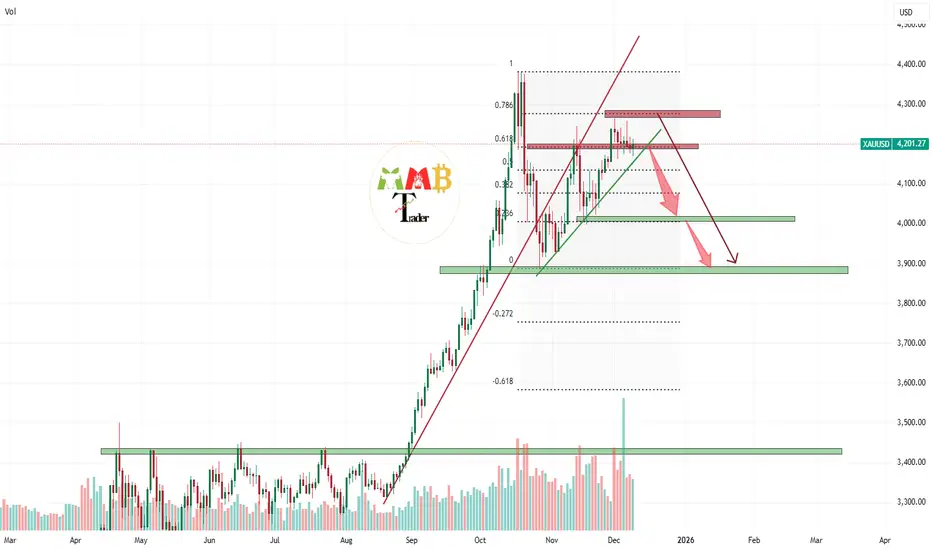
Gold the dump will continue this is just the beginning Gold is currently holding at the 0.786 Fibonacci retracement level, which is acting as a key resistance zone. Should this level continue to cap upward momentum, we anticipate a resumption of the bearish trend. Key resistance zones to monitor are located near $4,200 and, more significantly, $4,300. A rejection from these levels would support further downward movement, with our primary bearish target positioned below the $4,000 psychological threshold.
DISCLAIMER: ((trade based on your own decision))
<<press like👍 if you enjoy💚
USD/CAD Pair structure and forecast.USD/CAD – Market Structure & Forecast
USD/CAD has completed a strong bearish leg, breaking structure (BOS) on the way down and forming a clear demand zone near support. Price has recently shown signs of accumulation, including internal CHoCH signals indicating a potential shift from bearish to bullish order flow.
Current structure shows:
Multiple CHoCH signals around the low, suggesting buyers are stepping in.
A corrective push upward followed by a pullback into a POI (Point of Interest).
The POI aligns with a small demand zone inside the larger support area.
A bullish BOS above this POI supports continuation to the upside.
Projection:
If price respects the POI and maintains bullish structure, USD/CAD may expand upward toward the major resistance zone above 1.39600.
Bias: Bullish (as long as support and POI hold)
Key Levels:
Support: Demand zone at the bottom of the chart
POI: Minor demand where the pullback is expected
Target: Higher resistance block above 1.3960
What you think about USD/CAD, write in the comment section.

BNBUSDT the resistance Broke wait for volume and pumpAs observed on the chart, BNBUSDT has executed a decisive breakout above its descending channel, indicating a potential trend reversal. The price is now consolidating in a range, which is typical behavior following a significant breakout as the market digests the move and builds a new support base. We anticipate the next upward impulse to begin upon an increase in trading volume, which would confirm buyer commitment and likely propel price toward higher resistance targets.
DISCLAIMER: ((trade based on your own decision))
<<press like👍 if you enjoy💚

The market is dead unless the 0.000014$ breakThe technical structure for SHIB presents a high-potential setup, with a measured growth projection of 5x to 7x from the current price of $0.000008. However, this bullish scenario is contingent upon a decisive breakout above the two key descending trendlines, with a confirmed move beyond the $0.000014 resistance level required to validate the reversal and initiate the next upward phase.
DISCLAIMER: ((trade based on your own decision))
<<press like👍 if you enjoy💚

XAUUSD: Bullish Push to 4380?As the previous analysis worked exactly as predicted, FX:XAUUSD is eyeing a bullish breakout on the 1-hour chart , with price rebounding from a key support near cumulative buy liquidation, converging with a potential entry zone that could ignite upside momentum if buyers hold against short-term dips. This setup suggests a continuation opportunity amid the recent uptrend, targeting higher resistance levels with excellent risk-reward .🔥
Entry between 4155–4170 for a long position (entry at current levels with proper risk management is recommended. Targets at 4300 (first) , 4380 (second) . Set a stop loss at a close below 4130 , yielding a risk-reward ratio of approximately 1:3 to first target and up to 1:5 overall . Monitor for confirmation via a bullish candle close above entry with rising volume, leveraging gold's momentum near ATH.🌟
Fundamentally , gold is on pace for a fourth consecutive monthly gain in November 2025, rallying toward the $4,400 region amid increased Fed rate cut bets and its safe-haven appeal. As of November 28, prices hover around $4,200 after surging from $4,082 earlier in the week, driven by market expectations of Fed easing and global uncertainties, with forecasts eyeing further upside if resistance at $4200 breaks. 💡
📝 Trade Setup
🎯 Entry (Long):
4155 – 4170
(Entry at current levels also possible with proper risk management.)
🎯 Targets:
• 4300 (first)
• 4380 (second)
❌ Stop Loss:
• Close below 4130
⚖️ Risk-to-Reward:
• ~1:3 to first target
• Up to 1:5 overall
👇 Share your thoughts below! 👇
