EURAUD to find buyers at current market price?EURAUD - 24 expiry
The selloff is close to an exhaustion count on the intraday chart.
We expect a reversal in this move.
Risk/Reward would be poor to call a buy from current levels.
A move through 1.7775 will confirm the bullish momentum.
The measured move target is 1.7875.
We look to Buy at 1.7700 (stop at 1.7625)
Our profit targets will be 1.7850 and 1.7875
Resistance: 1.7800 / 1.7850 / 1.7875
Support: 1.7750 / 1.7700 / 1.7650
Risk Disclaimer
The trade ideas beyond this page are for informational purposes only and do not constitute investment advice or a solicitation to trade. This information is provided by Signal Centre, a third-party unaffiliated with OANDA, and is intended for general circulation only. OANDA does not guarantee the accuracy of this information and assumes no responsibilities for the information provided by the third party. The information does not take into account the specific investment objectives, financial situation, or particular needs of any particular person. You should take into account your specific investment objectives, financial situation, and particular needs before making a commitment to trade, including seeking, under a separate engagement, as you deem fit.
You accept that you assume all risks in independently viewing the contents and selecting a chosen strategy.
Where the research is distributed in Singapore to a person who is not an Accredited Investor, Expert Investor or an Institutional Investor, Oanda Asia Pacific Pte Ltd (“OAP“) accepts legal responsibility for the contents of the report to such persons only to the extent required by law. Singapore customers should contact OAP at 6579 8289 for matters arising from, or in connection with, the information/research distributed.
Support and Resistance

$NEAR short setupJust one more before the drop. 4:1. I dont really like trading lower caps because of volatility but this one, if we get the entry, might be a good one!

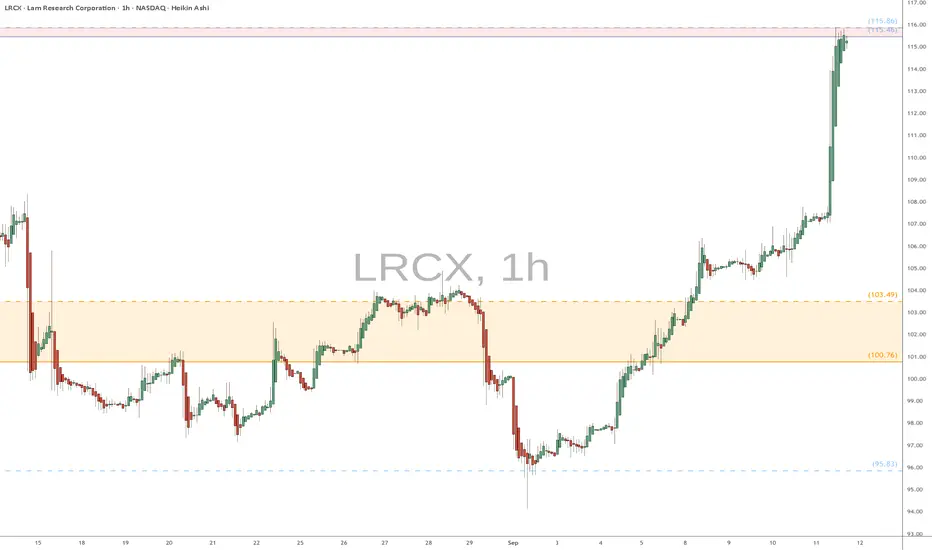
LRCX heads up at $115: Minor but Notable resistance to the SurgeLRCX surged into a minor but significant resistance
Combination of Genesis+Covid fibs at $115.46-115.86
Expecting a pullback from here, or orbit then drop.
.
Previous analysis that caught the PERFECT BreakOut:
Hit BOOST and FOLLOW for more PRECISE and TIMELY charts.
====================================================
.
#ML Mintlayer and the battle of the five armies ^^#ML Mintlayer fails to break the $0.2298 zone and faces a violent rejection. It pulls back just as harshly below the initial accumulation zone (golden pocket) to the next Fibonacci level around $0.0484 and is currently consolidating to form a support level in accumulation.
A relatively unexpected move for a project of this caliber.
The key zone/FLIP must act as support before considering higher targets. This refers precisely to the length of the upper wick from the December candle, marked on the chart with a red arrow.
Good luck accumulating, consolidating, or trading!

USD/CAD: Bears Take Control as 200DMA CracksFrom a technical standpoint, the short-term directional bias for USD/CAD is now swinging lower. While the longer-term uptrend remains firmly in place, the pair now finds itself in a minor downtrend, grinding lower for much of the past few weeks. Ahead of the FOMC and BoC decisions, the latest leg lower through minor support at 1.3980 saw it breach and close beneath the 200-day moving average.
One glance at the charts underlines just how important the level has been this year, capping and supporting the price for long periods once crossed. Now sitting above the pair with a negative slope, it may embolden bears to seek out further downside, allowing for setups where stops can be placed above it to protect against the risk of an abrupt reversal. For those considering bearish setups on the break, the preference would be to see a retest and rejection at the 200-day moving average before entry, with a sustained push beneath 1.3940 only enhancing the merits of the trade.
1.3900 looms as an initial target given it acted as both support and resistance earlier this year. With the 50-day moving average found just below it, the confluence of these levels will likely provide a decent hurdle for bears, should the price get there. 1.3830 is a minor level found below with the July uptrend sitting around the same region today.
Should the break of the 200-day moving average prove to be a bear trap with a reversal soon to follow, the favoured bearish setup could be flipped, allowing for longs to be established above with a stop below for protection. Again, if a reversal were to take place, the preference would be to see a back-test and bounce from the 200-day before entering the trade. 1.3980 looms as the first potential target with 1.4050 and 1.4080 options after that.
The momentum picture has changed noticeably over the past fortnight, with RSI (14) now trending lower beneath 50, indicating slowly building downside pressure. MACD has also staged a bearish crossover of the signal line but remains in positive territory, providing a cautionary message to bulls that directional strength is shifting.
Good luck!
DS

HANAUSDT.P LONG IDEAHİ all, i was watching hanausdt for a while. yellow box seems to me like accoumulationbox and every dip higher from former one. also marketcap of this coin is very very low so i want to try long position on it.
entry : 0.05420
stop : 0.04422
target area : between somewhere 0.07000 - 0.09000

GBP/NZD 📉 GBP/NZD – Technical & Fundamental Overview
🔍 Current Setup
- Price is hovering near a key support zone.
- A **retracement to 2.31636** (0.382 Fibonacci) is possible if GBP stabilizes.
- A **break below support** could trigger a move toward **2.26992**, the lower boundary of the descending channel.
---
🗞️ Latest GBP News – October 28, 2025
- **GBP weakened today** due to **soft inflation data** and **fiscal concerns**.
- UK inflation undershot expectations, reinforcing speculation of a **Bank of England rate cut**.
- The pound also faces pressure from rising **U.S. dollar strength** ahead of the Fed decision tomorrow.
- Despite a brief lift from risk-on sentiment tied to U.S.–China trade optimism, GBP remains vulnerable.
---
📆 Outlook for the Week
🔺 Bullish Scenario
- If UK data stabilizes and the Fed delivers a dovish cut, GBP could rebound.
- In this case, GBP/NZD may retrace toward **2.31636**, with potential to test higher resistance zones.
🔻 Bearish Scenario
- If UK macro data continues to disappoint or the Fed surprises hawkishly, GBP may extend losses.
- A break below current support could send GBP/NZD toward **2.26992**, aligning with broader downside momentum.
---
Traders should watch for confirmation around support levels and stay alert to macro headlines, especially the Fed’s rate decision and UK economic sentiment.

#109102025 | GBPCHF Demand Zone 1:15GBPCHF Demand Zone Appears in D1 Time Frame Looking Price Action for Long Term Buy
Risk and Reward Ratio is 1:15
After 50 pips Profit Set SL Entry Level
"DISCLAIMER" Trading & investing business is "Very Profitable" as well as risky, so any trading or investment decision should be made after Consultation with Certified & Regulated Investment Advisors, by Carefully Considering your Financial Situation.

SILVER: Bullish, But Retracing. Sell The Dip, Buy At the +FVG!SIlver, like the other metals, is bullish. Currently, price is retracement. This could present a selling opportunity.
The -FVG is holding price at bay, If the market continues to respect this premium array, look for short term sells down to the sellside liquidity at the relative equal lows at 46.70, in
route to the Weekly +FVG.
There, we will look for high probability buy setups.
This is an ERL to IRL move, my peoples.
*Price may sweep the consolidation high before dropping lower. So be mindful of the potential for a liquidity event before the move.
Enjoy!
May profits be upon you.
Leave any questions or comments in the comment section.
I appreciate any feedback from my viewers!
Like and/or subscribe if you want more accurate analysis.
Thank you so much!
Disclaimer:
I do not provide personal investment advice and I am not a qualified licensed investment advisor.
All information found here, including any ideas, opinions, views, predictions, forecasts, commentaries, suggestions, expressed or implied herein, are for informational, entertainment or educational purposes only and should not be construed as personal investment advice. While the information provided is believed to be accurate, it may include errors or inaccuracies.
I will not and cannot be held liable for any actions you take as a result of anything you read here.
Conduct your own due diligence, or consult a licensed financial advisor or broker before making any and all investment decisions. Any investments, trades, speculations, or decisions made on the basis of any information found on this channel, expressed or implied herein, are committed at your own risk, financial or otherwise.

GOLD: Bullish, But Retracing! Short Term Sell Opportunity!In this Weekly Market Forecast, we will analyze the Gold (XAUUSD) for the week of Oct. 27 - 31st.
Gold is still bullish, the current pullback it's in notwithstanding. Waiting patiently for valid buy setups is the sure way to go.
That being said, there is sell setup that could present an short-term opportunity. The Daily -FVG is currently holding price in check. Should price return to it and it continues to hold, a valid sell opportunity could present itself.
Be careful, as it is counter-trend. They can be lower-probability.
Enjoy!
May profits be upon you.
Leave any questions or comments in the comment section.
I appreciate any feedback from my viewers!
Like and/or subscribe if you want more accurate analysis.
Thank you so much!
Disclaimer:
I do not provide personal investment advice and I am not a qualified licensed investment advisor.
All information found here, including any ideas, opinions, views, predictions, forecasts, commentaries, suggestions, expressed or implied herein, are for informational, entertainment or educational purposes only and should not be construed as personal investment advice. While the information provided is believed to be accurate, it may include errors or inaccuracies.
I will not and cannot be held liable for any actions you take as a result of anything you read here.
Conduct your own due diligence, or consult a licensed financial advisor or broker before making any and all investment decisions. Any investments, trades, speculations, or decisions made on the basis of any information found on this channel, expressed or implied herein, are committed at your own risk, financial or otherwise.

Gold Prices Retreat from Record High- FOMC on TapGold prices are retreating from record highs with a decline of more than 11.3% now testing a major pivot zone at the 38.2% retracement of the August advance at 3973- looking for a reaction off this mark with a break / close below needed to suggest a more significant high is in place / a larger correction is underway. Subsequent support objectives rest with the 50% retracement / October open at 3846/59 with broader bullish invalidation steady at 3700/20.
Initial resistance remains with the 10/21 reversal close at 4125 with a breach / close above 4251 needed to mark resumption of the broader uptrend. Keep in mind this is a massive week for event risk with the FOMC, BoC, ECB, and the BoJ interest rate decisions on tap as the government shutdown extends into the fourth week. Stay nimble into the releases and watch the weekly close here for guidance.
-MB

US Dollar Coiled for Breakout ahead of the FedThe US Dollar is coiling just below resistance, with DXY trading within a contractionary range ahead of tomorrow’s FOMC rate decision. The index rallied nearly 3.5% off the yearly lows before stalling, with price consolidate within the first weekly range of October heading into the highly anticipated FOMC rate decision tomorrow. The focus is on a breakout of this range to drive the next directional move as we head into the close of the month.
Weekly support rests with the 61.8% retracement of the mid-September rally / 2025 low-week close (LWC) at 97.50/65. A break / weekly close below this threshold would threaten downtrend resumption toward the 2021 high at 96.94 and the June low at 96.37 – both areas of interest for possible downside exhaustion / price inflection IF reached. The next major technical consideration rests 94.65/97- a key pivot-zone defined by the March 2020 swing low, the 78.6% retracement of the 2021 advance, and the 100% extension of the 2023 decline. Look for a larger reaction there IF reached.
Weekly resistance is eyed at the 2023 low / 209 high / April low-week close (LWC) at 99.59/67 with bearish invalidation just higher at the 2024 low / LWC at 100.16/42- a breach / weekly close above this threshold is needed to suggest a more significant low is in place / a larger trend reversal is underway. Subsequent resistance objectives eyed at the 38.2% retracement of the yearly range at 101.55 and the 52-week moving average at 101.98.
Bottom line: The U.S. Dollar is coiled just below resistance, and the focus is on a breakout of the 97.50-99.66 range for guidance heading into the close of the month. From a trading standpoint, losses should be limited to 97.50 IF the Dollar is higher on this stretch with a breach above 100.41 needed to validate a more significant breakout in price.
-MB

$OPEN: The Gravity of Value and the Marathon RunnerNASDAQ:OPEN : The Gravity of Value and the Marathon Runner
Greetings, trader. The market is a living entity, and every chart tells a story of its breath—the constant inhale of accumulation and the exhale of distribution. Today, we observe NASDAQ:OPEN , and it's telling a fascinating tale of gravity and value.
The price has had a magnificent run, a powerful inhale. But as any #limitlessTrader knows, what goes up must eventually pause, reflect, or return to its source. We are now seeing the signs of that exhale, and it's our job to listen, not to predict.
The Technical Landscape: Reading the Map
To navigate, we must first learn to read the map. Two of our most trusted tools are the Volume Profile and Fibonacci Retracements.
1. Understanding Value (The VPVR) For those new to this perspective, look at the histogram on the left side of the chart. This is the Volume Profile (VPVR) . Think of it as an X-ray of the market, showing where traders have done the most business, not just when. It reveals the market's "fair price" zones.
We can see three key landmarks:
Point of Control (POC) at ~$2.75: This is the red line, the single price level with the most traded volume. It's the market's "center of gravity"—the most popular spot in the room.
Value Area High (VAH) at ~$8.50: This is the top of the "value area," where ~70% of all trading occurred. Think of it as the ceiling of the 'fair price' zone.
Value Area Low (VAL) at ~$1.50: This is the floor of that same 'fair price' zone.
2. Understanding Price Memory (The Fibonacci)
The other tool on our chart is the Fibonacci Retracement .
If the VPVR shows us space (where value is), the Fibonacci tool shows us memory (how price reacts to its own past).
We draw it from the start of a major move (the "swing low") to the end of that move (the "swing high"). The levels it creates (like 0.382, 0.5, 0.618) may be magic; they are percentages of that prior move. Traders all over the world watch these levels, so they often become self-fulfilling areas of support or resistance aka prophecies of a guru... to those unfamiliar — an echo of the market's past.
The Current Story: The Stretched Rubber Band
Now, let's combine these tools to read the current story.
Our current price is hovering just below the VAH of $8.50. This sets up a classic Mean Reversion thesis.
Mean reversion is the simple, philosophical idea that price, when stretched too far from its 'mean' (the POC), will eventually feel a gravitational pull to return.
The price is currently stretched far from its POC at $2.75. It has rallied up to the "ceiling" (the VAH). But that's not all. It's also failing to reclaim the 0.618 Fibonacci level (at $7.33) from the last swing. This failure at "price memory" combined with the rejection at the "value ceiling" is a powerful, bearish combination.
Trying to force a long position here is what we call "being a salmon" —it's swimming directly against two strong currents (value and price structure). It is a path of great resistance.
An Illustrative Setup: The Starting Line
A trade is simply a hypothesis with defined risk. It is not a prediction; it is a plan. This setup is purely illustrative, showing how one might structure a trade around this hypothesis.
This is a bearish (short) idea, anticipating a rejection from the VAH.
Hypothesis: The VAH ($8.50) and Fib resistance ($7.33) will hold, and the price will be pulled back toward its 'center of gravity.'
Entry (Short): $8.50 (Right at the VAH ceiling).
Invalidation (Stop-Loss): $9.26 (A clear sign the hypothesis is wrong).
Objective (Target): $3.77 (A logical support level, capturing the move).
This plan offers an exceptional 1:6.22 risk-to-reward ratio. This asymmetry is what we seek.
The Philosophy of the Race
Before we map out the run, we must clear our minds. Look at the chart; you can see a previous successful short setup that played out. A critical lesson for every trader is to not be fooled by the past. Just because the last "race" was won does not guarantee anything about this one. That was last quarter's marathon; this is a brand new day, a brand new race, with its own unique conditions. We must analyze the market as it is now , not as it was.
Now, to the plan. A trader works best with profits in their pockets.
Think of this trade plan as a marathon. My analysis simply shows one interpretation of a possible Start Line ($8.50) and a potential Finish Line ($3.77). But this race is long, fuzzy, and unpredictable.
What the runner (you) does at the checkpoints along the way is up to you. The Fibonacci levels at $6.24 (0.5) and $5.14 (0.382) are the checkpoints in this race. There are many ways to run this marathon:
The "Hydration" Method: The runner takes a "drink" (sells 1/3 of their position) at the first checkpoint ($6.24) and another drink at the second ($5.14), guaranteeing they bank profit. The "Pacing" Method: The runner starts the race, and as soon as they clear the first checkpoint ($6.24), they adjust their "pace" by moving their stop-loss to their entry ($8.50). The race is now "risk-free." The "Sprint" Method: The runner decides they don't want to run the full marathon. They sprint to the first major checkpoint ($6.24), take all their profits, and call it a day. A 1:2.97R race is still a fantastic trade.
Remember, this plan is just one piece of the puzzle. Your risk management is the frame that holds it all together. Listen to the market's breath, and manage your race in a way that keeps you running tomorrow.
Disclaimer: This is not financial advice. It is for educational and informational purposes only. Please conduct your own research and manage your risk accordingly.

DASH – Weekly Downside Outlook📉 After getting rejected near the December 2024 high at $72, CRYPTO:DASHUSD triggered a weekly reversal, shifting the broader structure bearish.
🔻 If momentum holds, price could grind lower over the next 6 months, with downside targets pointing toward $20.
#ElliottWave #PrivacyCoins #Altcoins

DXY RISING TRENDLINE BELOW|LONG|
✅DXY Price is respecting the rising trendline, showing consistent higher lows. Expect bullish continuation toward the target zone after the retest, as price seeks to rebalance inefficiency left from prior impulsive moves. Time Frame 7H.
LONG🚀
✅Like and subscribe to never miss a new idea!✅

CHF-JPY Will Keep Growing! Buy!
Hello,Traders!
CHFJPY retraced into a horizontal demand area after a clear bullish leg. SMC structure suggests continuation toward the supply area as liquidity above equal highs gets targeted. Time Frame 4H.
Buy!
Comment and subscribe to help us grow!
Check out other forecasts below too!
Disclosure: I am part of Trade Nation's Influencer program and receive a monthly fee for using their TradingView charts in my analysis.

ZKML – Downside Pressure Builds📉 The triple top near $0.30 marked a firm ceiling for the year, and since then, price has drifted sideways to lower.
🔻 As long as any upcoming bounce stays corrective below the October peak at $0.20, the structure favors another leg down.

SOLUSDTI think have this chart of BINANCE:SOLUSDT buy because breakout trendline and i see order-block in 194$. Target is end measured move (2-Leg) from low latest swing in 208$.
Please control your risk in any position.

USDCAD FREE SIGNAL|LONG|
✅USDCAD after tapping into the refined 4H demand level, price shows a bullish rejection candle, suggesting a potential long setup targeting the next short-term high. Smart money likely accumulating below liquidity pools.
—————————
Entry: 1.3944
Stop Loss: 1.3931
Take Profit: 1.3958
Time Frame: 4H
Setup Risk: High
—————————
LONG🚀
✅Like and subscribe to never miss a new idea!✅

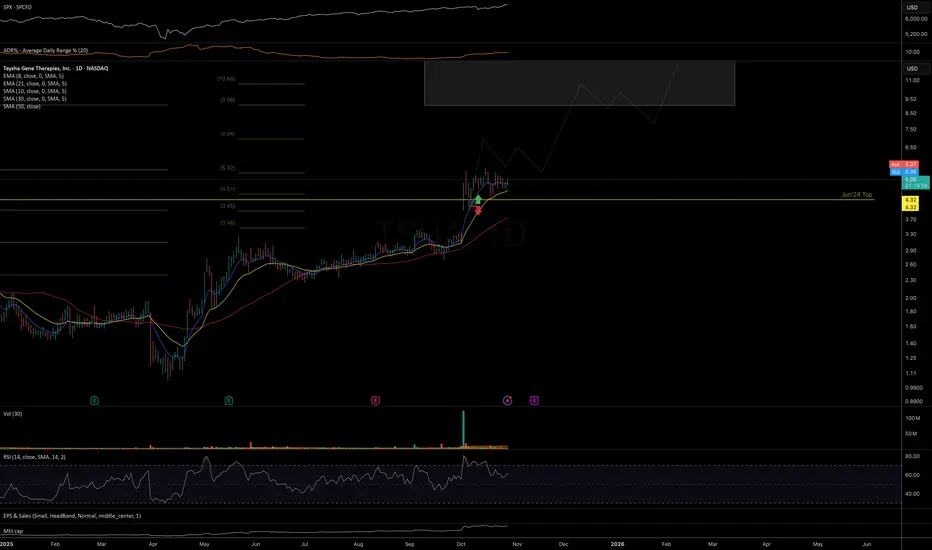
TSHA: substantial upside potentialPrice as been showing constructive four weeks of sideways consolidation following the early October gap-up move.
I continue to see substantial upside potential as long as price respects the 10-week MA on the macro view and the 21-day EMA in the more immediate perspective.
Daily chart:
Weekly chart:
Previously:
On bullish structure (Oct 2):
Chart:
www.tradingview.com
Nvidia Just Under Major SupportNvidia seems to have been pulled down by the Dow just like Apple as both are just under major support. I'm sorry for my previous Nvidia chart that drew support near 140, I recognize where I screwed up, but this chart should be good. Fortunately actual 117 support wasn't that far below and my NVDA isn't too in the red.
NVDA has the lowest revenue multiple in years right now. I know it's well off it's long term trend line, but it's growth rate is unlike anything it's ever been so expecting a steeper trend line to appear makes a lot of sense. Eventually I would imagine we'll get back to that trend line, but not anytime soon.
The Dow hitting major support should finally lift NVDA and the others that have been dragged down like AAPL and AMZN.
Good luck!

EUR-USD Clear Rejection! Buy!
Hello, Traders!
EURUSD After a deep rejection from the horizontal demand area, price shows bullish intent with a clean break of short-term structure. Expect continuation toward the target zone. Time Frame 4H.
Buy!
Comment and subscribe to help us grow!
Check out other forecasts below too!
Disclosure: I am part of Trade Nation's Influencer program and receive a monthly fee for using their TradingView charts in my analysis.

Integra LifeSciences Holdings | IART | Long at $12.39Integra LifeSciences Holdings Corp NASDAQ:IART manufactures and sells surgical instruments, neurosurgical products, and wound care solutions for neurosurgery, neurocritical care, otolaryngology, orthopedics, and general surgery. The stock has fallen over the past few years due to earnings misses / lowered earnings per share guidance, slow revenue growth, and operational challenges / recalls. But the company has been around since 1989 (endured many ups and downs during that time), has over 4,000 employees, a book value near $20 (undervalued), a forward price-to-earnings between 6x-9x (depending on the source), and revenue growth beyond 2025 and into 2028. Debt is slightly high with a debt-to-equity ratio of 1.2x and a quick ratio near 0.8x (company may have difficulty meeting its short-term obligations with its most liquid assets), it is thus a risky play. But the valuation and potential turnaround should get some attention.
From a technical analysis perspective, the stock price has entered and exited my "crash" simple moving average area 3 times now (see green lines). While I think $10 is likely in the near-term, it appears the stock *may* be forming a bottom - especially given the book value is more than 60% from the current price. But, as always, medical device stocks are always a major investment risk, so due diligence is needed.
Thus, at $12.39, NASDAQ:IART is in a buy zone with a note regarding the potential for a dip near $10 before a move up. Targets will be kept low for a swing trade.
Targets:
$15.00 (+21.0%)
$16.50 (+33.2%)
