GBPUSD is in the Selling DirectionHello Traders
In This Chart GBPUSD HOURLY Forex Forecast By FOREX PLANET
today GBPUSD analysis 👆
🟢This Chart includes_ (GBPUSD market update)
🟢What is The Next Opportunity on GBPUSD Market
🟢how to Enter to the Valid Entry With Assurance Profit
This CHART is For Trader's that Want to Improve Their Technical Analysis Skills and Their Trading By Understanding How To Analyze The Market Using Multiple Timeframes and Understanding The Bigger Picture on the Charts
Support and Resistance

GBPAUD is in the Bullish Trend due to Counter TrendHello Traders
In This Chart GBPAUD HOURLY Forex Forecast By FOREX PLANET
today GBPAUD analysis 👆
🟢This Chart includes_ (GBPAUD market update)
🟢What is The Next Opportunity on GBPJPY Market
🟢how to Enter to the Valid Entry With Assurance Profit
This CHART is For Trader's that Want to Improve Their Technical Analysis Skills and Their Trading By Understanding How To Analyze The Market Using Multiple Timeframes and Understanding The Bigger Picture on the Charts

Silver is in the Bearish directionHello Traders
In This Chart XAGUSD HOURLY Forex Forecast By FOREX PLANET
today XAGUSD analysis 👆
🟢This Chart includes_ (XAGUSD market update)
🟢What is The Next Opportunity on XAGUSD Market
🟢how to Enter to the Valid Entry With Assurance Profit
This CHART is For Trader's that Want to Improve Their Technical Analysis Skills and Their Trading By Understanding How To Analyze The Market Using Multiple Timeframes and Understanding The Bigger Picture on the Charts

Location 15m NY Session 4 Dec 2025There are 3 setups based on 15 minute structure on 4th December 2025.
Location 1 :
- Trend sell
- Structure breakout sell
Location2 :
- Structure breakout sell
Location 3 :
- Trend sell
- Structure breakout sell

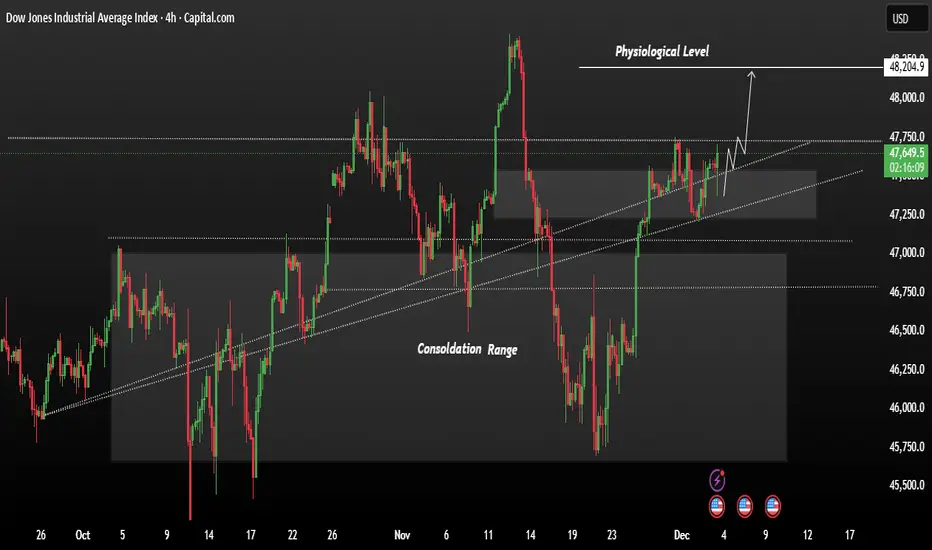
US3O showing strong bullish momentumUS30 is trading in a steady upward channel after breaking out of its previous consolidation range. Price is holding above support and showing strong bullish momentum.
As long as it stays above the current breakout zone, the market is positioned to push higher toward the next psychological level around 48,205. Buyers remain in control, and any pullbacks into the trendline support may attract fresh buying pressure.
If the price test the support level after again price range bullish from the current range we could expect price remains chance for bullish pattern.
You may find more details in the chart.
Trade wisely best of Luck buddies.
Ps; Support with like and comments for better analysis thanks for supporting.
Location 30m NY Session 4 Dec 2025There are 2 setups based on a single location 30 minute structure on 4th December 2025.
Location 1 :
- Trend sell
- Structure breakout sell

ETHUSDT Channel broke and target is 3800$ now As observed on the chart, Ethereum has broken out of its previous channel structure and is currently consolidating within a defined range. This period of consolidation following a breakout is a typical technical development, often serving to build energy for the next directional move. Based on the prevailing structure, we anticipate a resumption of upward momentum following this phase of range-bound action, with the potential for a significant bullish impulse once accumulation is complete.
DISCLAIMER: ((trade based on your own decision))
<<press like👍 if you enjoy💚

EURUSD target 1.22 soon or late can hit EURUSD is currently consolidating near the 1.1650 level, exhibiting range-bound behavior. While a retracement toward the 1.1500 support zone remains possible in the near term, our broader technical outlook maintains a bullish bias, with a primary target at 1.2200.
We are maintaining our long position through this period of potential near-term correction, as the underlying trend structure continues to support the longer-term bullish scenario. Any pullback to the 1.1500 region is viewed as a potential opportunity to add to the position or as a healthy consolidation before the next leg higher. Our trade plan remains valid unless price action breaks below the key support level, which would prompt a reassessment of the bullish thesis.
DISCLAIMER: ((trade based on your own decision))
<<press like👍 if you enjoy💚

Location 15m NY Session 3 Dec 2025 There are 2 setups based on a 15 minute structure on 2nd December 2025.
Location 1 :
- Trend buy
- Structure breakout buy
location 2 :
- Trend buy
- Structure breakout buy

Btcusd Btcusd I explained why am expecting price to go up this is the full chat I pray it show full this time

Btcusd Hello am very mush bullish on btcusd am expecting btcusd to have a little of retracment on a daily and have a change of structure on the 4hrs then I will go long on btcusd because from de 3 months to 1 day we are bullish so no need selling when we are bullish will be dropping entry soon

Location 30m NY Session 2 Dec 2025There are 2 setups based on a 30 minute structure on 2nd December 2025.
Location 1 :
- Trend buy
- Structure breakout buy
Location 2 :
- Trend buy
- Structure breakout buy

KSE 100, Market Stance - Cautious Optimism with DisciplineMy stance remains very cautious regarding fresh buying. This week is likely to be bullish. My approach is to capitalize on the rally, book profits aggressively, and enjoy the upside while it lasts.
Freeing up at least 50% cash is strongly advised.
Historically, mutual funds tend to sell towards the end of December, and a fake-out rally remains a very real possibility.
A sustainable and stronger rally will only materialize if smart money gets the opportunity to buy at discounted levels, which may happen if the index corrects toward 160K or even 152K.
I sincerely wish to be proven wrong but experience has taught me the hard way.
Hence, the mantra is simple:
NEVER LOSE AGAIN
🔴 Resistance:
R1: 170,000
R2: 171,100
R3: 174,900
🟢 Support:
S1: 166,000
S2: 163,000
S3: 160,000
Rest with Allah Kareem…
Regards,
Arsalan Anwer
Stags

BTCUSDT – Final Liquidity Sweep Before a Push to 95–96K?DISCLAIMER:
Not Investment Recommendation or Financial Advice.
This analysis is purely for educational purposes and to test a trading strategy.
BTCUSDT – Final Liquidity Sweep Before a Push to 95–96K?
Bullish scenario forming on the 4H despite macro resistance
BTC continues its recovery from the strong correction that drove price from $125K down to $81K. Since that capitulation low, the market has been printing a sequence of higher highs and higher lows, forming a constructive 4H bullish structure.
After reaching a rebound high around $94K, BTC corrected again into the $88K zone, where liquidity was collected and buyers defended the level. Price is now consolidating near $89K, directly below key dynamic resistance.
🔥 Key Technical Factors
1. Weekly & Daily EMA-50 Acting as Dynamic Resistance
BTC is running out of time to break above the EMA 50 on both weekly and daily timeframes, a major level controlling the macro trend.
A confirmed break above this band would re-activate bullish continuation toward prior supply.
2. Higher-Timeframe Market Structure Remains Constructive
From the $81K low, BTC has developed:
Higher lows showing demand absorption
Higher highs confirming controlled bullish momentum
Well-defined liquidity zones above and below price
3. 4H Indicators Signaling Momentum Shift
Multiple 4H indicators are aligning:
MACD curling upward
Stochastics crossing up from oversold
ADX rising, indicating trend strength building
These signals support the potential for a bullish breakout.
4. Liquidity Mechanics
There is still untapped liquidity below the recent local low.
A final liquidity sweep into this area could be likely be the catalyst for the next upward leg.
🎯 Upside Target Zone: 95K–96K
BTC next logical targets based on:
liquidity heatmaps
volume profile gaps
prior breakdown levels
…are between $95,000 and $96,000.
Fundamentals may support this: the expected 25bps Fed rate cut this week could inject short-term bullish momentum into risk assets.
📌 Summary
BTC remains in a structural uptrend on the 4H chart.
The most probable sequence:
Sweep remaining downside liquidity
Bullish reversal confirmation
Continuation toward 95–96K
As long as $87.8K–$88K holds, the bullish setup remains intact.

The AI Boom's Unsung HeroThe rise of artificial intelligence isn’t just shaking up tech companies it’s quietly transforming the global silver market in a big way. As major players like NVIDIA, Google and others ramp up their AI infrastructure silver is becoming more critical than ever. Why? Because silver, thanks to its unmatched electrical conductivity, plays a key role in powering the hardware behind AI.
Silver is the most conductive metal on Earth. That makes it perfect for high-performance computing something AI needs a lot of. It’s especially important in data centers and advanced semiconductors, where both electrical and thermal performance are mission-critical.
What’s really interesting is that AI servers tend to use two to three times more silver than traditional data center servers. That’s because AI workloads are more power-hungry, generate more heat and require more complex cooling and electrical systems. Simply put, more AI means more silver.
If there’s one company at the heart of this trend it’s NVIDIA. Analysts at Morgan Stanley expect NVIDIA to consume a staggering 77% of all silicon wafers used for AI accelerators in 2025 up from 51% in 2024. That adds up to around 535,000 300-mm wafers a year each of which contains silver in key components.
All of this AI growth is showing up in the numbers. Industrial silver demand hit an all-time high of 680.5 million ounces in 2024. The electronics industry alone uses around 250 million ounces per year and AI is now the fastest-growing part of that.
Despite all this demand, silver supply just isn’t keeping up. The market’s been in deficit for four straight years, with a total shortfall of 678 million ounces between 2021 and 2024. That’s roughly ten months of global mine output gone missing from the balance sheet.
It’s no surprise, then, that silver prices have been climbing fast. As of July 2025 silver’s up nearly 30% for the year. Looking further ahead I see room for silver to keep climbing:
In the short term (2025): $36–$42 per ounce seems realistic
By 2026: Potential for $50+ as more AI growth stays strong
AI isn’t just changing how we work, communicate, or compute—it’s literally reshaping the commodities that make this technology possible. Silver, once thought of mainly in the context of jewelry or coins, is now a backbone material for the AI revolution.

A Clear way to Trade & make profitThis method am about to explain to you has been tested & battle proofed, it is the same trading method taught at Trading school academies & is how the pro traders trade. if followed it would yield 65 to 75 probability in your favor on charts with day or smaller timeframes and a 75 to 90 probability on swing trades especially in week timeframe. Am sharing it from the goodness of my heart & selfishly motivated to reach more probability score if more people trade like this.. this will be more of a self fulfilling prophecy..
identify the Longterm trend.
After identifying the longterm trend & identifying the last HL (higher Low) of the uptrend. put a line on that! this is your DZ (demand zone) this is the area you want to buy, your buy order waits, dont chase. time your Entry using a smaller timeframe chart.
Identify your Risk
You should be calculating your risk before calculating your reward. in other words identify how much you are willing to risk (money $) before you get out. This is your STP Loss price-where your stop loss order is triggered. If your STP Loss is triggered, you are out! you had a Small Loss, you can handle it.
When to sell & claim profit Rw (Reward, profit)
Identify your Pt (Profit Target)s, this part I will save for later, and reveal only when we have 1000 Likes - followers
Risk to Reward Ratio
This is important, it deserves its own section. Rs is your (Risk) and Rw is your (Reward). The correct reward ratio is 1 to 6 meaning you are willing to Risk 1 dollar for each 6 dollars of reward-profit. Any trades with lower ratio is more risky & can be taken at the trader's own discretion. for example a low score of 1 to 3 yields less profit & more aggressive risk appetite.
here is an example

USDCAD MARKET OUTLOOK!Here’s a market outlook on USDCAD from the daily timeframe and technically, we’re expecting a significant rise as price dropped closer to a support level. I expect a rebound to make a pullback of the impulse move that market made couple of days ago. Therefore, we’d monitor price from intraday perspective for a time price will shift from intraday bearish to bullish to make entries. A buy opportunity is envisaged.

EURUSD | Into The Next WeekLooking for a bullish continuation into the next week for both EURUSD and GBPUSD. Both looking strong.
I have 2 best case possibilities shown on the chart.
we either see a direct move to the upside, will be looking for bullish setups for the rest of the week.
Or we see a small drop first into the lower time frame support, and again a move up.
Let me know what your outlook is on EURUSD!
Stay safe out there and do your own due diligence, this is not investment advise!

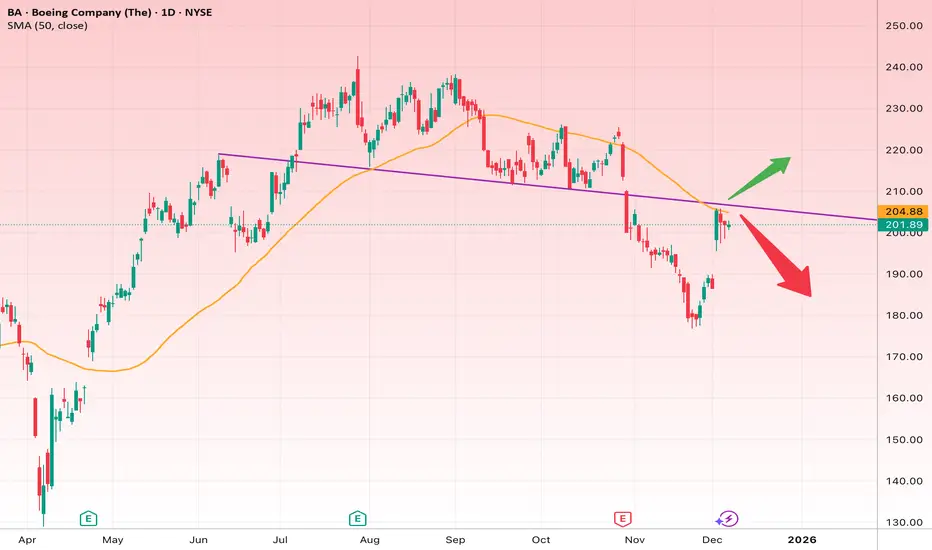
Boeing at a Make-or-Break Level: Rejection or Reversal?Boeing (BA) is currently retesting a long-term descending resistance (the purple trendline).
Price is also below the 50-day SMA (204.88), which is acting as dynamic resistance.
This zone around 202–205 is a very important decision point.
Bullish Scenario (Green Arrow)
If BA breaks above 205 and closes above the descending trendline:
• Target 1: 214
• Target 2: 222
• Target 3: 230 (major resistance)
Stop-loss for longs: below 198
Bearish Scenario (Red Arrow)
If BA gets rejected from 202–205:
• Target 1: 190
• Target 2: 182
• Target 3: 172 (major support)
Stop-loss for shorts: above 207
Short Fundamental Summary
• Boeing still struggles with production delays and quality issues.
• Demand for commercial aircraft remains high, but execution problems limit growth.
• Cash flow improving slowly but still under pressure.
• Market sentiment remains mixed—technicals currently drive price more than fundamentals.
Overall bias:
Bearish-to-neutral unless the breakout above 205 is confirmed.
USDJPY: Expect Reversal.USDJPY is trending on descending channel of lower lows and highs. the pair have on bearish momentum move, for the past two weeks now, after respecting the resistance zone in regards to the weekly time frame chart. here the structure clearly display the price moving down in downtrend form.
Meanwhile, we anticipate a retracement below the trendline.
Possible outline;
A confirmed reversion below the trend resistance, would set off a sell position to 154.10 as partial target.
Thanks for reading.

GOLD (XAUUSD): Sticking to The Plan
Gold stuck on a key daily resistance this week.
To buy, we continue waiting for its breakout.
A daily candle close above 4266 will confirm a violation.
A bullish continuation will be expected to 4355 then.
❤️Please, support my work with like, thank you!❤️
I am part of Trade Nation's Influencer program and receive a monthly fee for using their TradingView charts in my analysis.

EURUSD: Support & Resistance Analysis for Next Week 🇪🇺🇺🇸
Here is my latest support and resistance analysis
for EURUSD for next week.
Consider these structure for pullback/breakout trading.
❤️Please, support my work with like, thank you!❤️
I am part of Trade Nation's Influencer program and receive a monthly fee for using their TradingView charts in my analysis.

FireHoseReel | BNB Daily Analysis #18🔥 Welcome To FireHoseReel !
Let’s dive into BinanceCoin (BNB) analysis.
👀 BNB 1H Overview
BNB is still holding the same position as yesterday, and due to the holiday period, the market hasn’t shown major changes. I’ve only adjusted the newly formed resistance slightly and moved it to $898.22.
📊 Volume Analysis
BNB volume was very low yesterday, but today it’s showing a moderate increase. Sundays usually bring more activity than Saturdays, so with rising volume, any trigger activation could lead to a faster move.
✍️ BNB Trading Scenarios
🟢 Long Scenario:
A breakout above the newly formed resistance at $898.22, supported by rising buy volume, could act as a risky long trigger. The next key long level lies around $922.57.
🔴 Short Scenario:
A 15-minute base has formed in this zone, which may offer a quick entry with a tight stop. The main short trigger is at $877.33—a confirmed break with volume could validate a short entry.
🧠 Protect your capital first. No setup is worth blowing your account. If risk isn’t controlled, profit means nothing. Trade with rules, not emotions.
