Tilaknagar near breakout zone CMP 497Tilaknagar closed above 2 months high if momentum continues the we can see 580 soon
Support and Resistance

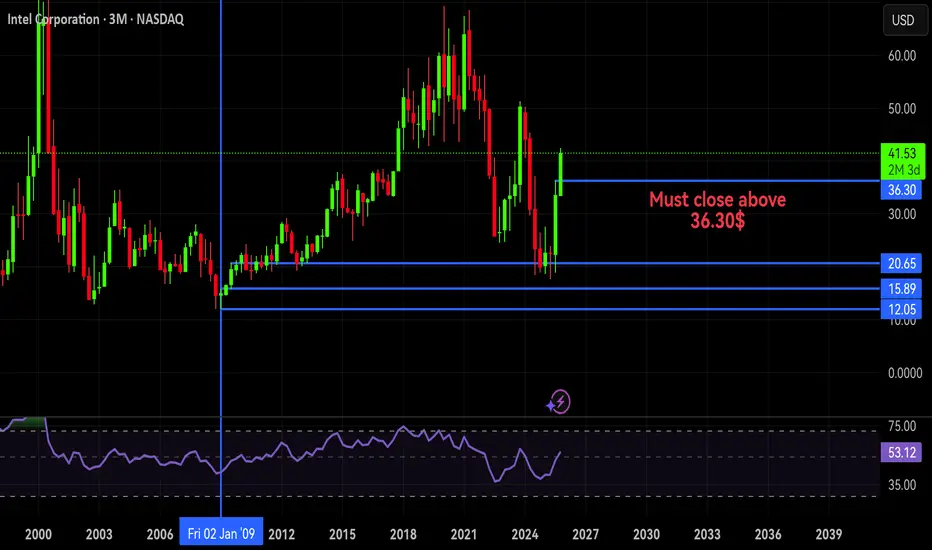
Intc 3 months chartIntel stock (INTC)
If it closes above the $36.30 level by the end of this year,
it will turn bullish 😉😉
Wish you a good catch! 🎣
Ahmad adly🃏
Gold prices still face the risk of falling further
News:
Gold prices weakened again in U.S. trading on Monday (October 27), extending last week's decline. With the thaw in U.S.-China trade relations, investor demand for gold as a safe-haven asset has declined. Market focus has now shifted to the Federal Reserve's interest rate decision, which is expected to be a rate cut later this week.
Spot gold prices fell below $4,000 an ounce on Monday, hitting a three-week low of $3,885 an ounce at one point, as improved market sentiment weakened demand for the safe-haven metal.
Specifically:
Gold daily level: Yesterday closed with a big negative, losing the middle track support. Originally expected to close with a cross or a small positive or negative today, to rebound and confirm the middle track resistance and then rise and fall, to prepare for a wave of pull-ups after tomorrow's interest rate cut, it is also easy to cause a false fall after the middle track breaks, tempting investors to follow the trend and continue to bearish at low levels; but in fact, today continued to fall.
At present, the price of gold has fallen below the previous terraced support band in the 4-hour trend. The K-line continues to be under pressure and the short-term moving average maintains a good volatile downward trend. In the short term, we will pay attention to whether there will be a second downward trend after the rebound and repair.
Today's focus is on the 4000-20 area to suppress the decline, and breaking through 3970-75 to look below 3900. The target has been achieved. After the short-term plunge in gold, and with the Federal Reserve's interest rate decision approaching, the bulls and bears will play a tug-of-war.
Trading strategy:
Buy: 3990-3985, SL: 4050, TP: 3930-3910

A SELL We are selling at 3985-3990 sl at 4010 and tp far below, if it fails to sell then there is a shift to bullishness

GBPUSD: Anticipating A Reversal Or Breakdown ?GBPUSD is currently at the support zone. the pair have been trending downward, which it is now retracing slowly above the support level. though there is still a slight possibility of breakdown below this zone, in respect to the structure.
Possible Outline;
A clear reversal above the support would activate upward rise to 1.3353 as potential target.
While a breakout below would be triggering downward move to 1.3165 as next partial target.
Follow up and share your opinion on this..
Thanks for reading.

A SELL We are selling at 3985-3990 sl at 4010 and tp far below, if it fails to sell then there is a shift to bullishness

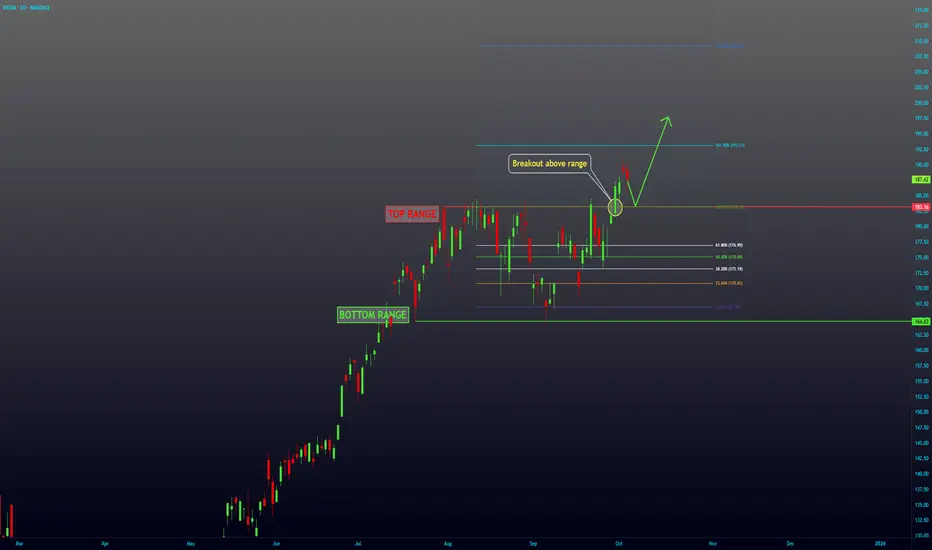
NVDA Breakout -- Continuation UPNASDAQ:NVDA has been in a range since end of July until September 30th, where it broke above the range. I expect to see more upside from here.
AMZN Break Out -- Bullish1HR time frame paints a good picture of what's to come in the short term...at least from my perspective.
AMZN finally broke through the sideways chop today with momentum and pushed to the 1.618 fib (from the closed peak of the last wave on 10/3 to the closed low on 10/6).
RSI showing momentum and in an upward trend despite the recent choppiness since 9/25.
RSI peaked at about 77, and looking to cooldown after the breakout. I suspect we'll see price revisit mid $223 before continuing upwards. Will most likely see stair stepping up to the $230's.

GOLD BEARISH BIAS|SHORT|
✅XAUUSD is reacting from a major supply level after a clean rejection of premium territory. Expect bearish continuation as price seeks to close the imbalance toward the marked target zone. Time Frame 4H.
SHORT🔥
✅Like and subscribe to never miss a new idea!✅

GOLD Free Signal! Sell!
Hello,Traders!
GOLD reacted precisely from the horizontal supply area, showing displacement and lower-timeframe structure breaks. A bearish move is expected as liquidity above the previous high was swept.
-------------------
Stop Loss: 3,993$
Take Profit: 3,882$
Entry: 3,938$
Time Frame: 3H
-------------------
Sell!
Comment and subscribe to help us grow!
Check out other forecasts below too!
Disclosure: I am part of Trade Nation's Influencer program and receive a monthly fee for using their TradingView charts in my analysis.

$GOLD is COOKED! Rotation into $BTC Soon!!MARKETS ARE SIGNALING RISK-ON 🔥
TVC:GOLD is so unbelievably COOKED 👨🍳
3 Black Crowes printed on the Daily, with a decisive close below the 20MA 🗡️
Waiting on the final nail in the coffin to close below the DANGER ZONE ~$3,900 where we will then see GOLD retest the 50MA along with the 50% Gann retrace $~3,750 ⚠️
I very much expect the rotation into CRYPTOCAP:BTC soon 👑

Joby Aviation - Breakout Complete - ABC Correction Underway
After a strong impulse wave up, the chart is now tracing a predictable ABC corrective pattern.
My suite of Fibonacci tools—especially the critical 0.786 retracement level—points to a likely downside target near $8 for the completion of wave C.
This is a healthy pullback within the larger bullish trend, offering a potential entry for the next leg up.
Tools used Fib/ Anchored Vwap , volume profile and TPO Chart

EURAUD to find buyers at current market price?EURAUD - 24 expiry
The selloff is close to an exhaustion count on the intraday chart.
We expect a reversal in this move.
Risk/Reward would be poor to call a buy from current levels.
A move through 1.7775 will confirm the bullish momentum.
The measured move target is 1.7875.
We look to Buy at 1.7700 (stop at 1.7625)
Our profit targets will be 1.7850 and 1.7875
Resistance: 1.7800 / 1.7850 / 1.7875
Support: 1.7750 / 1.7700 / 1.7650
Risk Disclaimer
The trade ideas beyond this page are for informational purposes only and do not constitute investment advice or a solicitation to trade. This information is provided by Signal Centre, a third-party unaffiliated with OANDA, and is intended for general circulation only. OANDA does not guarantee the accuracy of this information and assumes no responsibilities for the information provided by the third party. The information does not take into account the specific investment objectives, financial situation, or particular needs of any particular person. You should take into account your specific investment objectives, financial situation, and particular needs before making a commitment to trade, including seeking, under a separate engagement, as you deem fit.
You accept that you assume all risks in independently viewing the contents and selecting a chosen strategy.
Where the research is distributed in Singapore to a person who is not an Accredited Investor, Expert Investor or an Institutional Investor, Oanda Asia Pacific Pte Ltd (“OAP“) accepts legal responsibility for the contents of the report to such persons only to the extent required by law. Singapore customers should contact OAP at 6579 8289 for matters arising from, or in connection with, the information/research distributed.

$NEAR short setupJust one more before the drop. 4:1. I dont really like trading lower caps because of volatility but this one, if we get the entry, might be a good one!

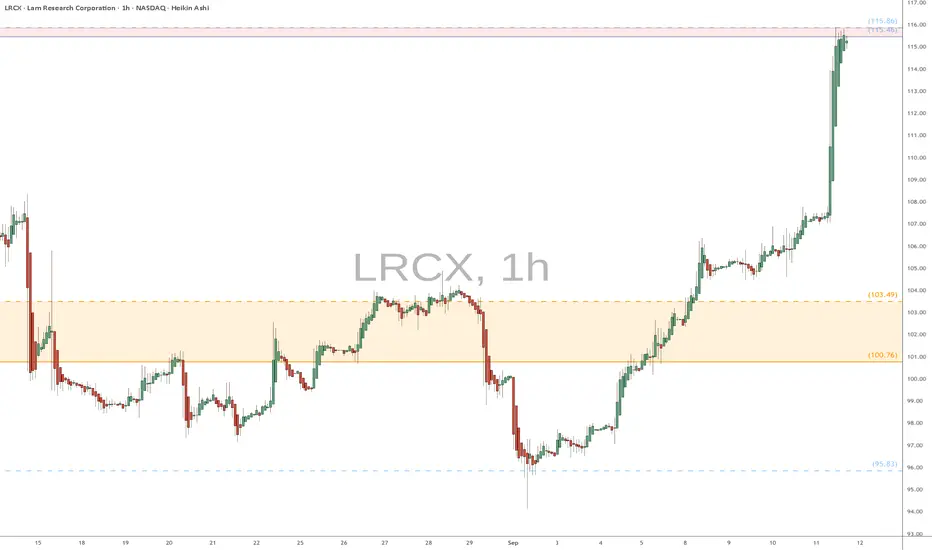
LRCX heads up at $115: Minor but Notable resistance to the SurgeLRCX surged into a minor but significant resistance
Combination of Genesis+Covid fibs at $115.46-115.86
Expecting a pullback from here, or orbit then drop.
.
Previous analysis that caught the PERFECT BreakOut:
Hit BOOST and FOLLOW for more PRECISE and TIMELY charts.
====================================================
.
#ML Mintlayer and the battle of the five armies ^^#ML Mintlayer fails to break the $0.2298 zone and faces a violent rejection. It pulls back just as harshly below the initial accumulation zone (golden pocket) to the next Fibonacci level around $0.0484 and is currently consolidating to form a support level in accumulation.
A relatively unexpected move for a project of this caliber.
The key zone/FLIP must act as support before considering higher targets. This refers precisely to the length of the upper wick from the December candle, marked on the chart with a red arrow.
Good luck accumulating, consolidating, or trading!

USD/CAD: Bears Take Control as 200DMA CracksFrom a technical standpoint, the short-term directional bias for USD/CAD is now swinging lower. While the longer-term uptrend remains firmly in place, the pair now finds itself in a minor downtrend, grinding lower for much of the past few weeks. Ahead of the FOMC and BoC decisions, the latest leg lower through minor support at 1.3980 saw it breach and close beneath the 200-day moving average.
One glance at the charts underlines just how important the level has been this year, capping and supporting the price for long periods once crossed. Now sitting above the pair with a negative slope, it may embolden bears to seek out further downside, allowing for setups where stops can be placed above it to protect against the risk of an abrupt reversal. For those considering bearish setups on the break, the preference would be to see a retest and rejection at the 200-day moving average before entry, with a sustained push beneath 1.3940 only enhancing the merits of the trade.
1.3900 looms as an initial target given it acted as both support and resistance earlier this year. With the 50-day moving average found just below it, the confluence of these levels will likely provide a decent hurdle for bears, should the price get there. 1.3830 is a minor level found below with the July uptrend sitting around the same region today.
Should the break of the 200-day moving average prove to be a bear trap with a reversal soon to follow, the favoured bearish setup could be flipped, allowing for longs to be established above with a stop below for protection. Again, if a reversal were to take place, the preference would be to see a back-test and bounce from the 200-day before entering the trade. 1.3980 looms as the first potential target with 1.4050 and 1.4080 options after that.
The momentum picture has changed noticeably over the past fortnight, with RSI (14) now trending lower beneath 50, indicating slowly building downside pressure. MACD has also staged a bearish crossover of the signal line but remains in positive territory, providing a cautionary message to bulls that directional strength is shifting.
Good luck!
DS

HANAUSDT.P LONG IDEAHİ all, i was watching hanausdt for a while. yellow box seems to me like accoumulationbox and every dip higher from former one. also marketcap of this coin is very very low so i want to try long position on it.
entry : 0.05420
stop : 0.04422
target area : between somewhere 0.07000 - 0.09000

GBP/NZD 📉 GBP/NZD – Technical & Fundamental Overview
🔍 Current Setup
- Price is hovering near a key support zone.
- A **retracement to 2.31636** (0.382 Fibonacci) is possible if GBP stabilizes.
- A **break below support** could trigger a move toward **2.26992**, the lower boundary of the descending channel.
---
🗞️ Latest GBP News – October 28, 2025
- **GBP weakened today** due to **soft inflation data** and **fiscal concerns**.
- UK inflation undershot expectations, reinforcing speculation of a **Bank of England rate cut**.
- The pound also faces pressure from rising **U.S. dollar strength** ahead of the Fed decision tomorrow.
- Despite a brief lift from risk-on sentiment tied to U.S.–China trade optimism, GBP remains vulnerable.
---
📆 Outlook for the Week
🔺 Bullish Scenario
- If UK data stabilizes and the Fed delivers a dovish cut, GBP could rebound.
- In this case, GBP/NZD may retrace toward **2.31636**, with potential to test higher resistance zones.
🔻 Bearish Scenario
- If UK macro data continues to disappoint or the Fed surprises hawkishly, GBP may extend losses.
- A break below current support could send GBP/NZD toward **2.26992**, aligning with broader downside momentum.
---
Traders should watch for confirmation around support levels and stay alert to macro headlines, especially the Fed’s rate decision and UK economic sentiment.

#109102025 | GBPCHF Demand Zone 1:15GBPCHF Demand Zone Appears in D1 Time Frame Looking Price Action for Long Term Buy
Risk and Reward Ratio is 1:15
After 50 pips Profit Set SL Entry Level
"DISCLAIMER" Trading & investing business is "Very Profitable" as well as risky, so any trading or investment decision should be made after Consultation with Certified & Regulated Investment Advisors, by Carefully Considering your Financial Situation.

SILVER: Bullish, But Retracing. Sell The Dip, Buy At the +FVG!SIlver, like the other metals, is bullish. Currently, price is retracement. This could present a selling opportunity.
The -FVG is holding price at bay, If the market continues to respect this premium array, look for short term sells down to the sellside liquidity at the relative equal lows at 46.70, in
route to the Weekly +FVG.
There, we will look for high probability buy setups.
This is an ERL to IRL move, my peoples.
*Price may sweep the consolidation high before dropping lower. So be mindful of the potential for a liquidity event before the move.
Enjoy!
May profits be upon you.
Leave any questions or comments in the comment section.
I appreciate any feedback from my viewers!
Like and/or subscribe if you want more accurate analysis.
Thank you so much!
Disclaimer:
I do not provide personal investment advice and I am not a qualified licensed investment advisor.
All information found here, including any ideas, opinions, views, predictions, forecasts, commentaries, suggestions, expressed or implied herein, are for informational, entertainment or educational purposes only and should not be construed as personal investment advice. While the information provided is believed to be accurate, it may include errors or inaccuracies.
I will not and cannot be held liable for any actions you take as a result of anything you read here.
Conduct your own due diligence, or consult a licensed financial advisor or broker before making any and all investment decisions. Any investments, trades, speculations, or decisions made on the basis of any information found on this channel, expressed or implied herein, are committed at your own risk, financial or otherwise.

GOLD: Bullish, But Retracing! Short Term Sell Opportunity!In this Weekly Market Forecast, we will analyze the Gold (XAUUSD) for the week of Oct. 27 - 31st.
Gold is still bullish, the current pullback it's in notwithstanding. Waiting patiently for valid buy setups is the sure way to go.
That being said, there is sell setup that could present an short-term opportunity. The Daily -FVG is currently holding price in check. Should price return to it and it continues to hold, a valid sell opportunity could present itself.
Be careful, as it is counter-trend. They can be lower-probability.
Enjoy!
May profits be upon you.
Leave any questions or comments in the comment section.
I appreciate any feedback from my viewers!
Like and/or subscribe if you want more accurate analysis.
Thank you so much!
Disclaimer:
I do not provide personal investment advice and I am not a qualified licensed investment advisor.
All information found here, including any ideas, opinions, views, predictions, forecasts, commentaries, suggestions, expressed or implied herein, are for informational, entertainment or educational purposes only and should not be construed as personal investment advice. While the information provided is believed to be accurate, it may include errors or inaccuracies.
I will not and cannot be held liable for any actions you take as a result of anything you read here.
Conduct your own due diligence, or consult a licensed financial advisor or broker before making any and all investment decisions. Any investments, trades, speculations, or decisions made on the basis of any information found on this channel, expressed or implied herein, are committed at your own risk, financial or otherwise.

Gold Prices Retreat from Record High- FOMC on TapGold prices are retreating from record highs with a decline of more than 11.3% now testing a major pivot zone at the 38.2% retracement of the August advance at 3973- looking for a reaction off this mark with a break / close below needed to suggest a more significant high is in place / a larger correction is underway. Subsequent support objectives rest with the 50% retracement / October open at 3846/59 with broader bullish invalidation steady at 3700/20.
Initial resistance remains with the 10/21 reversal close at 4125 with a breach / close above 4251 needed to mark resumption of the broader uptrend. Keep in mind this is a massive week for event risk with the FOMC, BoC, ECB, and the BoJ interest rate decisions on tap as the government shutdown extends into the fourth week. Stay nimble into the releases and watch the weekly close here for guidance.
-MB
