Daily Bitcoin Trade | Thu(Dec-04-2025) | ShortThu(Dec-04-2025) | Short
LEV: 50x
EN: 92990
SL: 93926
TP: 90489
This is my setup for today. This setup may fail. be careful, because this trade is risky!
This is not an offer to buy or sell.
Support and Resistance

QBTS eyes on $28.61: Golden Genesis to mark BOTTOM or DEAD CATQBTS trying to recover from the quantum correction.
How testing a proven Golden Genesis fib at $28.61
It will determine if "Bottom In" or "Dead Cat bounce"

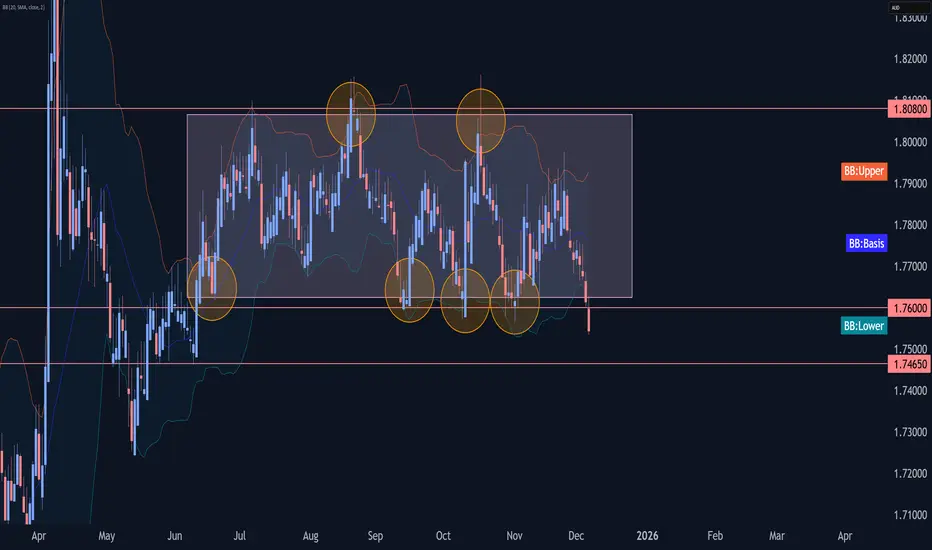
EURAUD Wave Analysis – 5 December 2025
- EURAUD broke the support level 1.7600
- Likely to fall to support level 1.7465
EURAUD currency pair recently broke the support level 1.7600 (which is the lower boundary of the sideways price range inside which the pair has been trading from June).
The breakout of the support level 1.7600 accelerated the active short-term correction ii from the end of November.
Given the strongly bullish Australian dollar sentiment seen today, EURAUD currency pair can be expected to fall to the next support level 1.7465 (former monthly low from June).
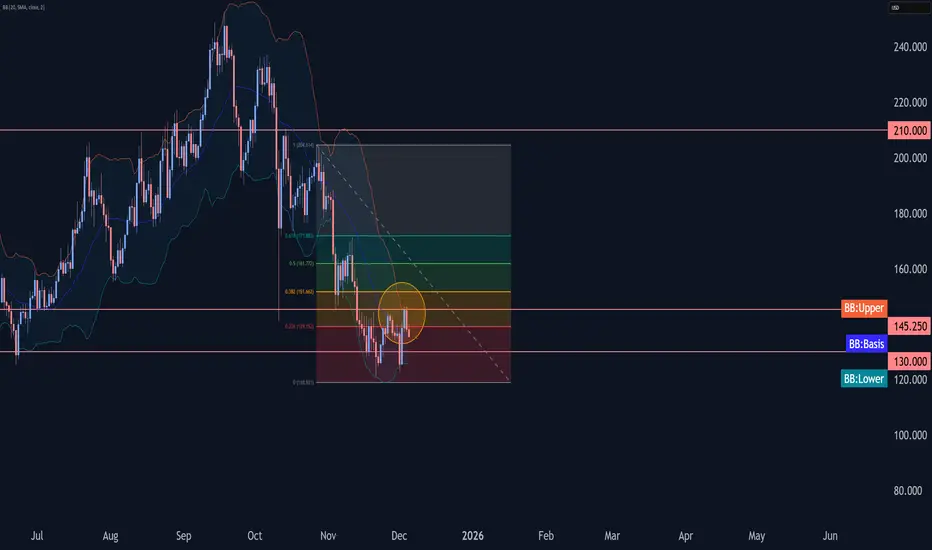
Solana Wave Analysis – 5 December 2025
- Solana reversed from resistance zone
- Likely to fall to support level 130.00
Solana cryptocurrency pair recently reversed down from the resistance zone between the resistance level 145.25 (former strong support from October and November) and the upper daily Bollinger Band.
This resistance zone was strengthened by the 50% Fibonacci correction of the downward impulse from November.
Solana cryptocurrency can be expected to fall to the next support level 130.00 (which has been steadily reversing the price from June).
GOLD – PREMIUM OUTLOOK | Tight Range Ahead of Crucial PCE DataGOLD – Technical Overview
Gold is trading in a narrow range around $4,200, maintaining sideways momentum ahead of key U.S. inflation data. The market continues to respect a bullish structure, supported by strong expectations of Federal Reserve easing.
The probability of a December Fed rate cut remains near 90% according to market pricing.
- U.S. employment data has been mixed:
- Jobless claims fell to their lowest level since September 2022
- Layoffs in November hit a two-year high
Today’s main focus is the PCE inflation index (delayed due to the government shutdown). Gold is likely to remain range-bound until the release, which may determine short-term direction ahead of the upcoming Fed meeting.
Technical Analysis
Gold maintains bullish momentum while above 4225, with price expected to move toward the 4255 resistance zone. A breakout above 4255 could extend the bullish structure toward 4300.
However, a correction becomes possible if price falls below 4225, with a retest of 4207 likely before determining the next move.
Key Levels
Pivot Line: 4225
Resistance: 4255 · 4300
Support: 4207 · 4187

Calm Before the Storm: Bitcoin’s Next Big MoveOverall Structure
Bitcoin is trading inside a large ascending channel, and price is currently sitting near the lower boundary of this channel — a highly critical decision zone for the next major move.
Bullish Scenario (Green Path)
If Bitcoin holds the lower channel support around 88,000–92,000 and buyers step in:
• A rebound toward the midline of the channel around 110,000–115,000 becomes likely.
• A further continuation could target the top of the channel, located in the 130,000–140,000 region.
This scenario remains valid as long as BTC stays above channel support.
Bearish Scenario (Red Path)
If the price breaks below the channel support, especially with a daily close under 88,000:
• Momentum may turn strongly negative.
• First support zone sits near 80,000–82,000
• A deeper extension could bring BTC toward 70,000 or lower, depending on market sentiment.
A breakdown from the channel would officially end this medium-term uptrend.
Suggested Stop-Loss
• Aggressive: below 88,000
• Conservative: below 85,000

Nifty Analysis EOD – December 5, 2025 – Friday🟢 Nifty Analysis EOD – December 5, 2025 – Friday 🔴
Monetary Policy Boost: Bulls Secure Strong Close Above 26100 Targeted…!
🗞 Nifty Summary
The session began flat to positive, marking the day’s low early at 25,985. In anticipation of news, Nifty stayed range-bound within a tight 40-point range for the first hour. The announcement of the monetary policy rate cut acted as a strong catalyst, immediately triggering high volatility.
The index sharply broke the IBH and PDH, but the next candle was met with a 100-point rejection, trapping early breakout traders. After taking temporary support at the CPR Zone, Nifty resumed its upward conviction, systematically breaching 26132 and testing the Gap Zone.
Following a small consolidation near the Gap Zone (25-30 points), the final surge broke resistance again, taking Nifty to the 26200 level. The day closed at 26,186.45, adding +152.70 points (+0.59%).
This closing is significantly above the 26100 target expected yesterday, confirming powerful bullish control heading into the weekend.
🛡 5 Min Intraday Chart with Levels
🛡 Intraday Walk
The initial fakeout after the news announcement was crucial, shaking out weak hands before the real directional move began.
Once the market absorbed the volatility, the moves were aggressive and targeted. Nifty utilized CPR and 26132 as springboards, confirming that buyers viewed every dip as a buying opportunity in the post-policy environment.
The final close near the day’s high is a definitive technical signal that the strength has returned, and the index is ready to challenge higher structural levels next week.
📉 Daily Time Frame Chart with Intraday Levels
🕯 Daily Candle Breakdown
Open: 25,999.80
High: 26,202.60
Low: 25,985.35
Close: 26,186.45
Change: +152.70 (+0.59%)
🏗️ Structure Breakdown
Type: Strong Bullish candle (Near Marubozu)
Range (High–Low): ≈ 217 points — high volatility and wide trading range.
Body: ≈ 187 points — reflecting dominant upside momentum.
Upper Wick: ≈ 16 points — very limited rejection near highs.
Lower Wick: ≈ 14 points — buyers strongly defended the early weakness.
📚 Interpretation
This candle is a powerful confirmation of bullish conviction, showing decisive absorption of the early selling and continuous buying pressure throughout the session. The wide body and the close near the high signal that buyers are firmly in control. This structure strongly supports trend continuation and suggests that the recent indecision has been resolved in favor of the bulls.
🕯 Candle Type
Strong Bullish Marubozu-Style Candle — Represents decisive buying control and potential momentum continuation.
🛡 5 Min Intraday Chart
⚔️ Gladiator Strategy Update
ATR: 192.7
IB Range: 76.75 → Medium
Market Structure: Balanced
Trade Highlights:
10:16 Long Trade - SL Hit (IBH + PDH Breakout)
10:49 Long Trade - Target Hit (R:R 1:3.34) (IBH + PDH Breakout)
Trade Summary: The volatile, news-driven session initially led to a Stop Loss on the first breakout attempt. However, the strategy quickly adapted, capturing a high R:R profitable long trade on the confirmed directional breakout, successfully aligning with the strong bullish momentum post-monetary policy announcement.
🧱 Support & Resistance Levels
Resistance Zones:
26202 (PDH)
26220 ~ 26235
26277 (ATH)
Support Zones:
26155
26104 (Must Hold)
26070 ~ 26030
🧠 Final Thoughts
“The monetary policy provided the spark needed to re-engage the bull run.”
The successful close above 26132 is a game-changer. The immediate bias for Monday is strongly bullish. We must now watch the critical overhead resistance at 26220 ~ 26235.
A decisive breach here will immediately target the All-Time High at 26277. The 26104 level is the new line in the sand; as long as Nifty holds this support, the bullish momentum remains intact.
✏️ Disclaimer
This is just my personal viewpoint. Always consult your financial advisor before taking any action.

US30 – PREMIUM OUTLOOK | Momentum Shifts at Key Resistance ZoneUS30 – Technical Overview
US30 continues to show bearish momentum as long as price remains below 47920 and 48020, with downside targets at 47720 and 47560.
Price action in this zone remains sensitive, and sellers maintain control while the index trades under these resistance levels.
However, if the market closes a 1H candle above 48020, this would signal a shift in momentum and open the way for a bullish move toward 48410.
Key Levels
Pivot Line: 47920
Support: 47730 · 47560 · 47460
Resistance: 48020 · 48320 · 48410
previous idea:

Bitcoin Analysis — Buyer Weakness Appearing !
Fear & Greed Index: 25 — still in Fear.
📰 Market Overview
As expected, Bitcoin broke below the $92,000 level, which I mentioned was highly probable.
Right now, the uptrend is weak, but I don’t believe it’s completely invalidated yet — a confirmed break below $90,500 would seal the deal and flip the structure fully bearish.
On the 4H timeframe, we clearly see strong buyer weakness — both in volume and candle size. That’s exactly why we just printed a large red 4H candle.
🎯 So What Should We Do Now?
🔻 My Current Position
I personally opened a short on STX, and although I haven’t reached a 2R yet,
once I do, I will definitely take profits or even close the entire trade.
Why? Because if sellers don’t step in with strength, BTC can easily continue upward.
📉 Short Trigger
$90,550 is the clean, confirmed trigger for a short entry.
But remember:
Bitcoin is in a downward daily structure — lower highs & lower lows are obvious.
So any early signs of buyer weakness give us opportunities for short positions.
If the next 4H candle fails to reclaim $92,000, the probability of further downside increases significantly.
And even if we don’t drop hard, price may stay range-bound in this zone.
📈 Risky Long Scenario
If the next candle forms a green engulfing and buyers suddenly return,
you can consider a risky long entry above $92,500 — but only if volume supports it.
🧩 About Bitcoin Dominance
BTC Dominance is currently ranging, which makes it hard to predict whether Bitcoin or altcoins will drop harder.
That’s why I picked a coin (STX) that shows clear bearish correlation with Bitcoin.
Since this might be the first leg of a drop, sellers haven’t proven themselves yet —
so if you’re already in a trade, take profits quickly.
✅ Final Notes
Thanks for reading my analysis!
Trade safe, don’t forget risk management, and stay sharp.
Good luck! 🚀📉

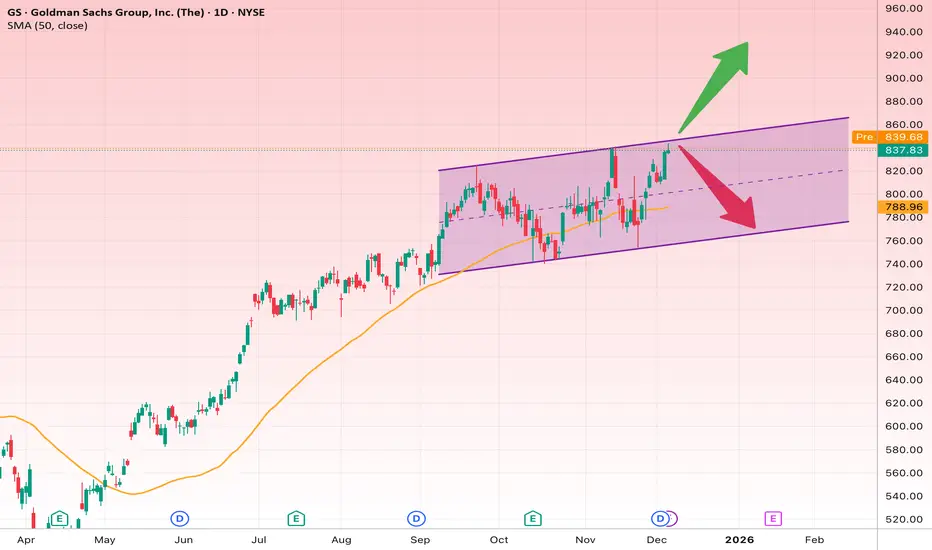
GS at the Edge: Breakout or Pullback?GS is currently moving inside a well-defined ascending channel and has once again reached the upper half of the channel, a key decision zone that will determine the next major move.
• Overall trend: Bullish
• Structure: Ascending channel + dynamic support from the 50-day SMA
• Current status: Testing the upper boundary — potential breakout or pullback zone
Bullish Scenario (more likely if it holds above resistance)
If GS can break and hold above 840, it signals a clean breakout from the channel top and opens the door for a fresh upward rally.
Bullish Targets
• Target 1: 865
• Target 2: 895
• Target 3 (strong breakout): 920
Confirmation
• Daily close above 840
• Rising volume on the breakout
Bearish Scenario (rejection from channel resistance)
If GS fails to break above the channel and gets rejected, a pullback toward the mid-range or bottom of the channel is natural.
Bearish / Correction Targets
• Target 1: 815
• Target 2: 800
• Target 3 (channel bottom): 785
Stop-Loss Levels
Depending on trading style:
• Safer stop-loss for long positions: Below 815
• Aggressive stop-loss: Below 828
(A breakdown below these levels indicates short-term structure failure.)
Quick Fundamental Note
• Recent earnings have shown strong growth, especially in investment banking and asset management.
• Operating expenses are controlled and profit margins improving.
• Market conditions and increased capital markets activity favor GS.
These fundamentals support the bullish technical bias.
EURUSD: Short.!Hello everyone,
Lets take a grasp on EURUSD, the pair have been scaling up gradually after the downtrend drop. in respect of this structure we can notice how the price is moving in an upward rise of higher highs and lows.
Presently the price is at the resistance, heading down slowly towards the low.
Possible outline;
Sell with a target at 1.1509,
Thanks for reading.

SPX500 – PREMIUM OUTLOOK | Resistance Reaction Signals Key SetupSPX500 – Technical Overview
SPX500 has already reached the 6874 resistance zone highlighted in previous analysis.
As long as the price trades below 6874 and 6888, bearish momentum is expected, with downside targets at 6860 and 6845.
A bullish retracement will require a 1H close above 6888, which would confirm renewed upside momentum toward 6918.
Key Levels
Pivot Line: 6874
Support: 6860 · 6845 · 6815
Resistance: 6888 · 6918

ForexNickx | GBPUSD:The NFP Trap vs The Real Institutional MoveGBP/USD is currently respecting a key institutional footprint. After sweeping liquidity at the 1.3280 lows, price has shifted market structure, confirming that smart money is stepping in ahead of the NFP release.
⚠️ Important Note:
This setup is based on my proprietary algo-strategy, which tracks institutional order flow before the retail crowd reacts. I have already shared the exact entry price and invalidation level with my private members.
Why this setup matters:
We are seeing a clear rejection of the institutional demand zone around 1.3300. The consolidation we are witnessing now is likely re-accumulation by major banks before the next impulsive move upward to target the imbalance above.
Technical Confluence:
🐂 Structure: Break of Structure (BOS) to the upside is confirmed on the H1 timeframe.
🌊 Liquidity: Sell-side liquidity below the range has been swept; weak hands are out, buyers are in control.
🧱 Demand: Price is holding firmly above the 1.3300 psychological support level, turning previous resistance into support.
📈 Trade Plan: As long as price holds above the trendline support, the bias remains heavily bullish. We are looking for a breakout above the immediate consolidation range targeting the 1.3450 liquidity pool.
Targets:
🎯 Target 1: 1.3380 (Intraday Highs)
🎯 Target 2: 1.3450 (Institutional Objective)
Traders, are you riding with the institutions? Let me know in the comments! 👇

USNAS100 | Watching 25740 After Resistance ReactionUSNAS100 – Technical Overview
USNAS100 has already reached the 25730 resistance highlighted in the previous analysis.
For today, the index is expected to trade with bearish momentum while below 25740, with price likely to test 25570.
A 1H close below 25570 is required to confirm continuation of the bearish trend toward 25430.
However, if the market closes a 1H candle above 25740, bullish momentum will return, opening the way toward 25980 and higher resistance levels.
Key Levels
Pivot Line: 25740
Resistance: 25880 · 25985 · 26170
Support: 25570 · 25470 · 25330
previous idea:

DeGRAM | USDJPY will continue to decline📊 Technical Analysis
● USD/JPY continues to respect the descending resistance line, with repeated rejections confirming bearish structure. A rising wedge has broken down, and price is now forming lower highs toward the 154.33 support.
● The corrective pullback toward 155.44 is likely to fade, opening room for continuation into the lower support zone.
💡 Fundamental Analysis
● Yen gains support as BoJ officials hint at further policy normalization, while softer U.S. yields weaken USD demand.
✨ Summary
● Bearish below 155.44; targets: 154.33 → 153.68.
-------------------
Share your opinion in the comments and support the idea with a like. Thanks for your support!

Gold Eyes 4,207 Rebound as USD Softens & Venezuela Tensions RiseHey Traders, in today’s trading session we are monitoring XAUUSD for a potential buying opportunity around the 4,207 zone. Gold continues to trade within a broader uptrend, and the current pullback is bringing price into a key support–resistance confluence aligned with the ascending trend structure.
Fundamentals:
The US Dollar remains under pressure, with markets increasingly leaning toward a dovish shift from the Federal Reserve, reinforcing gold’s classic negative correlation with the USD. A softer Dollar environment typically boosts demand for metals, and this week’s macro flow continues to point in that direction.
At the same time, geopolitical tensions between the U.S. and Venezuela are escalating, increasing global uncertainty and driving markets toward safe-haven assets. Gold is already reflecting this risk premium, and any further escalation could accelerate flows into XAU.
Next Step:
We’re watching price reaction closely around 4,207 for a potential continuation of the broader bullish structure.
Trade safe,
Joe.

Silver Might Be Accumulating Strength for the Next Leg UpAfter the massive 24% run from the late-November dip, silver is now consolidating between 56.40 and 59. The bullish rally's 41-degree-sloped trend has now broken and is currently being retested. This is not necessarily a bearish signal given the very steep slope and the 24% surge, but if silver manages to break out of the retest and clear the 59 resistance together, there is a chance for another leg higher.
The breakout above 50 was massive because that level has acted as resistance since the 1980s, and every time silver approached it in the past, it triggered months-long selloffs. Given that this is a historically key moment combined with favorable fundamentals, silver still has potential for more upside. However, a retreat below 56.40 could alter the short- to medium-term trajectory.

Gold Bulls Hold Control — Targeting $4,320 ResistanceHello traders! Here’s my technical outlook on XAU/USD (Gold) based on the current market structure shown on the chart. After a strong bullish impulse earlier in the period, Gold formed a distribution Range below the main Resistance Level, where multiple upside attempts were rejected and the price eventually turned around from the upper range boundary. This rejection initiated a corrective decline that respected the descending Resistance Line, while buyers gradually began to defend the Support Line, leading to a compression structure that later transitioned into a reversal phase. Following this consolidation, Gold successfully broke above both the internal range and the descending resistance, confirming a shift in market structure. Price then entered a well-defined ascending channel, forming higher highs and higher lows along the rising Support Line. Several clean breakouts inside the channel confirm sustained bullish momentum, with buyers clearly in control as long as the channel structure remains intact. Currently, price is consolidating just above the $4,160–$4,140 support zone, holding above former breakout levels and respecting the lower boundary of the ascending channel. This behavior suggests a healthy bullish pullback rather than trend exhaustion. As long as Gold remains above this support area and holds inside the channel, the bullish scenario remains valid. My expectation is for a continuation move toward the upper boundary of the channel, with the main upside target at TP1 around $4,320, where the previous resistance and projected channel resistance converge. A clean breakout above this level would open the door for further bullish expansion. However, a sustained break below the $4,140 support or a drop out of the channel would weaken the bullish structure and could trigger a deeper corrective move. Please share this idea with your friends and click Boost 🚀

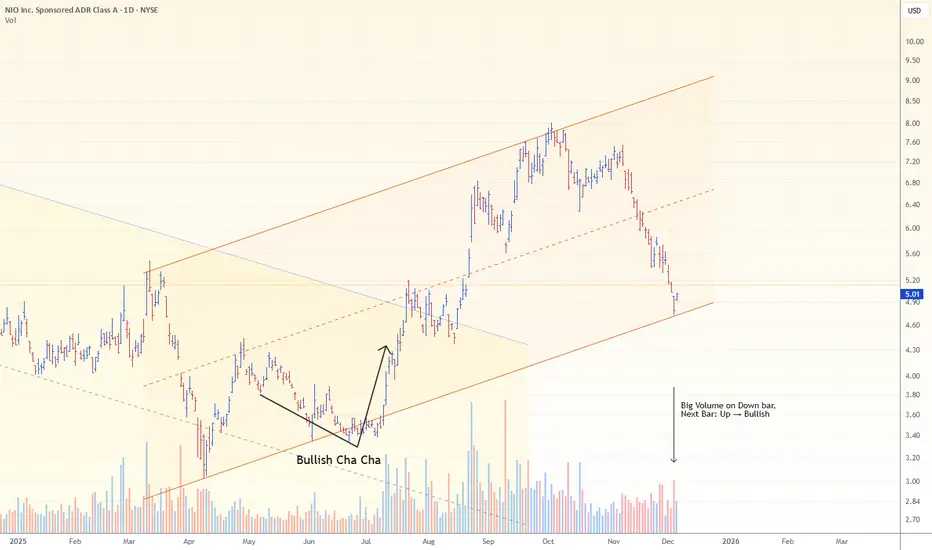
NIO: Price can find supportNIO broke below $5, extending a ~30% slide over the past month.
Pressure came after earnings showed a slight revenue miss and cautious delivery guidance — enough for bears to push the stock to new lows.
But the chart isn’t all doom:
→ price is testing the lower boundary of the 2025 ascending channel
→ yesterday opened with a bullish gap, signaling buyers may be stepping in around the key $5 level
If bulls manage to defend this zone, the trend could stabilize — with further direction depending on momentum for ONVO & Firefly heading into 2026.
Nifty levels - Dec 08, 2025Nifty support and resistance levels are valuable tools for making informed trading decisions, specifically when combined with the analysis of 5-minute timeframe candlesticks and VWAP. By closely monitoring these levels and observing the price movements within this timeframe, traders can enhance the accuracy of their entry and exit points. It is important to bear in mind that support and resistance levels are not fixed, and they can change over time as market conditions evolve.
The dashed lines on the chart indicate the reaction levels, serving as additional points of significance to consider. Furthermore, take note of the response at the levels of the High, Low, and Close values from the day prior.
We hope you find this information beneficial in your trading endeavors.
* If you found the idea appealing, kindly tap the Boost icon located below the chart. We encourage you to share your thoughts and comments regarding it.
Wishing you success in your trading activities!

BankNifty levels - Dec 08, 2025Utilizing the support and resistance levels of BankNifty, along with the 5-minute timeframe candlesticks and VWAP, can enhance the precision of trade entries and exits on or near these levels. It is crucial to recognize that these levels are not static, and they undergo alterations as market dynamics evolve.
The dashed lines on the chart indicate the reaction levels, serving as additional points of significance. Furthermore, take note of the response at the levels of the High, Low, and Close values from the day prior.
We trust that this information proves valuable to you.
* If you found the idea appealing, kindly tap the Boost icon located below the chart. We encourage you to share your thoughts and comments regarding it.
Wishing you successful trading endeavors!

GBPUSD 1HA structured approach to market analysis combining Fibonacci retracement levels with key Support & Resistance zones.
Price action is monitored to identify reaction points, liquidity zones, and potential reversal or continuation setups.
The analysis focuses on high-probability confluence areas where Fibonacci ratios align with historical structure levels, helping traders spot optimal entry points, stop-loss zones, and profit-taking targets.

Gold Uptrend: Retest 4,211 to Surge to 4,236 → 4,254After the Asian session, gold continues to maintain a short-term upward structure as prices consistently create higher lows (HL) and remain trading above the rising trendline. The weakening USD due to expectations of a dovish Fed is also supporting the flow of funds back into precious metals.
Currently, the market is entering a "compression" zone below resistance, signaling signs of accumulation before a new expansion phase.
📊 Technical Outlook – MMF Flow (H1)
1️⃣ Key Supports
4,211 – 4,212 → important retest zone + trendline confluence + previous HL low.
4,187 – 4,188 → deeper support, strong previous buying zone.
When prices hold above 4,211 → short-term trend remains bullish.
2️⃣ Key Resistances / Liquidity Zones
4,236 → nearby supply zone, liquidity cluster.
4,254 – 4,255 → expansion target, large liquidity zone above.
Prices are reacting at the descending trendline, but the upward momentum remains in control.
🧭 Trading Scenario according to MMF
▶️ Main Scenario – BUY with the trend
Wait for price retest:
🔹 BUY zone: 4,211 – 4,213
🔹 SL: below 4,206
🔹 TP1: 4,236
🔹 TP2: 4,254
Logic: Price breaks the intraday down structure, creates higher HL, and is gradually approaching the descending trendline → high breakout potential.
▶️ Alternative Scenario – Deeper BUY
If the market "flushes" to take liquidity:
🔹 BUY at 4,187 – 4,189
TP similar to the main scenario.
🎯 Daily Bias Summary
Bias: Bullish when prices hold above 4,211.
Priority: BUY at retest → SELL only for short-term scalping.
Target: 4,236 → 4,254 is a liquidity zone that the market can easily be pulled up to sweep.
