OP/USDT – Order Block Accumulation + RSI OversoldOP is currently bound within a consolidation range, showing signs of a potential order block formation—a zone where larger players may be accumulating. These structures often precede impulsive, expansive moves once the range is broken. We're seeing tight price action between $0.400 and $0.410, which could act as a springboard.
🔍 The RSI is deep into oversold territory, signaling that the selling momentum may be fading. This aligns with the idea of a reversal or breakout from the current accumulation zone. Watch for volume spikes or candle structure shifts as potential early signals.
📊 Trade Idea:
Entry Zone: $0.400 – $0.410
Take Profit Targets: $0.462 → $0.499 → $0.570
Stop Loss: Below $0.39
Support and Resistance

TradeCityPro BNBUSDT Heading Toward a New ATH?👋 Welcome to TradeCityPro Channel!
Let’s dive into the BNB (Binance Coin) analysis — one of the strongest and most bullish charts in the market. Currently, after correcting from its All-Time High (ATH), the price is consolidating within a sideways range, showing that buyers and sellers are in a tug-of-war.
🌐 Overview of Bitcoin
Before we begin, note that we’ve moved the Bitcoin analysis to a dedicated daily report for deeper insights into its market behavior, dominance, and trend structure:
👉 TradeCityPro Bitcoin Daily Analysis
📊 Technical Overview (4H Timeframe)
After facing a heavy rejection from its ATH, BNB once again attempted to retest that level. However, a fake breakout (false move above resistance) led to another sharp correction, pushing the price back down into the range.
Interestingly, this correction bounced exactly from the $1054 support zone, the same level that previously acted as a strong reversal point. This repeated reaction confirms how critical this support is — not only because it aligns with the 50% Fibonacci retracement level, but also due to its importance in the Dow Theory structure as a mid-wave equilibrium.
📈 Long Setup (Bullish Scenario)
If price breaks above $1129, it could trigger an early long position setup — signaling that buyers are regaining control before another major leg up. This move would likely be the early breakout signal ahead of a potential new ATH attempt.
📉 Short Setup (Bearish Scenario)
For short positions, the $1054 level remains the key trigger. A clean breakdown below this zone would indicate the loss of a major support and could open the way for a deeper retracement.
However, keep in mind — this is a high-impact support zone, so avoid placing tight stop-losses or over-leveraged entries. Price volatility is expected to increase around this level.
🎯 Conclusion
BNB remains one of the strongest altcoins structurally, and as long as it holds above the $1050 region, the bullish structure remains valid. The next few sessions will be crucial — watch the $1129 breakout for confirmation of renewed bullish momentum, or the $1054 breakdown for signs of weakness.
📝 Final Thoughts
Stay calm, trade wisely, and let's capture the market's best opportunities!
This analysis reflects our opinions and is not financial advice.

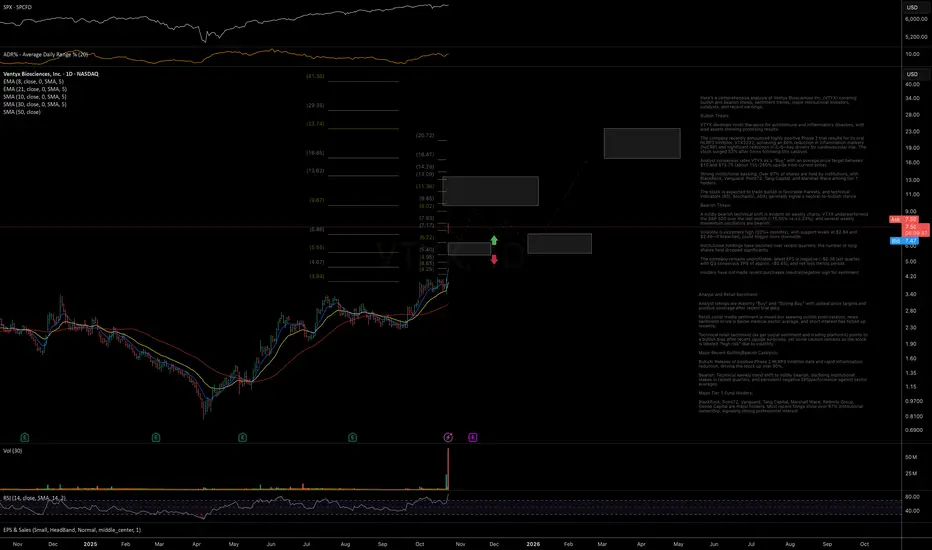
VTYX - Strong Gap-Up on Catalyst, Watching for Delayed SetupThe stock is showing a strong gap-up move on what appears to be a solid catalyst. However, given the current trading environment, which remains unfavorable for sustained breakouts, I’ll be watching for a potential delayed-reaction setup to develop over the coming days or weeks.
6.20 - 5.40 is a local support for potential pullback.
Chart:
short XAUUSDXAUUSD Analysis 🔍
Gold is forming a short-term trendline on the 5-minute chart.
If price breaks below this line with momentum, we could see a strong move down toward the next support level.
Bears might take control soon. 🐻

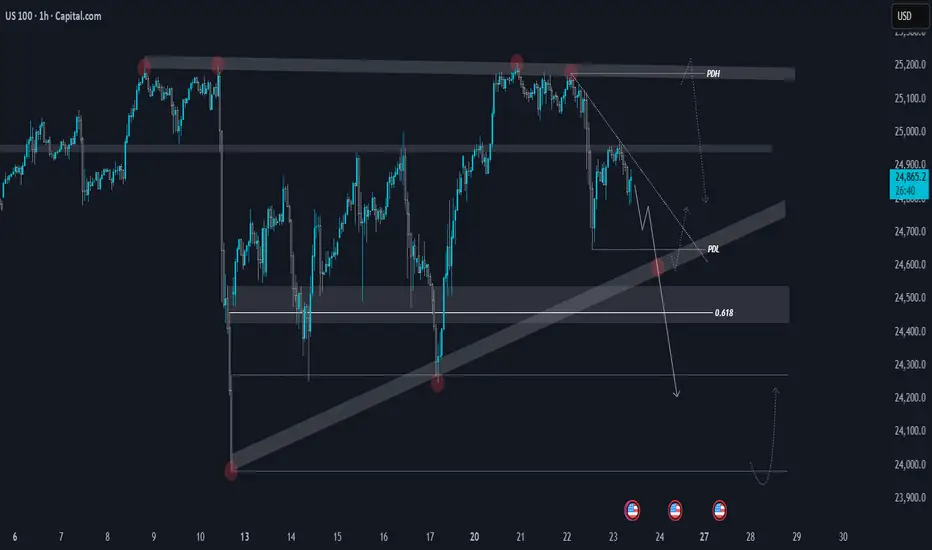
NASDAQ | Daily TF - Bearish Divergence with Double TopCAPITALCOM:US100 NASDAQ continues to hold a bearish tone on the 1-hour chart, with a clear bearish divergence confirming weakness in momentum. Price is respecting lower highs and lower lows, keeping the short-term structure bearish.
On the 4H timeframe, the index is approaching the trendline support around 24,600, which marks the third touch of this level. If this zone fails to hold, we could see an extended move toward the 24,000 area.
From a broader view, the daily chart shows a double top pattern along with a strong bearish divergence — both supporting a deeper pullback. However, a daily close above 25,220 would invalidate this view and could shift momentum back to the upside.
📰 With the ongoing U.S. government shutdown and heightened market uncertainty, sentiment remains mixed. Volatility is expected to stay elevated, so it’s best to wait for clear confirmation around key levels before taking any positions.
Looking to short this market.EUR/USD 1D - As you can see price is playing out how we expect, we want to see price continue to trade us in this upward motion.
Once we see price trade us into the Supply Zone above we can begin looking to take the market short, its a case of being delivered with entry confirmaiton.
This is a key point where we just have to be patient and sit on our hands and wait for price to play out. Once we are ready to take action I will let you all know.
For the time being, we could be looking to long this market before we short but again its a case of being delivered with the confirmation needed.

IFB INDUSTRIESIFB Industries Ltd. (currently trading near ₹1893) is a leading Indian manufacturer of home appliances and precision engineering components. Headquartered in Kolkata, the company operates through two divisions:
Home Appliances: washing machines, microwave ovens, dishwashers, air conditioners, and kitchen solutions
Engineering: automotive components, CNC tools, and fine blanking systems
IFB has manufacturing facilities in West Bengal, Goa, and Bangalore, with a strong retail and service network across India.
IFB – FY22–FY25 Snapshot
• Sales – ₹3,020 Cr → ₹3,280 Cr → ₹3,550 Cr → ₹3,850 Cr Growth driven by premium appliances, exports, and engineering orders
• Net Profit – ₹110 Cr → ₹140 Cr → ₹180 Cr → ₹220 Cr Earnings supported by margin expansion and product mix
• Operating Performance – Moderate → Strong → Strong → Strong EBITDA margins improving with scale and backward integration
• Dividend Yield (%) – 0.40% → 0.45% → 0.50% → 0.55% Modest payouts; reinvestment-focused strategy
• Equity Capital – ₹40.44 Cr (constant) No dilution; lean capital structure
• Total Debt – ₹220 Cr → ₹200 Cr → ₹180 Cr → ₹160 Cr Gradual deleveraging supported by internal accruals
• Fixed Assets – ₹1,180 Cr → ₹1,240 Cr → ₹1,300 Cr → ₹1,360 Cr Capex focused on AC line, smart appliances, and CNC expansion
Institutional Interest & Ownership Trends
Promoter holding stands at 75.00%, with no pledging. FIIs and DIIs have selectively accumulated citing appliance scale and engineering exports. Delivery volumes reflect long-term positioning by consumer, auto, and manufacturing-focused funds.
Business Growth Verdict
IFB is scaling across premium appliances, smart kitchens, and precision engineering Margins improving due to backward integration and branded pricing Debt is declining steadily with strong operating cash flows Capex supports long-term competitiveness and export readiness
Management Highlights
• FY25 washing machine volumes up 14% YoY; AC and dishwasher segments gaining traction • Engineering division secured new OEM contracts in Europe and Japan • R&D spend at ₹95 Cr; 6 new SKUs launched in smart appliance category • FY26 outlook: 10–12% revenue growth, margin retention, and PAT expected to cross ₹250 Cr
Final Investment Verdict
IFB Industries Ltd. offers a dual-engine growth story built on branded appliances and high-precision engineering. Its improving profitability, disciplined capital structure, and expanding product portfolio make it suitable for accumulation by investors seeking exposure to India’s consumer durables and manufacturing exports. With strong execution, brand strength, and engineering-led margin expansion, IFB remains a durable value creator in the mid-cap industrial space.

Longs incoming on USD/CHFUSD/CHF 1H - This market has also played out very well, following the path we had drawn out yesterday, it has followed perfectly.
Now that we are seeing price break highs and protect lows I am expecting a deeper correction here trading us down to set a higher low. Once we have that we can begin looking for longs.
Like with everything we need to be patient and wait for price to play into our hands, delivering us with the right confirmation before we place any trades.
Once price has traded us down and into the Demand Zone that is when I will be looking to take part in this market in those long trades, until then we need to be patient.

US OILD SUPPORT, RESISTANCE & TRENDLINE ANALYSISGo "LONG" if it breaks 61.96 with 62.21 as the target and if it breaks that then plan for 62.59 and if it breaks further then go for 62.90
Go "SHORT" if it breaks 61.59 with 61.23 with the first target and if it breaks that along with the trendline support then plan till 60.86 and if it breaks that as well then further till 60.50 and breaking that also will lead to 59.93

ATOMUSDT.P: short setup from daily support at 3.110BINANCE:ATOMUSDT.P confirmed a local level today — a clear hit occurred a few hours ago, followed by a gradual approach. This behavior indicates weakening buyer pressure. As always, the key factors are low volatility and an entry point that aligns with the trading system.
Key factors for this scenario:
Global & local trend alignment
Correlation with the market
Volatility contraction on approach
Immediate retest
Was this analysis helpful? Leave your thoughts in the comments and follow to see more.

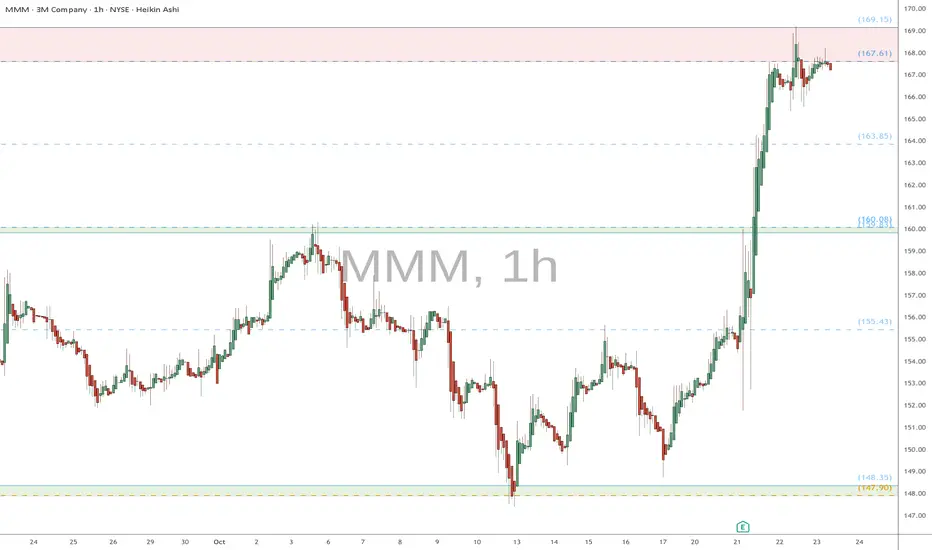
MMM eyes on $167-169: Major Resistance may give a Dip-to-Fib BuyMMM got a nice surge from its Earnings Report.
Just hit major resistance zone $167.61-169.15
Look for Dip-to-Fib like $163.85 or 160.xx zone
.
See "Related Publications" for previous plots such as this BOTTOM entry:
Hit BOOST and FOLLOW for more such PRECISE and TIMELY charts.
=========================================================
.
23/10/68 : XAUUSD ( US Session )Using it from US Session until 11.00AM , I'll new analysis and update at 12.00PM
Resistance
4130-4135
4120-4125
4114
Support
4103
4093-4098
4082-4088

$GOLD LONG
### 🧠 **Market Context & Liquidity**
- Gold took out some sellside liquidty
- We’re watching for whether buyers hold above the daily open or if we see a pullback into support.
- Key levels to watch:
- **Resistance:** 4,128 – 4,130 (recent high)
- **Support:** 4,107 – 4,112 (consolidation low & potential buy zone)
---
### 🐊 **Bill Williams Alligator Signal**
- The **Alligator** is awake and aligned — jaws above teeth above lips — indicating a **trending market**.
- Price is trading **above the Alligator**, supporting a **bullish bias**.
- Pullbacks into the Alligator (lips/teeth) are potential entries if structure holds.
---
### 🎯 **Gold (GC1!) Trade Plan – Long Setup**
- **Entry Zone:** 4,110 – 4,128 (support + Alligator confluence)
- **Stop Loss:** Below 4,057
- **TP1:** 4,128
- **TP2:** 4,200 4hr fvg (sibi)
---
### ✅ **Confirmation Needed:**
- Bullish reaction off support with volume.
- No loss of 4,107 level.
- Alligator continues pointing upward.
---
**Bottom Line:**
Gold is in a bullish structure above the Alligator.
Look for longs into support with a tight stop.
Trade the pullback — not the breakout.

GBP/JPY 4H SetupPrice has broken above the consolidation zone and is currently holding above the ascending trendline, showing strong bullish momentum.
📈 Plan:
Looking for a continuation of the bullish move as long as price maintains structure above 203.40–203.50 support. Any retest of this zone could offer a solid entry opportunity.
🎯 Targets:
First target: 206.54 (mid-range resistance)
Final target: 208.17 (major resistance zone)
🧠 Bias: Bullish — expecting continuation after breakout and successful retest confirmation.
📊 Confirmation: Lower-timeframe rejection or bullish engulfing pattern on retest.

GOLD REBOUNDS AS INVESTORS BUY THE DIP AFTER ETF SELL-OFFGOLD | Prices Rebound Despite ETF Outflows 💰
Gold prices recovered after an earlier dip triggered by the largest single-day ETF outflow in five months, signaling profit-taking and a technical correction.
Despite investor caution, the metal maintains bullish momentum while trading above 4101, supported by safe-haven demand amid uncertainty ahead of U.S.–China trade talks.
Technically, as long as gold trades above 4101, upside targets remain 4124 → 4163 → 4189.
A clean 1H close below 4075 would shift momentum bearish, opening room toward 4053 and 4011.
Pivot Line: 4101
Resistance: 4124 – 4163 – 4190
Support: 4075 – 4053 – 4011

USNAS100 | Bearish Momentum After Tesla Earnings MissUSNAS100 | Bearish Momentum After Tesla Earnings Miss ⚠️
The index dropped sharply by 1.5% (~500 points), exactly as projected.
Currently, the bias remains bearish while trading below 24860, with the next downside targets at 24760 → 24510.
Key Levels:
Pivot: 24,860
Resistance: 24,960 · 25,035 · 25,200
Support: 24,760 · 24,510 · 24,350
Trading Plan:
Sell Setup: Shorts remain valid below 24,860, targeting 24,760 / 24,510 / 24,350.
Buy Setup: Longs active only above 24,860, with confirmation toward 25,035 / 25,200.
Premium Takeaway
USNAS100 maintains a bearish bias below 24,860, with room to extend toward 24,510–24,350.
Only a confirmed 1H close above 25,035 would shift momentum bullish, signaling recovery toward 25,200.
previous idea:

Momentum Cooling Off, Eyes on $3,700 Support ZoneETHUSD – Daily Chart | Momentum Cooling, Consolidation at Key Support
Market Context:
Ethereum’s daily chart continues to show a controlled consolidation after the strong rally earlier this quarter.
Price action remains confined between the $3,700–$3,850 support zone and $4,350–$4,450 resistance.
While sentiment across crypto remains moderately positive, short-term indicators suggest fading momentum and compression rather than a confirmed breakout.
________________________________________
Trend Structure:
The broader trend remains constructive, but recent daily candles have formed lower highs — suggesting a mild corrective bias.
As long as ETH holds above $3,700, the long-term structure stays intact; a break below would open the door for a deeper pullback toward $3,400–$3,600.
A decisive close above $4,450 would confirm renewed momentum and likely invite trend-following participation.
________________________________________
Moving Averages:
The 20-day EMA is flattening and currently near price — acting as short-term resistance.
The 50-day EMA sits slightly above, showing the market is still in a pause within its bullish structure.
The 100- and 200-day EMAs remain well below current levels, confirming the long-term trend remains intact.
________________________________________
Momentum Indicators:
RSI (14): hovering around 45–48, reflecting neutral-to-slightly-bearish momentum. A reclaim above 55 would indicate buyers returning.
MACD: histogram narrowing, signal lines converging — momentum cooling but not yet reversing.
Stochastic RSI: mid-range, curling upward — early sign of potential energy buildup.
ADX (14): around 20–25, suggesting weak trend strength; look for ADX rising above 25 for confirmation of direction.
ATR: contracting steadily — volatility compression often precedes expansion.
________________________________________
Key Levels:
Resistance: 4,350–4,450 — multi-touch supply zone.
Next Resistance: 4,600–5,000 — major breakout region if momentum builds.
Support: 3,700–3,850 — critical daily support, repeatedly defended.
Secondary Support: 3,400–3,600 — previous accumulation area.
________________________________________
Indicator Summary:
RSI & Stoch RSI → Neutral; momentum reset after an overbought phase.
MACD → Flattening; no strong divergence, just cooling momentum.
ADX → Low; confirming a sideways, non-trending environment.
EMAs → Flat; short-term equilibrium within a long-term bullish trend.
Volume → Gradually declining on dips, suggesting no panic selling.
________________________________________
Outlook:
Ethereum’s daily chart reflects a classic consolidation within an ongoing uptrend.
Until price closes firmly beyond either $4,450 or $3,700, traders should expect range-bound action and momentum-reset conditions.
The next significant move is likely to align with an RSI breakout above 55 , MACD expansion , and a rising ADX above 25 — all signaling renewed directional strength.
________________________________________
Summary:
ETH remains structurally bullish on higher timeframes, but short-term momentum has cooled.
Volatility compression, neutral oscillators, and flattening EMAs define a market gathering energy for its next impulsive phase.
As long as $3,700 holds, the broader outlook stays constructive — this is the “calm before expansion”.

SENSEX Intraday Levels for 24th Oct 2025✍🏽️ Yesterday night GIFTNITY Closed Near +1.4+%
In Social Network & Analyst fraternity sitting & Shouting in Business Channel NEW High with Gapup of 300+ points, BUT NEVER REACHED 300+ Points during whole day of Trading. Also Notice One thing All the Gains in First 3-4 hours of trade absorbed in Last hour & Closd Near Day LOW & Near Monday Close.
But as per my Level No 5 min Candle Closed Above my mentioned "UBTgt @ 26098.55 ( Though at 12.45 pm European Market opening Session a Knee-Jurk reaction made a high @ 26104, but with that Candle Closed Near 26078.✍🏽️
🚀 "WEEKLY Levels" mentioned in BOX format.
🌡️Plot Levels Using 3 Min, 5 Min Time frame in your Chart for Better Analysis
L#1: If the candle crossed & stays above the “Buy Gen”, it is treated / considered as Bullish bias.
L#2: Possibility / Probability of REVERSAL near RLB#1 & UBTgt
L#3: If the candle stays above “Sell Gen” but below “Buy Gen”, it is treated / considered as Sidewise. Aggressive Traders can take Long position near “Sell Gen” either retesting or crossed from Below & vice-versa i.e. can take Short position near “Buy Gen” either retesting or crossed downward from Above.
L#4: If the candle crossed & stays below the “Sell Gen”, it is treated / considered a Bearish bias.
L#5: Possibility / Probability of REVERSAL near RLS#1 & USTgt
HZB (Buy side) & HZS (Sell side) => Hurdle Zone,
*** Specialty of “HZB#1, HZB#2 HZS#1 & HZS#2” is Sidewise (behaviour in Nature)
Rest Plotted and Mentioned on Chart
Color code Used:
Green =. Positive bias.
Red =. Negative bias.
RED in Between Green means Trend Finder / Momentum Change
/ CYCLE Change and Vice Versa.
Notice One thing: HOW LEVELS are Working.
Use any Momentum Indicator / Oscillator or as you "USED to" to Take entry.
⚠️ DISCLAIMER:
The information, views, and ideas shared here are purely for educational and informational purposes only. They are not intended as investment advice or a recommendation to buy, sell, or hold any financial instruments. I am not a SEBI-registered financial adviser.
Trading and investing in the stock market involves risk, and you should do your own research and analysis. You are solely responsible for any decisions made based on this research.
"As HARD EARNED MONEY IS YOUR's, So DECISION SHOULD HAVE TO BE YOUR's".
Do comment if Helpful .
In depth Analysis will be added later (If time Permits)

SPX500 Slips as Netflix Earnings Cool Wall Street OptimismWall Street Futures Struggle as Netflix Results Weigh on Sentiment
U.S. stock index futures fluctuated on Wednesday as investors moved cautiously through a heavy earnings season, with Netflix’s weaker-than-expected profits cooling risk appetite and adding pressure to market sentiment.
🕯 Technical Outlook
SPX500 has collected volume below the 6,754 pivot line, suggesting potential bearish correction ahead.
As long as the price trades below 6,754, the bias remains bearish, targeting 6,738 → 6,717 → 6,699.
Conversely, a 1H close above 6,771 would confirm a bullish continuation, paving the way toward 6,792 → 6,838.
Pivot: 6,754
Support: 6,738 – 6,717 – 6,699
Resistance: 6,771 – 6,792 – 6,838

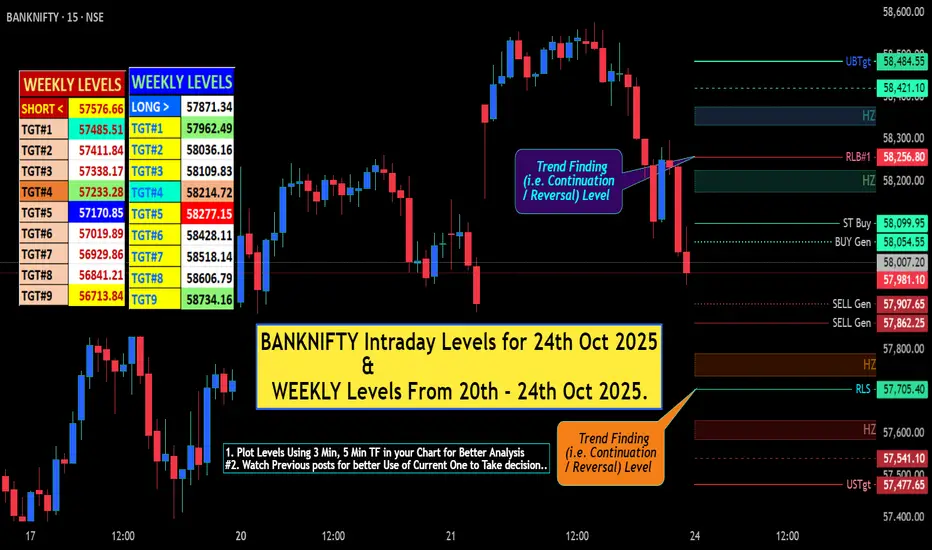
BANKNIFTY Intraday Levels for 24th Oct 2025✍🏽️ Yesterday night GIFTNITY Closed Near +1.4+%
In Social Network & Analyst fraternity sitting & Shouting in Business Channel NEW High with Gapup of 300+ points, BUT NEVER REACHED 300+ Points during whole day of Trading. Also Notice One thing All the Gains in First 3-4 hours of trade absorbed in Last hour & Closd Near Day LOW & Near Monday Close.
But as per my Level No 5 min Candle Closed Above my mentioned "UBTgt @ 26098.55 ( Though at 12.45 pm European Market opening Session a Knee-Jurk reaction made a high @ 26104, but with that Candle Closed Near 26078.✍🏽️
🚀 "WEEKLY Levels" mentioned in BOX format.
🌡️Plot Levels Using 3 Min, 5 Min Time frame in your Chart for Better Analysis
L#1: If the candle crossed & stays above the “Buy Gen”, it is treated / considered as Bullish bias.
L#2: Possibility / Probability of REVERSAL near RLB#1 & UBTgt
L#3: If the candle stays above “Sell Gen” but below “Buy Gen”, it is treated / considered as Sidewise. Aggressive Traders can take Long position near “Sell Gen” either retesting or crossed from Below & vice-versa i.e. can take Short position near “Buy Gen” either retesting or crossed downward from Above.
L#4: If the candle crossed & stays below the “Sell Gen”, it is treated / considered a Bearish bias.
L#5: Possibility / Probability of REVERSAL near RLS#1 & USTgt
HZB (Buy side) & HZS (Sell side) => Hurdle Zone,
*** Specialty of “HZB#1, HZB#2 HZS#1 & HZS#2” is Sidewise (behaviour in Nature)
Rest Plotted and Mentioned on Chart
Color code Used:
Green =. Positive bias.
Red =. Negative bias.
RED in Between Green means Trend Finder / Momentum Change
/ CYCLE Change and Vice Versa.
Notice One thing: HOW LEVELS are Working.
Use any Momentum Indicator / Oscillator or as you "USED to" to Take entry.
⚠️ DISCLAIMER:
The information, views, and ideas shared here are purely for educational and informational purposes only. They are not intended as investment advice or a recommendation to buy, sell, or hold any financial instruments. I am not a SEBI-registered financial adviser.
Trading and investing in the stock market involves risk, and you should do your own research and analysis. You are solely responsible for any decisions made based on this research.
"As HARD EARNED MONEY IS YOUR's, So DECISION SHOULD HAVE TO BE YOUR's".
Do comment if Helpful .
In depth Analysis will be added later (If time Permits)
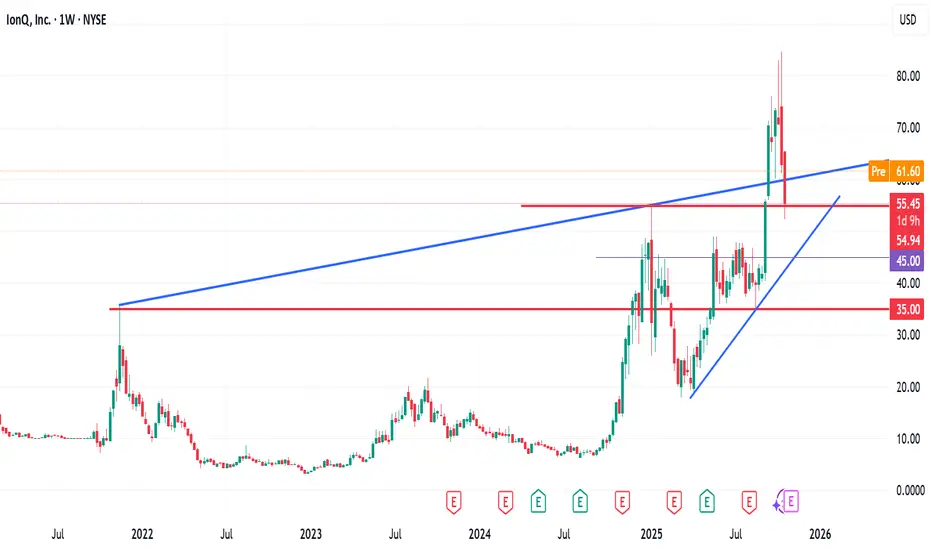
Is the Sell-Off Over for IonQ? was it a bubble?Is the Sell-Off Over for IonQ? was it a bubble?
Two weeks ago, IonQ signaled a sell setup following the formation of a weekly BEARISH PINBAR, as clearly shown on the chart. Despite this indication, many investors and traders were influenced by the strong rally from the previous week, overlooking the reversal signal.
Subsequently, a BEARISH ENGULFING candle appeared immediately after the pin bar — a strong confirmation of selling pressure and a reflection of changing investor sentiment. This move extended into the following week, breaking a key weekly trendline, further validating the bearish momentum.
The question remains: Is the sell-off over?
My Analysis:
It appears the stock may have experienced a short-term bubble.
Based on my technical analysis (TA), if IonQ breaks below the $55 zone, the next potential downside target could be around the $45 level.
Furthermore, if the price breaches the lower trendline, we might see a decline toward the $35 zone.
As always — trade with caution and ensure your risk management plan is in place.
I’d love to hear your thoughts — feel free to like, share, and drop your comments below.
Let’s connect and discuss further.
MarketBreakdown | GBPUSD, USDJPY, GBPCAD, GBPCHF
Here are the updates & outlook for multiple instruments in my watch list.
1️⃣ #GBPUSD daily time frame 🇬🇧🇺🇸
The pair is trading in a short-term downtrend since
the middle of September.
It looks like the market successfully completed a correctional movement
after a formation of a new local Lower Low and ready to drop lower.
With a high probability, we will see a test of 1.325 level soon
with a potential continuation lower to 1.321.
2️⃣ #USDJPY daily time frame 🇯🇵🇺🇸
The price is currently breaking a significant daily resistance.
I think that the price is going to rise more and reach monthly highs.
A consequent bullish breakout of 153.3 level and a daily
candle close above that will push the pair way higher.
3️⃣ #GBPCAD daily time frame 🇬🇧🇨🇦
The pair is testing a major bullish OB order block zone.
Trading in a strong uptrend, chances will be high to see a bullish
movement from the underlined area and a trend continuation.
4️⃣ #GBPCHF daily time frame 🇬🇧🇨🇭
The price is currently stuck on a major daily support cluster.
Its breakout will be a historical event and confirm a continuation
of a bearish trend to lower levels.
Do you agree with my market breakdown?
❤️Please, support my work with like, thank you!❤️
I am part of Trade Nation's Influencer program and receive a monthly fee for using their TradingView charts in my analysis.

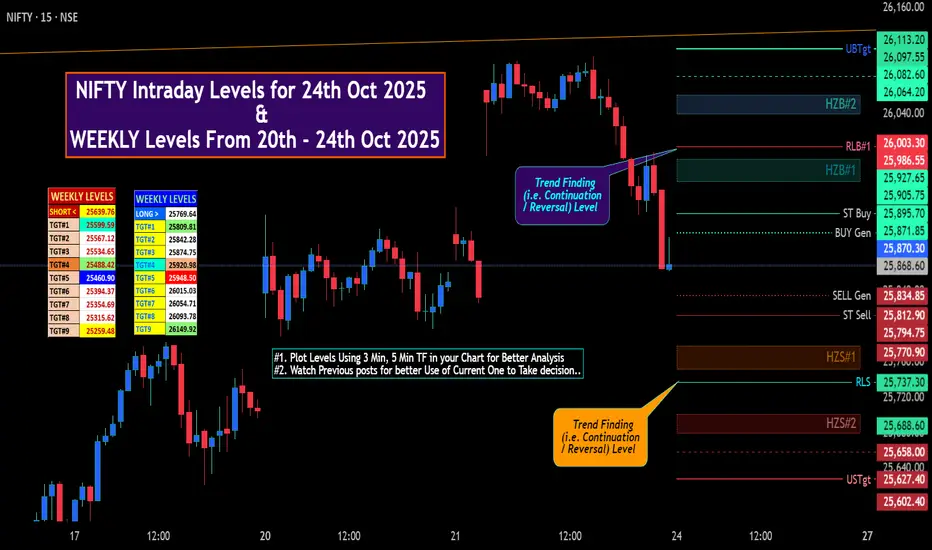
NIFTY Intraday Levels for 24th Oct 2025✍🏽️ Yesterday night GIFTNITY Closed Near +1.4+%
In Social Network & Analyst fraternity sitting & Shouting in Business Channel NEW High with Gapup of 300+ points, BUT NEVER REACHED 300+ Points during whole day of Trading. Also Notice One thing All the Gains in First 3-4 hours of trade absorbed in Last hour & Closd Near Day LOW & Near Monday Close.
But as per my Level No 5 min Candle Closed Above my mentioned "UBTgt @ 26098.55 ( Though at 12.45 pm European Market opening Session a Knee-Jurk reaction made a high @ 26104, but with that Candle Closed Near 26078.✍🏽️
🚀 "WEEKLY Levels" mentioned in BOX format.
🌡️Plot Levels Using 3 Min, 5 Min Time frame in your Chart for Better Analysis
L#1: If the candle crossed & stays above the “Buy Gen”, it is treated / considered as Bullish bias.
L#2: Possibility / Probability of REVERSAL near RLB#1 & UBTgt
L#3: If the candle stays above “Sell Gen” but below “Buy Gen”, it is treated / considered as Sidewise. Aggressive Traders can take Long position near “Sell Gen” either retesting or crossed from Below & vice-versa i.e. can take Short position near “Buy Gen” either retesting or crossed downward from Above.
L#4: If the candle crossed & stays below the “Sell Gen”, it is treated / considered a Bearish bias.
L#5: Possibility / Probability of REVERSAL near RLS#1 & USTgt
HZB (Buy side) & HZS (Sell side) => Hurdle Zone,
*** Specialty of “HZB#1, HZB#2 HZS#1 & HZS#2” is Sidewise (behaviour in Nature)
Rest Plotted and Mentioned on Chart
Color code Used:
Green =. Positive bias.
Red =. Negative bias.
RED in Between Green means Trend Finder / Momentum Change
/ CYCLE Change and Vice Versa.
Notice One thing: HOW LEVELS are Working.
Use any Momentum Indicator / Oscillator or as you "USED to" to Take entry.
⚠️ DISCLAIMER:
The information, views, and ideas shared here are purely for educational and informational purposes only. They are not intended as investment advice or a recommendation to buy, sell, or hold any financial instruments. I am not a SEBI-registered financial adviser.
Trading and investing in the stock market involves risk, and you should do your own research and analysis. You are solely responsible for any decisions made based on this research.
"As HARD EARNED MONEY IS YOUR's, So DECISION SHOULD HAVE TO BE YOUR's".
Do comment if Helpful .
In depth Analysis will be added later (If time Permits)