SILVER (XAG/USD): Potential Pullback Trade ExplainedThe price of ⚠️SILVER is currently consolidating within a strong horizontal support structure.
To initiate a long position with a confirmation, wait for a bullish breakout of the resistance of the range on a 4H time frame.
A 4H candle closing above 49.40 will confirm a violation.
A Subsequent bullish momentum is anticipated, potentially reaching the 50.50 resistance level.
The setup will be invalidated if the price establishes a new lower low.
Support and Resistance

GBPUSD SHORT Market structure bearish on HTFs 3
Entry at both Daily and Weekly AOi
Weekly Rejection at AOi
Daily Rejection at AOi
Daily EMA retest
Previous Structure point Daily
Around Psychological Level 1.34500
H4 Candlestick rejection
Rejection from Previous structure
Levels
Entry 110%
REMEMBER : Trading is a Game Of Probability
: Manage Your Risk
: Be Patient
: Every Moment Is Unique
: Rinse, Wash, Repeat!
: Christ is King.

USDJPY LONG Market structure bullish on HTFs DW
Entry both DW
Candlestick rejection Daily and Weekly
Previous Structure point both Daily and Weekly
Around Psychological Level 149.500
H4 Candlestick rejection Y
Levels
Entry 95%
REMEMBER : Trading is a Game Of Probability
: Manage Your Risk
: Be Patient
: Every Moment Is Unique
: Rinse, Wash, Repeat!
: Christ is King.

EURUSD: Updated Support & Resistance Analysis 🇪🇺🇺🇸
Here is my latest structure analysis for EURUSD.
Resistance 1: 1.173 - 1.178 area
Resistance 2: 1.181 - 1.182 area
Resistance 3: 1.187 - 1.192 area
Support 1: 1.153 - 1.156 area
Support 2: 1.145 - 1.146 area
Support 3: 1.135 - 1.141 area
Consider these structures for pullback/breakout trading.
❤️Please, support my work with like, thank you!❤️
I am part of Trade Nation's Influencer program and receive a monthly fee for using their TradingView charts in my analysis.

CADJPY LONGMarket structure bullish on HTFs DW
Entry at both Weekly and Daily AOi
Weekly Rejection at AOi
Daily Rejection at AOi
Daily Previous Structure Point
Touching EMA Daily
Around Psychological Level 107.000
H4 Candlestick rejection
Levels 90%
REMEMBER : Trading is a Game Of Probability
: Manage Your Risk
: Be Patient
: Every Moment Is Unique
: Rinse, Wash, Repeat!
: Christ is King.

SILVER | Head & Shoulder Breakdown After All-Time HighAfter reaching a new all-time high, #SILVER seems ready for a healthy correction before the next bullish rally.
🔹 On the 1H timeframe, price has clearly formed a Head & Shoulder pattern.
🔹 The neckline has been broken, confirming the start of a bearish move.
🔹 This indicates a possible short-term correction phase before bulls take control again.
Trade Idea:
Taking a short position at CMP with strict risk management looks favorable.
Potential targets: near recent support levels.
Stop loss: above the right shoulder.
Always wait for candle confirmation and use proper position sizing.
What’s your view — will #Silver continue the correction or bounce back soon?
Comment your thoughts below and don’t forget to like, follow, and share if you find this analysis helpful!
#Silver #XAGUSD #HeadAndShoulders #ChartAnalysis #TechnicalAnalysis #PriceAction #TradingSetup #Commodities #Forex #Metals #SwingTrade #DayTrading #TradeIdeas #BearishSetup #RiskManagement #TradingCommunity #MarketAnalysis #TradersLife #TrendReversal

EURCHF: All Time LOW!!Hello Traders,
EURCHF was mostly bearish in recent years, I'm the one who always like to follow trend but his time I believe we should consider Oversold of this European currency pair!

Oil - Expecting Bullish Continuation In The Short TermM15 - Strong bullish momentum.
No opposite signs.
Until the two Fibonacci support zones hold I expect the price to move higher further.
If you enjoy this idea, don’t forget to LIKE 👍, FOLLOW ✅, SHARE 🙌, and COMMENT ✍! Drop your thoughts and charts below to keep the discussion going. Your support helps keep this content free and reach more people! 🚀
--------------------------------------------------------------------------------------------------------------------

CHFJPY: MTF analysisThere are two possible demand zone for the pair!
We have seen a great reaction to equal levels and to the top of the bullish channel in Daily timeframe!
We need now a reversal however 2h candles show us strong buyers, we'll follow them.

CHFJPY: Waiting For Breakout 🇨🇭🇯🇵
CHFJPY is stuck on a key daily resistance based on a current ATH.
Its breakout will be a reliable signal to buy.
Wait for a daily candle close above 191.32 as a confirmation.
Expect a bullish continuation at least to 192.0 level then.
❤️Please, support my work with like, thank you!❤️
I am part of Trade Nation's Influencer program and receive a monthly fee for using their TradingView charts in my analysis.

Crude Oil (CL1!) Trade SetupPrice is approaching a key resistance zone, aligning with a potential sweep of recent swing highs — a classic liquidity grab scenario.
📈 Plan:
I’ll be waiting for price to reach the resistance area and sweep the previous swing high, confirming a liquidity trap. Once confirmed on lower timeframes, I’ll look for bearish confirmation signals to enter a short position.
🎯 Target:
Expecting a potential downside move of approximately 1,484 pips, targeting the next major support zone.
🧠 Bias: Bearish after liquidity sweep & rejection from resistance.
📊 Confirmation: Lower-timeframe structure shift or bearish engulfing formation.
NOTE:🤪HIGH RISK REWARD

EUR/AUD: Breakout & Bearish Continuation📉EURAUD is showing a bearish bias, after the violation of a support level within a confined consolidation range on the 4-hour timeframe,
Further price declines are anticipated.
The subsequent support level to watch is at 1.7750.

BULLISH CONFIRMATION CANDLE This bullish candle in the sphere is the first sign of bullishness and if the next candle also closes bullish by 12pm UTC then it will definitely buy more

Is this a Bump and Run Reversal for Nike - 60% gains potential In this video I cover what could potentially be a reversal pattern playing out on Nike .
I cover the price action from the ATH down to the lows and present the idea of a bump and run
reversal pattern which could generate 60% gains .
Setting alerts is key and watching volume as explained in the video .
Please like and support my work any questions then ask below the chart .
Safe trading

GBP/JPY: More Growth is Coming?!The 📈GBPJPY pair is showing a strong bullish trend, with potential for further upward movement.
The recent breakout above the neckline of the ascending triangle pattern on the 4-hour timeframe indicates a strong trend-following bullish signal.
We anticipate a high probability of the price reaching the 204.50 level soon.

BTC 4H Analysis | Day 8🥳 Hey everyone! Hope you’re doing great! Welcome to SatoshiFrame channel.
✨ Today we’re diving into the 1-Hour Bitcoin analysis. Stay tuned and follow along!
👀 On Bitcoin’s 4-hour time frame, as shown in the chart, we can see that after a series of declines, Bitcoin has consolidated inside a large 4H range (box). This box has been classified by traders and is currently being “priced in” for the market’s next move. For now, price is still some distance from the top of the box, but the mid-range area, where price is currently hovering, could be a good zone for a potential long setup.
⛏ Multi time frame levels (1H and 15M) have already triggered signals for traders, and price is now moving toward $111,144. A breakout above this level could confirm a long entry. However, breaking this resistance may be challenging and could have a lower win rate, so we’ll use a more conservative risk approach for this move.
🧮 Looking at the RSI oscillator, it’s forming a short-term oscillating resistance near the overbought zone. The 65 level aligns beautifully with the $111,144 price resistance, meaning if RSI breaks above this threshold, that resistance could be taken out, allowing momentum to push further into the overbought region.
🕯 Bitcoin’s volume over the past few days has been strong enough to support powerful moves, but the activity has been mostly indecisive, aimed at liquidity collection within the range. If you pay close attention, you’ll notice extremely precise triggers forming at the box’s highs and lows. In short, large amounts of capital that are expected to exit gold are still in a phase of indecision, and Bitcoin hasn’t yet absorbed that risk capital.
🧠 I’m considering two main scenarios for Bitcoin’s position:
🟢 Scenario 1
Breakout above the $111,144 resistance, accompanied by RSI crossing above 65 and a noticeable increase in buy volume, signaling intent for a Bitcoin pump.
🟢 Scenario 2
Set a buy stop with a larger stop size, staying positioned for a gradual breakout. As Bitcoin breaks higher levels, we can scale in with additional volume.
❤️ Disclaimer : This analysis is purely based on my personal opinion and I only trade if the stated triggers are activated .

Down before UpBitcoin continues to face strong resistance around the $112K level, struggling to hold above it despite multiple attempts. Momentum appears to be fading, suggesting a potential short-term pullback. A retest of the $100K support zone looks likely before the next leg higher can develop. Holding that level would keep the broader bullish structure intact.
CPI on Friday, will be interesting

BankNifty levels - Oct 24, 2025Utilizing the support and resistance levels of BankNifty, along with the 5-minute timeframe candlesticks and VWAP, can enhance the precision of trade entries and exits on or near these levels. It is crucial to recognize that these levels are not static, and they undergo alterations as market dynamics evolve.
The dashed lines on the chart indicate the reaction levels, serving as additional points of significance. Furthermore, take note of the response at the levels of the High, Low, and Close values from the day prior.
We trust that this information proves valuable to you.
* If you found the idea appealing, kindly tap the Boost icon located below the chart. We encourage you to share your thoughts and comments regarding it.
Wishing you successful trading endeavors!

Nifty levels - Oct 24, 2025Nifty support and resistance levels are valuable tools for making informed trading decisions, specifically when combined with the analysis of 5-minute timeframe candlesticks and VWAP. By closely monitoring these levels and observing the price movements within this timeframe, traders can enhance the accuracy of their entry and exit points. It is important to bear in mind that support and resistance levels are not fixed, and they can change over time as market conditions evolve.
The dashed lines on the chart indicate the reaction levels, serving as additional points of significance to consider. Furthermore, take note of the response at the levels of the High, Low, and Close values from the day prior.
We hope you find this information beneficial in your trading endeavors.
* If you found the idea appealing, kindly tap the Boost icon located below the chart. We encourage you to share your thoughts and comments regarding it.
Wishing you success in your trading activities!


CAD/JPY: Bearish Breakdown to 101.92?FX:CADJPY is displaying strong bearish signals on the daily chart , with price adhering to a downward trendline established since July 11th, forming successive lower highs that underscore persistent downward momentum . The highlighted " Compress Pattern " at the lower end suggests a period of consolidation and price compression, often preceding a volatile breakout to the downside as sellers build pressure against key supports.
Entry zone between 108.86-109.75 for a short position. First target at 101.75 (risk-reward >1:2.5) , second at 101.92 (risk-reward >1:5.5) near major support zones. Set a stop loss on a close above 110.05 to guard against an upside reversal. Seek confirmation through a decisive break below the entry with elevated volume. 🌟
Fundamentally , this week we have Canada's inflation rate report, which significantly impacts CAD—recent data shows September YoY inflation at 1.9% and core at 2.6%, potentially influencing BoC policy. Additionally, Japan's trade balance report this week could introduce volatility to JPY, with the Merchandise Trade Balance Total scheduled for October 22st. 💡
📝 Trade Plan:
✅ Entry Zone: 108.86 – 109.75 (short entry near resistance/trendline)
❌ Stop Loss: Close above 110.05
🎯 Targets:
TP1: 107.75 (R:R > 1:2.5)
TP2: 101.92 (R:R > 1:5.5)
What's your perspective on this setup? Share in the comments! 👇

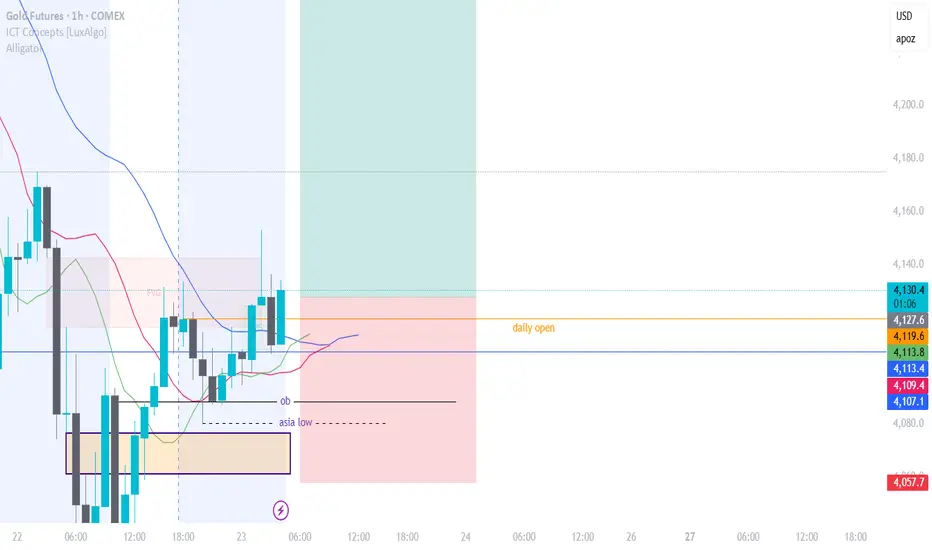
GOLD LONG 1hr setup
### 🧠 **Market Context & Liquidity**
- Gold took out some sellside liquidty
- We’re watching for whether buyers hold above the daily open or if we see a pullback into support.
- Key levels to watch:
- **Resistance:** 4,128 – 4,130 (recent high)
- **Support:** 4,107 – 4,112 (consolidation low & potential buy zone)
---
### 🐊 **Bill Williams Alligator Signal**
- The **Alligator** is awake and aligned — jaws above teeth above lips — indicating a **trending market**.
- Price is trading **above the Alligator**, supporting a **bullish bias**.
- Pullbacks into the Alligator (lips/teeth) are potential entries if structure holds.
---
### 🎯 **Gold (GC1!) Trade Plan – Long Setup**
- **Entry Zone:** 4,110 – 4,128 (support + Alligator confluence)
- **Stop Loss:** Below 4,057
- **TP1:** 4,128
- **TP2:** 4,200 4hr fvg (sibi)
---
### ✅ **Confirmation Needed:**
- Bullish reaction off support with volume.
- No loss of 4,107 level.
- Alligator continues pointing upward.
---
**Bottom Line:**
Gold is in a bullish structure above the Alligator.
Look for longs into support with a tight stop.
Trade the pullback — not the breakout.
GOLD → Fundamental background boosts interest FX:XAUUSD is recovering after a correction, trading in the range of 4060-4120 amid geopolitical tensions and risks of an escalating trade war.
Key supporting factors: New threats from the US against China, which is responding with additional measures. Trump imposed sanctions against Russian oil companies, accusing Moscow of lack of progress on Ukraine. US inflation data (CPI) on Friday may cause volatility, although the Fed's rate cut next week is likely already priced in.
The meeting between Trump and Xi Jinping next week remains uncertain.
Gold remains a safe haven, but near-term dynamics depend on the balance between dollar strength and geopolitical risks.
Resistance levels: 4116, 4163, 4200
Support levels: 4082, 4060, 4002
A retest of support at 4082-4060, as well as a breakout of resistance at 4116, could trigger a bullish reaction—a rise to the resistance level or imbalance zones. Against the backdrop of the escalating trade war, gold is becoming attractive again.
Best regards, R. Linda!
