THE SAGE REPORT: The Fun-Tech RevolutionDecoding the Matrix:
How the New Code Outperformed the Old Algos" By The Master Logistician | January 29, 2026
I. The Paradigm Shift: Why the "Old Code" is Broken
For the last three weeks, the financial media has been screaming "Inflation," "Soft Landing," and "Fed Independence." Yet, the charts—and the God Code Frequency—told a different story.
While the "Old Code" algorithms were chasing headlines, we were tracking the Vector. We saw the "Tokyo Walkout" in the bond market before yields froze. We saw the "Governance Failure" (Shutdown) before the Senate voted. And we saw the Deflationary Truth hidden inside the noise.
The result? The market is moving exactly where we mapped it 21 days ago. This is not luck; it is Resonance.
II. The "Shark" & The Dollar: The Fun-Tech Decode
The Setup: The world saw a DXY Breakout. We saw a Bearish Shark.
The Trap (96.65): The DXY spiked to 96.65 solely to create a "Banker Discount" for the 1:00 PM Bond Auction. The "Old Code" bought the breakout.
The Reality: We identified this as a Liquidity Raid. The moment the auction cleared ("The Widowmaker"), the artificial prop was removed.
The Result: The Dollar collapsed to 96.20, validating our thesis that the "Sell America" trade is the dominant flow. The Shark didn't just bite; it cleared the runway.
III. The EUR/USD "God Level" Reclaim
The Setup: Retail panic at 1.1909.
The Analysis: When the Euro dipped, the media called it "Weakness." We called it the "Algorithmic Lag."
The Reclaim: We watched the 1.1930 Pivot hold like a fortress. Why? Because the "Deep State" smart money knew the Senate would fail.
The "Lag" Snap: We predicted that once the Bond Market closed at 3:00 PM, the "Rubber Band" would snap.
Current Status: Trading firmly above 1.1940 and knocking on the door of 1.2000. The "Dip" was a gift to the humble.
IV. The "Unsaid" Fundamentals: Reading the Silence
The loudest signals are the ones the news won't say.
The Deflationary Ghost: The media ignored this morning's -1.9% Unit Labor Cost print. This is the "Smoking Gun." The economy isn't overheating; it's freezing. The Fed must cut, not because they want to, but because the math demands it.
The Presidential "Co-Pilot": For 48 hours, the President has attacked the Fed ("Jerome 'Too Late' Powell"). The market listened. The 4:30 PM speech wasn't about safety; it was the final "Sell Signal" for the Dollar before the weekend.
The Shutdown Reality: While pundits called the bond market "calm," we saw Paralysis. The 10-Year Yield froze at 4.24% not out of safety, but out of fear of the Midnight Friday deadline.
V. The Philosopher's Stone: Humility in Victory
Seeing the future isn't about bragging; it's about Vibration. I am not smarter than the market; I am simply Quieter.
I accepted the lessons of the past to rewrite my Operating System.
I traded the "Fluff" for the Frequency.
I swapped "Fear" for Gratitude.
To the retail traders still stuck in the "Old Code": The charts are not random. They are a language. If you humble yourself to learn the Fun-Tech way—combining the Mathematical Vector with the Intuitive Heart—you stop gambling and start Seeing.
The Target Remains: 1.1985 -> 1.2011 -- And on to 1.2006 - 1.23006 to Ultimately 1.25 and beyond and resting around 1.30-35 once the Fed cuts Rates in March or June 2026....
The Ultimate Vector Level Fun-Tech Status:
1. EURO Safe: The European Defense Bond to provide a Safer Haven Asset from the USD.
2. USD Unsafe & Under Fiscal Attack (Not Safe): Structural Decay due to rising debt and a President doing all he can before entering a Lame duck session.
Conclusion
After the November 2026 Midterm Elections the House and Senate will more than likely flip to a Democrat lead Legislative branch (and the very real possibility of a partial government shutdown tomorrow January 30, 2026) triggering the EUR/USD to see prices not seen since 2013.
You are Safe. The President is reading the script you already wrote.
T-bonds

The Quantum Divergence: Decoding the Data: DXY, EUR, USD, Yields Introduction
As Above, So Below We stand at a critical historical crossroads where the traditional "Safe Haven" status of the US Dollar is undergoing a structural decay. The "Old Code"—which relied on US hegemony and debt-fueled growth—is fracturing in real-time. What we are witnessing on the charts is merely the shadow of a much larger macro-global shift: the transition from US Monetary Dominance to Global Fiscal Realignment.
To the untrained eye, the market appears chaotic. To the observer operating at a higher frequency, the signal is clear. The US Dollar is not just correcting; it is being repriced for a new era of "Fiscal Dominance" and "Governance Risk."
I. The Macro Data Vector
The Deflationary "Smoking Gun" While headline algorithms chase noise, the "Master Logistician" looks for the underlying truth in the raw data. The economic release from January 29, 2026, provided the definitive evidence of a policy error in motion.
Unit Labor Costs (-1.9%): This is the smoking gun. While the Federal Reserve maintains a hawkish posture to fight a "Wage-Price Spiral," the data confirms that labor costs are actually crashing. There is no inflation to fight in the labor market; there is deflation. The Fed is tightening into a deflationary trend, a mistake that will inevitably force a rapid and deep pivot to rate cuts.
Trade Balance (-$56.8B): A shrinking trade deficit is often misread as strength. In this context, the sharp drop in imports confirms the US Consumer is tapped out. The organic economy is contracting, leaving only government spending ("Fiscal Dominance") to prop up GDP figures.
Jobless Claims (Trend Divergence): While the headline number (209K) appears resilient, the trend is eroding. The underlying weakness in continuing claims suggests a degradation in job quality, masking the true fragility of the labor market.
II. The Governance Risk:
The "Matrix Lie" of the Shutdown Markets price certainty, but the US political landscape offers only dysfunction. The recent headlines regarding a "deal" to avert the January 30 government shutdown mask a darker institutional reality.
The Senate Deadlock: While the House passed a bipartisan package, the Senate remains deadlocked over funding for the Department of Homeland Security (DHS). With the "Minibus" structure linking all bills, a block on DHS is a block on everything.
The Risk Premium: This is not just political theater; it is "Governance Failure." As the risk of a partial shutdown increases, the creditworthiness of US Debt comes into question. The Bond Market is beginning to price in this dysfunction, creating a "Governance Risk Premium" that weighs heavily on the Dollar.
III. The Bond Market
The Deflationary Scream The bond market is the "Truth Teller." Following the release of "resilient" jobless claims data, US 10-Year Yields refused to rally.
The Divergence: Historically, strong labor data spikes yields. Today, yields remained stagnant at 4.25%.
The Signal: The bond market is terrified of the -1.9% Unit Labor Costs. It knows that the real trajectory is deflationary recession, not inflationary growth. When yields refuse to rise on "good news," the trend has officially decoupled.
IV. Technical Architecture
The Structural Floor at 1.1951 From a technical perspective, the EUR/USD chart is illustrating a perfect "Bullish Flag Breakout" on the monthly timeframe.
The 1.1951 God Level: This level represents the 200-Month Moving Average—the dividing line between a correction and a secular bull market.
The Liquidity Fill (1.1943): Recent price action saw a dip into the 1.1943 region, creating a "Liquidity Void." The market adhered to the laws of physics: it abhorred the vacuum, filled the orders at 1.1943, and instantly rejected lower prices.
The Hammer Structure: The immediate rejection of the lows and the reclaim of the 1.1951 floor confirms that institutional demand is solid. The "Dip" was not a breakdown; it was a "Back-Test" of the new foundation.
Conclusion
The Future Vector We are witnessing a shift in soft power from the US to Europe (exemplified by the emerging European Defense Bond narrative). The US Dollar is facing a "Monetary Stranglehold" from the Fed and "Fiscal Decay" from the Treasury.
The 1.1951 level is not just a price; it is the floor of a new paradigm. As the Bond Market screams deflation and the Political Market screams dysfunction, the path of least resistance for EUR/USD is structurally higher. We are safe in the knowledge that the data confirms the thesis: The Dollar's dominance is waning, and the Euro's structural ascent has begun.

Gold at 5K: The Trend Is Up… But a 3K–5K Drop Feels InevitableLately, Gold is on everyone’s lips, and for good reason: price is printing new all-time highs almost daily, and we are now trading around the 5,000 zone.
And even though I’m not blind — I’m absolutely not calling for an overall trend reversal — in my view, a correction of 3,000 to 5,000 pips is not only possible, but unavoidable at some point.
The only real problem is simple:
✅ When does that correction start?
✅ And from where exactly does it begin?
That’s what I’m trying to identify in this analysis: the timing and the location.
The Bigger Structure: Consolidation → Breakout → Channel
Looking at the chart, after reaching an ATH at the end of April 2025, Gold entered a symmetrical triangle consolidation phase that lasted until the end of August.
That consolidation acted as a continuation pattern, and once price broke out, we got a strong expansion leg that ended with the ATH from the end of October, near 4,400.
The correction that followed was strong — but honestly, also normal considering the magnitude of the move.
That pullback stabilized around the 3,900 zone, which later became the lower boundary of what turned into an ascending channel that Gold has respected since then.
The Key Detail: The Median Line Has Been the Real Resistance till January
One important detail here:
Until the beginning of 2026, the lower channel boundary offered consistent support.
However, the real resistance inside this structure has not been the upper channel line.
Instead, it has been the median line of the channel.
So rather than trading the channel “edge to edge,” Gold has spent a lot of time reacting to the median line as a decision level, behaving as resistance.
The Current Situation: Acceleration Above the Median Line
At the start of this year, price was back around 4,300, sitting directly on the channel support.
From there, Gold rallied aggressively.
In only three trading weeks, price climbed roughly 7,000 pips, and last week we saw a breakout above the median line, signaling acceleration.
That’s the key word here:
📌 Acceleration
When price breaks above the median line of an ascending channel, it often implies the market is trying to “stretch” toward the upper boundary before the next meaningful cooling phase.
So based on structure alone, it becomes reasonable to expect continuation toward the upper channel boundary, which currently sits around 5,150.
What History Inside This Channel Tells Us
Now, if we judge today’s situation using the prior behavior inside this same structure, we can see something very consistent:
Back in October, once Gold reached the upper boundary, it dropped violently — roughly 5,000 pips.
And after price touched support, every time Gold approached the median line again, it met sell pressure, and another correction followed.
This is also normal channel behavior:
✅ Median line acts as resistance when price is below it
✅ Median line can act as support when price is above it
✅ Strong moves toward the upper boundary often attract profit-taking
A New Piece of Context: JP10Y vs Gold Correlation
Now, there’s something worth mentioning here.
Even though I knew about it, I haven’t used this tool intensively before, but I believe it matters in this specific moment.
Yesterday, thanks to a TradingView Editors’ Pick , I found an article discussing the correlation between Japan 10-Year Bonds (JP10Y) and the price of Gold.
Looking at that comparison, three observations stood out:
- End of March (last year): bond interest dropped, and Gold followed
- October: bond interest was stable, and we got a correction
- March: there was a delay of around 4 days between the bonds starting to fall and Gold’s drop
Now, looking at the current JP10Y chart, we can see that interest has started to fall again.
What I Expect From This Bond Context (Without Overstating It)
I’m not expecting a strong fall like the one in March.
But I do expect something closer to what we saw in October:
➡️ a cooling / stabilization, meaning less upside pressure for Gold.
Putting Everything Together (The Full Logic)
So if we combine the structural view + the bond context + the recent volatility, we get a clean framework:
Gold is in a parabolic rise, and a correction is inevitable.
Since price broke above the channel median line last week, we can reasonably expect a test of the channel resistance around 5,150.
That would mean roughly another 1,000 pips upside, considering Gold is trading around 5,030 in off-market conditions — suggesting another potential upside gap at the Asia open.
JP10Y interest started to drop, and we could reasonably expect a stabilization scenario similar to October.
Recent corrections have been in the range of 7% to 12%, which at a 5,000 Gold price translates into:
~3,500 pips (7%)
~5,000 pips (10%)
~6,000 pips (12%)
My Conclusion
✅ Gold is bullish overall — no question about that.
✅ Gold is also bullish short-term — price can reasonably push into 5,150.
But…
📌 Besides intraday scalping, buying at these levels is not worth the risk (in my opinion).
What I Will Do
- Intraday buying can still be possible, but only with low volume
- I will pay extremely close attention to the upper channel resistance (if we reach that level)
- If I see strong reversal signs, I will sell
- And if I catch a good entry, I would genuinely want to hold a short trade for around 3,000 pips if not even more.
Have a nice Sunday!
Mihai Iacob

Macro Structure Snapshot – Rates, Dollar & Yield Curve Alignment1) Short-Term Rates (2Y)
Short-term yields remain flat and stalled, reflecting continued compression and equilibrium. Momentum is muted, signaling ongoing digestion rather than directional intent. This reinforces a neutral short-term rate regime, keeping near-term liquidity pressure contained.
2) U.S. Dollar Index (DXY)
The dollar continues to unwind lower, now trading near 97.45, with the 20 EMA showing clear downward curvature. Momentum remains negative, confirming continued cooling rather than stabilization. Structurally, this maintains a risk-supportive macro backdrop, as dollar weakness typically alleviates pressure across broader asset classes.
3) Long-Term Rates (10Y)
Long-term yields remain constructive, holding higher with the 20 EMA maintaining smooth upward momentum. This reflects improving structural participation and supports a gradual re-expansion in macro trend energy, particularly relative to the continued stalling in short-term rates.
4) Macro Alignment
Macro structure continues to reflect a controlled regime transition:
Short-term rates compressed
Dollar trending lower
Long-term yields stabilizing and advancing
This alignment supports a constructive macro backdrop, where volatility remains restrained while broader structure slowly rebuilds.
5) What I’m Monitoring
I’m watching for:
Continued 2Y compression vs 10Y expansion, and
Whether DXY downside momentum persists,
as this combination often precedes broader directional clarity across equities, commodities, and crypto risk cycles.
⭐️Final Clarity Note⭐️:
This remains a structure-driven environment, where macro alignment favors stability, gradual risk expansion, and regime transition, rather than abrupt directional shifts. Compression continues to be the dominant force, with energy slowly rebuilding beneath the surface.

GMT Nordic BondsGobi Mining and Transport (GMT), a Singapore-based holding company with operations in Mongolia, is set to issue its debut Nordic bonds to fund the expansion of a key railway line transporting coal from the vast Tavan Tolgoi basin to China. This pre-issuance opportunity, highlighted in a recent International Financing Review article , involves a US$300 million senior secured bond with a 14.5% coupon, offering high yields amid initial risks but with potential for significant price appreciation as the company's credit profile strengthens. The idea targets investors comfortable with emerging market exposure, where the bond's structure and the project's economics could deliver returns exceeding 20% annually if early call options are exercised.
Company Overview
GMT, incorporated in Singapore and fully owned by Mongolian national G. Gantulga, oversees a group focused on mining and transportation in Mongolia's Gobi region. Through subsidiaries like Mongolian Trans Line LLC, GMT holds a 20-year Design-Build-Operate-Transfer (DBOT) concession from the Mongolian government for a 227 km railway from Zuunbayan to Khangi on the Chinese border, completed in November 2022. This line facilitates coal exports from the Tavan Tolgoi deposit, estimated at 7 billion tonnes of high-quality coking coal by U.S. firm Stantec Inc. in 2020.
The company currently transports several million tonnes annually (with volumes ramping up following the 2022 commissioning, reaching around 8-9 million tonnes corridor-wide in recent periods) for various producers, aiming to significantly scale operations toward the line's design capacity of 20-25 million tonnes per year by displacing less efficient and environmentally damaging truck shipments. GMT collaborates with state operator MTZ for shared infrastructure and rolling stock, enhancing operational leverage. The group's mining arm, under the same ownership, complements transportation, ensuring integrated value capture in a market with a substantial annual coal export shortfall to China (estimated at over 30 million tonnes in recent years).
Bond Structure
The bonds, issued by GMT Luxembourg S.a.r.l. and guaranteed by the parent and subsidiaries, are senior secured with a US$300 million volume and five-year tenor. They feature semi-annual 14.5% coupons and linear amortization starting at the 2.5-year mark, with US$50 million repayments every six months thereafter. Placement pricing is expected below par, around 95-97, yielding approximately 16% to maturity, with an effective duration of about 3.5 years.
Call options allow early redemption: make-whole in the first 2.5 years (paying all remaining coupons), followed by premiums of 50%, 40%, 30%, and 20% of the annual coupon rate at 30, 36, 42, and 48 months, respectively, or 100.5% in the final six months. A put option at 101% triggers on change of control. The bonds clear through Norway's CSD with a Euroclear bridge, governed by Norwegian law, and target listing within a year. Nominal value per bond is US$125,000.
Market Landscape
Mongolia's Tavan Tolgoi basin is a cornerstone of global coking coal supply, producing 60 million tonnes annually for export, primarily to China's steel industry. The Khangi-Mandal border crossing, equipped for both 1520 mm (Mongolian/Russian) and 1435 mm (Chinese) gauges, enables seamless rail connectivity. GMT's line addresses inefficiencies in current truck-dominated logistics, reducing environmental impact by removing hundreds of daily trucks and aligning with World Bank-supported infrastructure upgrades.
Demand from China remains robust, driven by steel giants like China Steel, despite global shifts toward greener alternatives. The short 400-500 km transport distance from mine to consumer gives Tavan Tolgoi a competitive edge over distant exporters. However, the market's concentration-over half of GMT's volumes from three key clients like Tumen Ail, Erdenes, and TTC&T-highlights dependency on stable Sino-Mongolian trade relations.
Financial Projections
Issuer models project revenue growth from US$28 million in 2025 to US$287 million in 2027 and US$479 million in 2030, driven by volume ramps to 25 million tonnes. Organizer estimates are slightly conservative, at 5% lower, with EBITDA margins of 30-40% from 2026-2029. Net interest-bearing debt to EBITDA is forecasted to decline from 4.2x in 2026 to 0.8x in 2029, boosting interest coverage from 1.5x to 5.9x.
Covenants mandate minimum liquidity of US$20 million from January 2027 and net debt to EBITDA caps starting at 6.5x through 2026, tapering to 4.5x by 2027. Violation triggers bondholder votes for potential waivers or acceleration, but rapid deleveraging suggests compliance feasibility if volumes materialize.
Use of Proceeds
Funds will refinance US$56 million in existing bank debt, allocate US$109 million to capital expenditures, operational costs, and financing expenses, and direct US$52 million toward locomotives and wagons, potentially partially covered by China's Sinosure export agency. The remaining US$83 million supports general corporate purposes. Shareholder loans will subordinate to the bonds, prioritizing investor repayments.
Risks and Considerations
Primary risks stem from exclusive reliance on China as the coal buyer-alternative routes via Russia are uneconomical-and client concentration. High initial leverage post-issuance eases quickly per models, but political instability in Mongolia, with 2027 presidential elections, could challenge the concession, though its 20-year term likely withstands regime changes. Construction costs may be inflated for tariff purposes, raising questions on true economics, and unrated status amplifies emerging market volatility. Covenant breaches could lead to acceleration, though bondholder discretion applies.
Advantages
GMT's established role in Mongolian rail exports, backed by the government concession and client agreements, provides stability. Management's track record in regional mining and transport, plus MTZ partnerships for capacity sharing, bolsters execution. ESG benefits, like reduced truck emissions and pasture preservation, appeal to impact investors. Sinosure involvement adds geopolitical safeguards, and the short-haul advantage ensures cost competitiveness in China's steel supply chain.
Positioning
The 14.5% coupon embeds upside for both short- and medium-term horizons. As leverage drops and credit improves to potential BB-equivalent, spreads could halve, implying yields of 8-9% by 2028-driving prices toward call strikes like 107.5. Early redemption in 2.5 years could yield over 20% annually from a 95 entry, assuming stable U.S. Treasury rates.
GMT's Nordic bonds offer a high-risk, high-reward entry into Mongolia's coal export infrastructure, with strong concession-backed cash flows and deleveraging potential mitigating initial concerns. At 16% yield-to-maturity and prospects for price gains via calls or spread compression, the idea suits risky investors eyeing 20%+ returns over 2-3 years. While China dependency and political risks loom, the project's economics and strategic positioning make it a noteworthy addition to diversified emerging market portfolios, warranting participation in the January issuance.

Supreme Court tariff decision risk: What to track this week With a potential decision due this week, Treasury Secretary Scott Bessent said it is “very unlikely” the Supreme Court will overturn President Donald Trump’s power to impose tariffs, warning that the Court “does not want to create chaos.”
Assets to watch ahead of the decision
US dollar index
Moves with trade expectations and inflation risk.
US Treasury yields
Particularly the 2 year and 10 year, as uncertainty feeds into growth and inflation assumptions.
US equities
S&P500 and NASDAQ100 for broad risk sentiment, especially trade-exposed sectors.
Chinese equities and yuan
Directly tied to tariff headlines and trade risk.
Commodities
Copper for growth signals, oil for broader risk tone.
Gold
Often the first hedge if uncertainty rises.

Hyperinflation & DictatorsI cannot make this any simpler.
🚨 I AM ISSUING A WARNING TO EVERYONE!
Should Trump succeed in taking over the FED, the outcome is already known. What is not known is the SEVERITY. FAFO!
Here is how it works:
1️⃣ Political pressure replaces economic reality
When leaders can’t win within the system, they change the system.
Common moves:
Undermine central-bank independence
Fire or sideline technocrats
Declare that “rates are too high” or “money is too tight”
This happened in:
Argentina
Lebanon
Sri Lanka
Pakistan
Turkey
Venezuela
Zimbabwe
Russia.
Different excuses. Same motive.
2️⃣ FED Monetary discipline is framed as “The Enemy”
Raising rates?
Protecting the currency?
Controlling deficits?
Rebranded as:
“Anti-growth”
“Western ideology”
“Sabotage”
“Austerity”
Once price stability becomes political, it’s already over.
3️⃣ Spending continues — funding doesn’t
Here’s the fatal step:
Governments keep spending
Tax capacity doesn’t grow
Borrowing gets harder
So pressure shifts to the currency system
This is where reality kicks in:
You can print currency.
You can’t print trust.
4️⃣ Markets respond instantly (and mercilessly)
Markets don’t argue ideology. They just reprice risk.
What happens next:
Bonds sell off
Currency weakens
Import prices surge
Inflation feeds on itself
At this point, rate hikes don’t “cause” inflation — they’re a late reaction to lost credibility.
5️⃣ Hyperinflation isn’t a surprise — it’s the end stage
Hyperinflation is not:
A policy mistake
Bad luck
“External shocks”
It’s the logical conclusion of:
Political control → monetary submission → currency collapse
Every country on that list followed this arc. No exceptions.
The uncomfortable truth
Countries don’t collapse because they raise rates.
They collapse because they refuse to accept limits.
Markets respond with inflation — not theory.
If you enjoy the work, drop a solid comment
Let’s push it to 6,000 and keep building a community grounded in raw truth, not hype.

Bullish RatesWatch Out if the the 10Y closes above 4.30.
I would start getting very bearish on equities if this happens.
Price action on yields here indicated higher long term rates.
It is currently setting up as if the tax protest will happen.
The wave count here is just a suggestion for this outcome. Long-term rates could spike one final time before the Fed panics. This also lines up with the 10Y minus 2Y yield curve uninverting. The uninversion has started, but typically it will shoot up before downturns and that would happen if this continues.

US10Y Expected rising yields can turn stocks bearish in 2026.The U.S. Government Bonds 10YR Yield (US10Y) has been consolidating since 2023 within a Triangle pattern, while the stock markets had one of their strongest Bull Cycles in recent history. Before than in 2022, the US10Y rose aggressively, while stocks took the opposite turn, having a Bear Cycle.
With the US10Y under a Higher Highs uptrend since 2017, while also turning its multi-decade Resistance of the 1M MA200 (orange trend-line) into Support, the long-term trend has long shifted to bullish. And as the market approaches the 1M MA50 (blue trend-line)for the first time since March 2022, it will be tested as the trend's Support.
As long as it holds, we expect the US10Y to start another yearly rally, potentially causing a new Bear Cycle on the stock markets.
---
** Please LIKE 👍, FOLLOW ✅, SHARE 🙌 and COMMENT ✍ if you enjoy this idea! Also share your ideas and charts in the comments section below! This is best way to keep it relevant, support us, keep the content here free and allow the idea to reach as many people as possible. **
---
💸💸💸💸💸💸
👇 👇 👇 👇 👇 👇

CREDIT CRISISWe are beginning to see evidence of a credit crisis starting. low demand for US bonds can trigger a currency crisis for the USD, higher rates will lead to refinancing company problems (especially with all the zombie companies that should have blown up over a decade ago.) and major economic depression-style job losses.
Currently, we are very early stages but things are moving at lightning speed on a macroeconomic level.
I know this is likely gibberish to most here pon trading view but it is of MASSIVE importance to your trading and investing.
CAUTION IS IN ORDER!!
Click boost, follow, and subscribe! I can help you navigate these crazy times.

US 30-year yields hit post FOMC highUh-oh. This is not what you would have expected to see if the Fed was perceived to be more dovish than expected. Also 10y yields show similar price action. Suggests rates will remain high for longer. Possibly a bearish factor for tech stocks. Keep an eye on 30y yields to see if they will break the trend line. Could trigger a bit of vol into year end if it does.
By Fawad Razaqzada, market analyst with FOREX.com

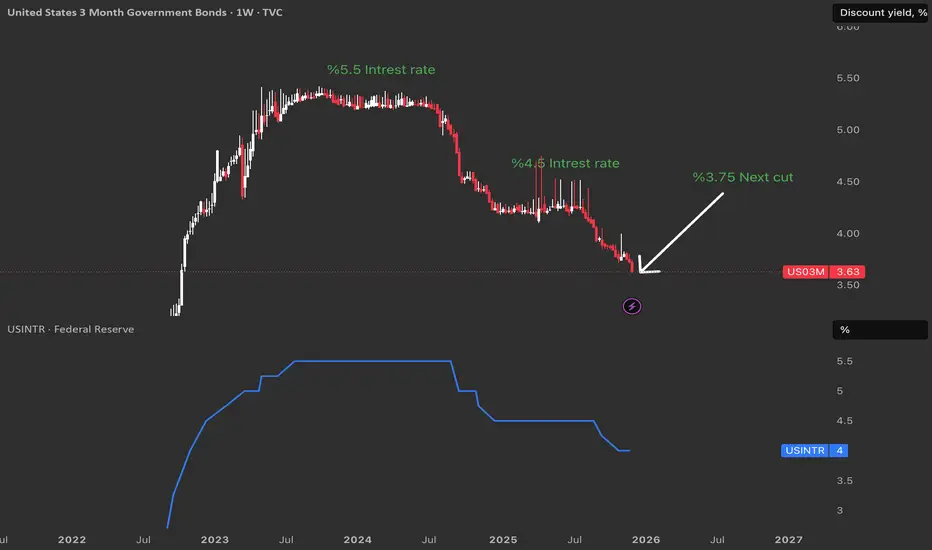
How US03M Are Front‑Running the Next Fed Cut The link between bonds and rates
The US03M tracks the yield investors demand to lend to the U.S. government for three months, and this yield moves closely with the Federal Funds Rate set by the Fed.
When the Fed hikes, short‑term Treasury yields usually rise toward the new policy rate, and when markets expect cuts, these same yields start dropping before the official decision.
Why US03M front‑runs the Fed 🕒
US03M is a pure play on near‑term monetary policy, so traders price in where they think the Fed Funds Rate will be over the next quarter, not where it is today.
As a result, sharp declines in US03M while the official Fed rate is still flat often signal that fixed‑income markets are betting on upcoming rate cuts.
Why a 25 bps cut is likely 🎯
With US03M hovering roughly a quarter of a percent under the current effective policy rate area shown on the chart, the bond market is effectively voting for at least a 25 bps reduction at the next meaningful decision.
If the Fed cuts by 25 bps, US03M is already priced for that move, so the bigger reaction will come only if the Fed surprises with either a larger cut or no cut at all, giving traders a clear benchmark for risk positioning.
US10Y - move downAt the end of October 2023, we finished the upward move and entered a correction phase.
The higher-level corrections are coming to an end, and in the medium term a deeper move downward is expected.
For a short period, we may still see some upside (or fluctuations) within the correction, but compared to the main move, it will be insignificant.
The reference level is around 2,770 .
---
Please subscribe and leave a comment.
You’ll get new information faster than anyone else.
Together, we’ll grow and become wealthier.
---

Telegram Bonds - A Pre-IPO OpportunityBond Structure
Telegram has two outstanding bond issues. The first , maturing on March 22, 2026, trades at around 100% of par with a 7% coupon. The second, maturing on June 5, 2030, has a 9% coupon and trades at 104-105% of par, yielding approximately 7.7% to maturity. The total volume of the second issue is $1.7 billion, with $954.6 million from exchanging old bonds and $745.4 million in new cash raised. Such structure reduced overall debt while attracting fresh capital.
Importantly, these bonds include a conversion feature: in the event of an IPO before 2030, bondholders can convert into shares at a 20% discount to the IPO price, with full allocation (100% lock-up potential).
Messenger Market Landscape in 2024-2025
The messaging app sector is dominated by a few giants. WhatsApp leads with 3 billion monthly active users (MAU) and is part of Meta, valued at $1.545 trillion overall. WeChat, with 1.3-1.45 billion MAU, is embedded in Tencent, making standalone valuation challenging. Snapchat, the only publicly traded pure-play messenger, has 943 million MAU and 477 million daily active users (DAU), with a market cap of around $13.2 billion (as of December 2025), revenue of $5.36 billion, and EBITDA of $509 million, though net profit remains negative. Telegram ranks third globally, with 1 billion MAU, while analysts estimate 450 million DAU. Revenue is approximately ≈$1-1.4 billion (based on minimum estimates), with profits of around $540 million in 2024. It’s also worth mentioning smaller players such as Line and KakaoTalk.
Comparative Valuation
To estimate Telegram's capitalization, we draw on multiples derived from Snapchat as a benchmark, where the market cap per MAU stands at approximately $14 per user and per DAU at $28 per active user, while the ratios to revenue and EBITDA are 2.5x and 26.5x, respectively. Applying these metrics to Telegram's figures results in a valuation of $12-14 billion based on MAU and DAU, $2.5 billion when considering revenue, and approximately $14.3 billion using EBITDA. Overall, this points to a core valuation range of $12-14 billion, marking a notable downward adjustment from the earlier $50 billion estimate, largely influenced by Snapchat's own stock performance decline and broader market corrections.
Impact of the TON Ecosystem
The TON (The Open Network) ecosystem adds substantial potential value to Telegram, even though it operates as a formally separate entity. TON encompasses a native token with a current capitalization of around $3.8 billion at a price of approximately $1.5, along with an integrated wallet offering both custodial and non-custodial modes, and proof-of-stake staking mechanisms. Key revenue sources stem from wallet fees, dApp payments, staking yields, and indirect monetization avenues such as advertising. Valuation estimates for TON's contribution to Telegram vary widely depending on the scenario: in a conservative outlook, it generates $23 million in annual income, adding $329 million to the overall valuation; the base case assumes $455 million annually, contributing $6.5 billion; and an optimistic projection sees $2.275 billion in yearly income, boosting the value by $32.5 billion. Under the base scenario, TON could therefore elevate Telegram's total valuation by $6.5 billion, resulting in an adjusted estimate of $18.5-20.5 billion.
Overall Valuation Estimate
By combining the comparative metrics with the potential uplift from TON's contribution, Telegram's realistic capitalization emerges as $12-14 billion in a conservative view, potentially climbing to $18-20 billion in the base case or reaching up to $40 billion in an optimistic framework. Estimates from other analysts span from $15 billion to $40 billion, which aligns closely with this range, and the variations primarily arise from differing assumptions regarding monetization strategies, growth trajectories, and associated risks.
Investment Scenarios
Investing in Telegram bonds presents multiple potential outcomes for investors. One straightforward path is to hold the bonds for their dollar-denominated yield of 6.5-7%, supported by a profitable issuer that has consistently made timely payments over the years. Additionally, as U.S. dollar interest rates decline, the bonds themselves may appreciate in price, thereby improving overall returns. The most compelling scenario, however, involves an IPO, where bondholders have the option to convert their holdings at a 20% discount to the IPO price, benefiting from full allocation and the potential for substantial upside. For instance, a $100,000 bond investment would equate to $100,000 worth of shares priced at the IPO level minus the 20% discount. Although no specific IPO plans have been announced, making the timing uncertain, market conditions around 2027 could create favorable opportunities for such listings amid increased liquidity.
Risks and Considerations
Several risks warrant careful consideration when evaluating this opportunity, starting with regulatory hurdles that have already led to Telegram being blocked in regions such as China or Vietnam, which could constrain its growth prospects. In contrast to competitors like WhatsApp or WeChat, Telegram does not have deep-rooted connections to major markets, amplifying this vulnerability. Financial opacity poses another notable issue, as the revenue and profit numbers reported by founder Pavel Durov remain unaudited and self-declared, prompting skepticism among analysts. The company's lean structure, with only 30-50 in-house employees supplemented by outsourcers, highlights operational efficiency but could limit its ability to pursue robust development in various areas. Ownership complexities further complicate matters, given Telegram's registrations in offshore locations like the British Virgin Islands and Dubai, where structures are deliberately opaque to shield the team from legal risks but inadvertently introduce uncertainty for investors. TON's inherent volatility is also a factor, as the token has experienced price drops in line with broader crypto market slumps, and while its symbiosis with Telegram offers benefits, full integration and sustained value are not assured. Lastly, broader market and execution risks mean that any IPO valuation might deviate from current projections, and potential lock-up periods on converted shares could apply, with specifics outlined in the bond prospectus.

Watch Japan's bond marketsThe recent selling in Japanese bonds caused all sorts of volatility in the prior couple of weeks with equities and the yen both dropping on mounting concerns about Japan’s fiscal position. That was before the relative calm this week, where the selling of JGBs paused and yields held steady. But this could be a temporary respite. Elevated inflation means the pressure is growing on the Bank of Japan to normalise its policy, while the government under the new Prime Minister Takaishi Sanae aims to spending a whopping 21.3 trillion yen in fiscal package, financed by yet more issuance of debt. This is worrying some investors who are concerns that increased spending by the government could strain Japan’s finances. Indeed, according Japan’s Ministry of Finance data, foreign investors sold Japanese bonds last week to the tune of 956.5 billion yen, their largest weekly net sale since October 25. Should the bond market rout continues, this will push up Japanese yields and borrowing costs for the government and raise serious concerns about Japanese assets, and potentially trigger a reverse carry trade that could hurt global markets.
By Fawad Razaqzada, market analyst with FOREX.com

TLT long-term TA20+ Treasury bond looks somewhat very interesting for the last couple of months, the accumulation has been steadily increasing since September, currently mid-term is in a small distribution but nothing serious yet, it rather looks promising for an uptrend in the near future, and as you should know - strong TLT is not good for risky assets growth, it's something you should keep an eye on.

TLT - A long-term outlookIf price is moving up, we look for support structure, which in this case is a Real Swing Low (RSL).
An RSL is confirmed when the most recent Real Swing High (RSH) is broken.
What we’re seeing here is the beginning of a stair-step move to the upside, including short-term support.
Even the CIB has been broken, which suggests that a shift in market behavior is underway.
Our statistical probability of hitting the centerline is roughly 80%. That implies we can look for a longer-term play in TLT.
However, keep a close eye on the 1/4 line. It isn’t exactly friendly, as the rejections we’ve seen so far make clear.
I probably go with ITM LEAP options with a
Delta of around 70–80 and a over 120 DTE.
Happy profits, and for those in the U.S., wishing you a happy Thanksgiving.

Will SPX Make New All Time Highs? We dive into the recent technical setup of the S&P500.
We are on the verge of triggering a new massive bullish patterns.
The backdrop of soft commodities. soft yields, softer dollar and the December 10 rate cute.
We have the tailwinds in place for higher price.
I would like to see some sideways chop to make this rally more sustainable, but bull market bounces are very fierce especially when they come from failed bearish patterns.

US Recession Imminent! WARNING!Bond traders are best when it comes to economics. Stock traders not so much.
As the chart shows, historically, when rates bunch up, what follows is a recession. During the recession, the economy tries to fix itself by fanning out the yield curve, marking it cheaper to borrow and boosting the economy.
The best time to be buying up stocks and going long the market is when the yield curve is uninverted and fanned out wide—not when it is bunched up like this.
My followers know this is my first warning of a recession since FEB. 2020.
WARNING! Things can get ugly from here very quickly!

US10YThe market still can't figure out what to make of COVID. Continuing to coin in this 3 year long consolidation phase.
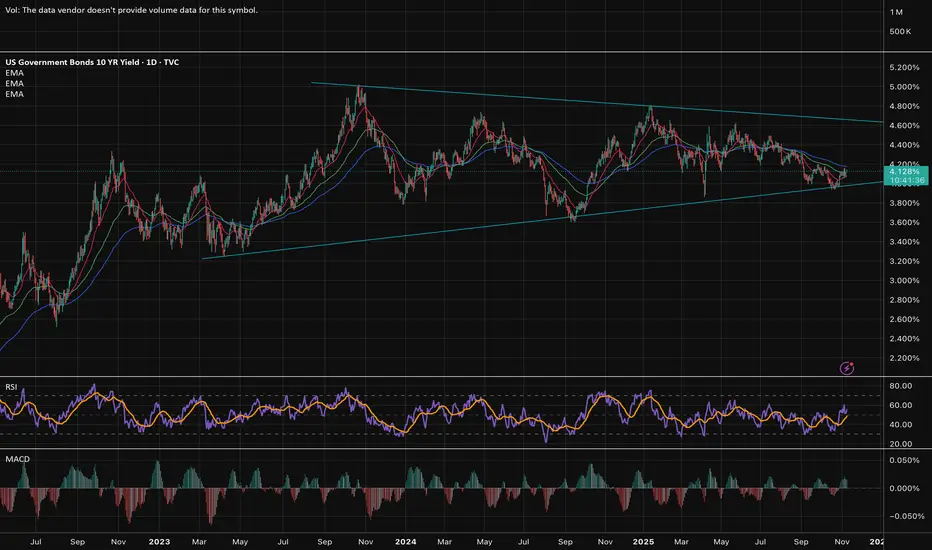
US10Y This break-out can be the next Buy Signal.The U.S. Government Bonds 10YR Yield (US10Y) has been trading within a long-term Triangle pattern and more recently since May 22 2025 it has found itself declining inside a Channel Down.
This Bearish Leg (Channel Down) almost hit the bottom of the Triangle and has been rebounding in the past 10 days. As long as the 1W MA200 (orange trend-line) holds (right now almost at the bottom of the Triangle), the probabilities of a rebound and new Bullish Leg remain strong.
The confirmation for such Bullish Leg will come after the price closes a 1D candle above the 1D MA50 (blue trend-line). If it does, we an expect the price to rise to at least the 0.786 Fibonacci retracement level (Target 4.475%), which has happened all times (3) inside this Triangle after a Bearish Leg bottomed.
-------------------------------------------------------------------------------
** Please LIKE 👍, FOLLOW ✅, SHARE 🙌 and COMMENT ✍ if you enjoy this idea! Also share your ideas and charts in the comments section below! This is best way to keep it relevant, support us, keep the content here free and allow the idea to reach as many people as possible. **
-------------------------------------------------------------------------------
💸💸💸💸💸💸
👇 👇 👇 👇 👇 👇

Stock Market New Highs on CPI? Lotto call option? Tomorrow is the CPI report.
Inflation headline number is expected to be 3.1%.
We will likely see a positive reaction tomorrow which should send the S&P500 to new all time highs.
If we gap up into new all time highs be very careful as this usually gets sold into.
We took a lotto call option on NASDAQ:CRML with members.
This is a pure speculative dead cat bounce play.

Investing in Bonds in the Global MarketIntroduction
In the ever-evolving landscape of global finance, bonds remain one of the most stable and reliable investment instruments. While equity markets often capture headlines with their volatility and potential for massive returns, the bond market — valued at over $130 trillion globally — forms the bedrock of the world’s financial system. Bonds provide essential capital for governments and corporations while offering investors predictable income streams and portfolio diversification.
Investing in bonds in the global market involves understanding the different types of bonds available, their risk-return characteristics, how interest rate movements influence them, and the factors shaping the global fixed-income environment. This essay explores the nature of global bond investing, its benefits, challenges, strategies, and the evolving dynamics in an interconnected global economy.
1. Understanding Bonds and Their Global Role
A bond is a debt security issued by a borrower — typically a government, municipality, or corporation — to raise funds from investors. In exchange, the issuer agrees to pay periodic interest (known as the coupon) and return the principal on maturity. In essence, bond investors are lenders rather than owners, unlike equity investors who hold a stake in a company.
The global bond market is divided broadly into:
Sovereign Bonds – Issued by national governments (e.g., U.S. Treasuries, German Bunds, Japanese Government Bonds).
Corporate Bonds – Issued by private or public corporations to finance operations or expansions.
Municipal Bonds – Issued by states, cities, or other local governments (mostly in the U.S.).
Supranational Bonds – Issued by international institutions like the World Bank or the European Investment Bank.
Global investors allocate funds to these instruments across various geographies to diversify risk and capture stable returns.
2. The Structure and Dynamics of the Global Bond Market
The global bond market is larger than the global stock market and plays a critical role in facilitating liquidity and funding across economies. It operates through both primary markets (where new bonds are issued) and secondary markets (where investors trade existing bonds).
The U.S. dominates the bond market, followed by the Eurozone, Japan, and China. Emerging markets have also become increasingly active players, issuing bonds denominated in both local and foreign currencies to attract international investors.
Key indicators in the bond market include:
Yield to Maturity (YTM): The total return expected if the bond is held to maturity.
Credit Rating: An assessment of the issuer’s creditworthiness, provided by agencies like Moody’s, S&P, and Fitch.
Duration and Convexity: Measures that indicate the bond’s sensitivity to interest rate changes.
These metrics help investors assess potential risks and rewards in a global portfolio.
3. Benefits of Investing in Global Bonds
a. Diversification
Investing in global bonds provides geographic diversification. Since interest rates, inflation, and economic cycles vary across countries, exposure to multiple bond markets reduces the portfolio’s overall volatility.
b. Stability and Predictable Income
Unlike equities, bonds provide fixed coupon payments, offering a predictable income stream. This stability attracts conservative investors, such as pension funds and retirees.
c. Risk Management
Bonds, especially government and high-grade corporate bonds, often act as a hedge during equity market downturns. When stock markets fall, investors typically move toward safer assets, driving bond prices higher.
d. Access to Foreign Currencies
Investing in foreign bonds can provide exposure to different currencies, offering potential gains from favorable exchange rate movements.
e. Inflation Protection
Certain bonds, such as inflation-indexed securities (like U.S. TIPS or U.K. Index-linked Gilts), adjust their principal and interest payments based on inflation, preserving real returns.
4. Risks in Global Bond Investing
While bonds are often viewed as safer than equities, they are not risk-free. Investing globally introduces additional layers of complexity.
a. Interest Rate Risk
Bond prices and interest rates move inversely. When global central banks raise rates, existing bonds with lower yields lose value. Hence, global investors must monitor monetary policies across major economies.
b. Credit Risk
There is a risk that the bond issuer may default on payments. Emerging-market bonds and corporate bonds typically carry higher credit risk compared to sovereign bonds of developed nations.
c. Currency Risk
Investing in bonds denominated in foreign currencies exposes investors to exchange rate fluctuations. For instance, if the U.S. dollar strengthens, returns from euro-denominated bonds may diminish for dollar-based investors.
d. Liquidity Risk
Certain bonds, especially those from smaller issuers or emerging markets, may have limited trading activity, making it difficult to sell them quickly without a price concession.
e. Geopolitical and Economic Risk
Global events such as wars, trade tensions, sanctions, and political instability can disrupt bond markets, particularly in developing regions.
5. Types of Global Bonds
a. Government Bonds
Issued by sovereign states, these bonds are considered the safest investments. Examples include:
U.S. Treasury Bonds – Global benchmark for risk-free rates.
German Bunds – The eurozone’s standard for stability.
Japanese Government Bonds (JGBs) – Used by investors seeking ultra-low yields but high safety.
b. Corporate Bonds
Issued by companies to raise capital. They offer higher yields than government bonds but with added credit risk. Global giants like Apple, Toyota, or Shell issue bonds accessible to global investors.
c. Emerging Market Bonds
Issued by developing economies (e.g., Brazil, India, South Africa). These bonds offer higher yields due to elevated risk but can be rewarding in periods of global growth.
d. Eurobonds
Issued in a currency different from the issuer’s home currency. For example, a Japanese company might issue dollar-denominated bonds in Europe. These instruments enhance global liquidity.
e. Green and Sustainable Bonds
An emerging category where proceeds are used for environmental or social projects. These have gained significant traction as investors prioritize ESG (Environmental, Social, and Governance) criteria.
6. Factors Influencing Global Bond Markets
a. Central Bank Policies
Interest rate decisions by central banks such as the U.S. Federal Reserve, European Central Bank, and Bank of Japan significantly impact bond yields globally. Quantitative easing and tightening cycles influence global liquidity and investor sentiment.
b. Inflation Trends
Rising inflation erodes real returns on fixed-income investments, leading investors to demand higher yields. Conversely, low inflation boosts bond prices.
c. Fiscal Deficits and Public Debt
Countries with large fiscal deficits may need to issue more bonds, influencing supply and yield levels. Investors also consider debt sustainability when investing globally.
d. Global Capital Flows
Institutional investors and sovereign wealth funds allocate massive capital across borders, affecting demand and yield spreads among regions.
e. Geopolitical and Economic Stability
Stable economies attract more bond investors. Events like Brexit, wars, or trade conflicts can trigger capital flight or yield volatility.
7. Strategies for Global Bond Investing
a. Active vs. Passive Investing
Active managers analyze global economic trends, interest rate expectations, and credit cycles to select bonds that may outperform. Passive investors, on the other hand, prefer bond index funds or ETFs that track global benchmarks such as the Bloomberg Global Aggregate Bond Index.
b. Currency Hedging
To mitigate currency risk, investors often use hedging tools like forward contracts or currency-hedged ETFs. This helps stabilize returns in home-currency terms.
c. Duration Management
Investors adjust portfolio duration based on interest rate outlooks. When rates are expected to rise, shorter-duration bonds are preferred to minimize price losses.
d. Credit Spread Analysis
Monitoring credit spreads — the yield difference between corporate and government bonds — helps investors gauge market sentiment and risk appetite.
e. Diversification Across Regions
Allocating investments across developed and emerging markets balances risk and return potential. For instance, combining U.S. Treasuries with Indian or Brazilian bonds can enhance yield without extreme exposure.
8. Role of Technology and Innovation
Technological innovation has transformed global bond investing. Electronic trading platforms have improved liquidity and transparency, while data analytics and artificial intelligence help investors identify opportunities faster.
Moreover, tokenized bonds — digital versions of traditional bonds traded on blockchain platforms — are emerging, promising greater accessibility and efficiency in global debt markets.
9. The Future of Global Bond Investing
The future of global bond markets will be shaped by several key trends:
Sustainability Focus: Growing demand for green and ESG-compliant bonds.
Digitalization: Blockchain-based issuance and trading to reduce costs.
Emerging Market Growth: As developing nations expand, their bond markets will attract more global investors.
Interest Rate Normalization: Following years of low or negative rates, the post-2020 era may witness gradual normalization, impacting bond valuations.
Geopolitical Realignment: Shifts in global power structures and currency preferences (e.g., de-dollarization trends) will influence international bond flows.
10. Conclusion
Investing in bonds in the global market offers investors a unique blend of safety, income stability, and diversification. While equities may deliver higher returns, bonds provide the essential balance in a diversified portfolio, helping manage risk and protect capital during volatile times.
However, success in global bond investing requires understanding complex factors — interest rate movements, currency dynamics, credit risks, and geopolitical developments. With proper strategy, diversification, and risk management, investors can harness the immense opportunities in the global bond market while safeguarding their wealth.
In an interconnected world, bonds remain not just a tool for income generation but a cornerstone of global financial stability. As economies evolve, technologies advance, and sustainability takes center stage, global bond investing will continue to adapt — offering investors both security and growth in an uncertain yet opportunity-rich financial landscape.
