Bitcoin VS bearish crossAfter the bearish cross on the daily chart for Bitcoin, 75% of the time it has led to a bounce lasting 3–5 months, which triggers a rally in altcoins. This time we will probably see a nice altcoin rally until March 2026, IMO.
Trend Lines

"Falling Knife" Stable Coins Dominance Analysis (1W)Hello everyone.
The entire crypto market is about to face a crucial decline.
There are many technical ways to show it.
I'm here today to show you one of them.
One of the best ways of examining the crypto market is checking the stablecoin dominance.
The most famous way to do it is simply looking at the USDT.D chart, which is extremely bullish right now.
The problem with that is, if stablecoin dominance is rising, it means the market is going down. Also vice versa.
We can also combine them to see more complex details to understand what is about to happen in the near future.
Right now, you're looking at the “USDT.D + USDC.D” chart, so they are combined.
The problem here is, this chart is extremely bullish on the weekly timeframe.
It means extremely bearish for the entire crypto market.
There is a very common pattern known as a “triple bottom,” which is about to break. Moreover, a broken trendline on the weekly timeframe simply means that the trend is not likely to end very soon.
We might be witnessing a very bearish market next year.
Be prepared.
Good luck.

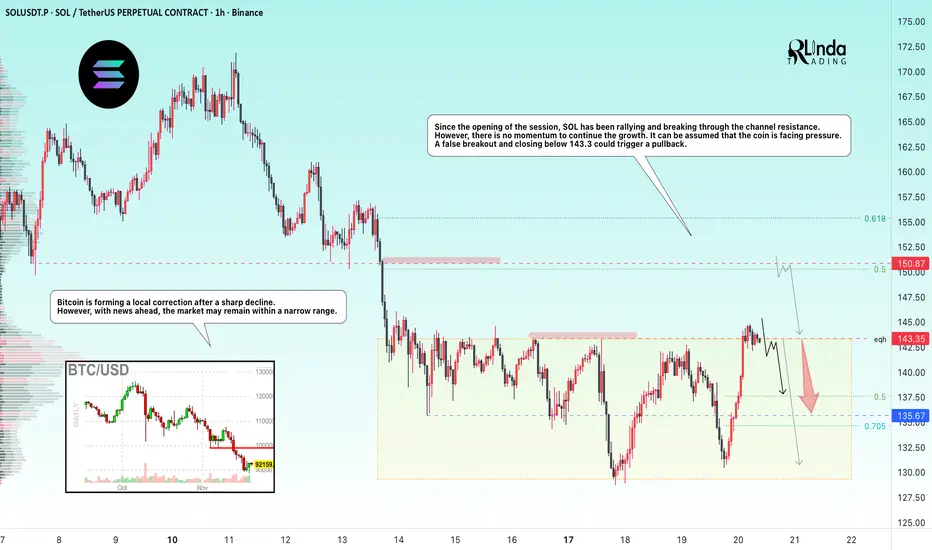
SOLANA → Manipulation - false breakout of resistance BINANCE:SOLUSDT.P flew up to resistance at 143.35 at the opening of the session and attempted to break through it, but bears may not let the price rise ahead of the news...
Bitcoin is forming a local correction after a sharp decline. However, news is ahead and the market may remain within a narrow range.
From the opening of the session, SOL rallies and breaks through the channel resistance, wasting 75% of its intraday growth potential. However, there is no momentum to continue the growth. It can be assumed that the coin is facing pressure. A false breakout and closing below 143.3 could trigger a pullback.
Resistance levels: 143.35, 150.87
Support levels: 135.67, 130.0
Two key levels for countertrend movement: 143.35 - 150.87. If the liquidity pool does not stop the price at the nearest level, then 150.87 can be considered as an additional level for trading a false breakout.
However, news on unemployment is coming soon, and the market may react quite aggressively. Therefore, if there are no trading opportunities before the news, I recommend refraining from action for an hour and waiting out the storm...
Best regards, R. Linda!
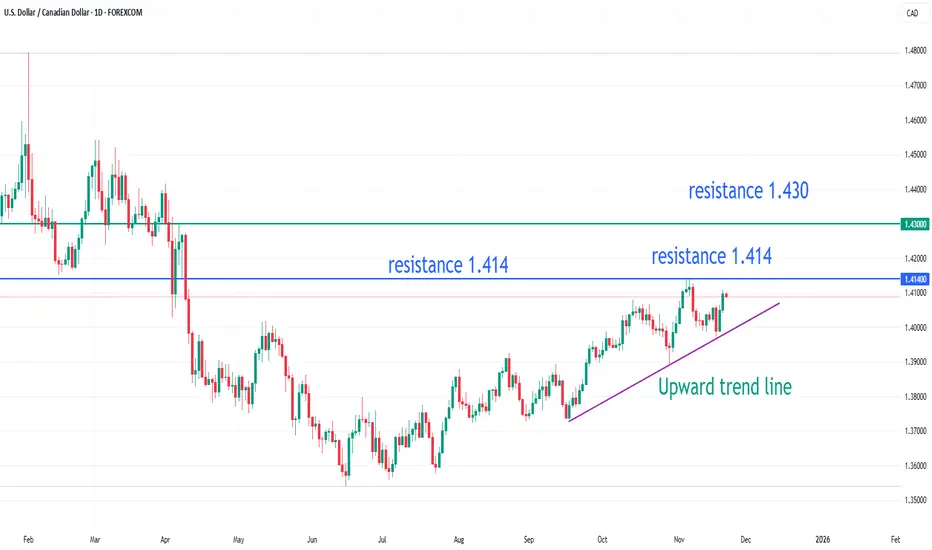
USDCAD is expected to break through 1.414.On the daily chart, USDCAD rebounded and stabilized after testing the upward trend line, indicating a short-term bullish trend. Currently, watch for support around 1.406; a pullback and stabilization above this level could present buying opportunities. Resistance is seen around 1.414, with further resistance around 1.430 after a break above this level.
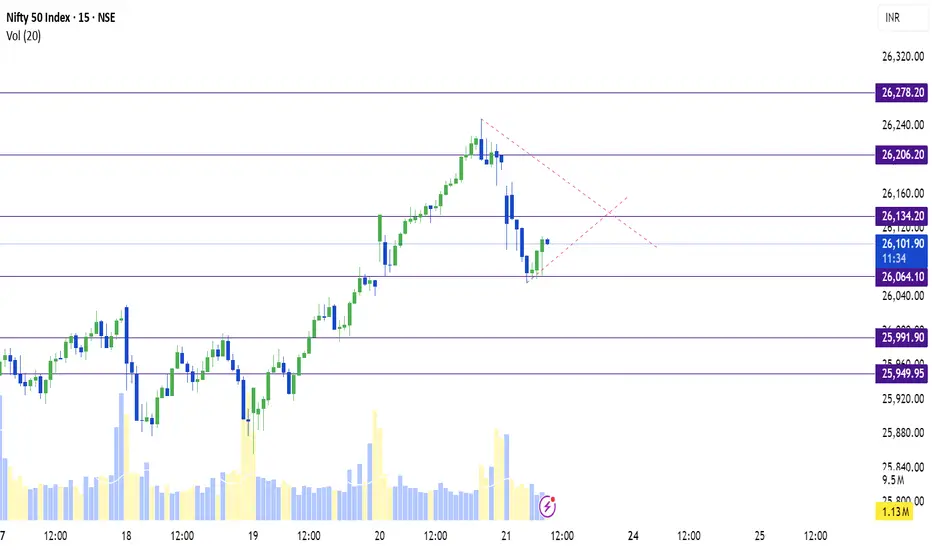
NIFTY 50 SUPPORT, RESISTANCE & TRENDLINE ANALYSISImmediate support at 26064.
Go "LONG" if it stays above 26064 with 26134 as the first target. Breaking and sustaining that also breaking today's high might lead to 26206.20 and if it also breaks and sustains that then we might see 26260 to 26278.20 on the charts.
Go "SHORT" if it breaks 26064 with 25991.90 as the 1st target and breaking further might lead to 25949.
Moving sideways and waiting for a breakout🔍 1. Descending Trendline (red line)
This is an important dynamic resistance.
Price has touched the descending trendline many times and been rejected → the overall trend still leans bearish.
Each retest of the trendline that fails to break gives a sell signal.
👉 Only when price closes above the descending trendline will the short-term trend have a chance to reverse.
🟦 2. Upper Resistance (light blue zone)
This is the area where the market previously made a strong reversal → strong supply zone.
If price breaks the trendline and moves toward this zone, it is a high-probability area where selling pressure may appear again.
🟩 3. Key Support (green zone)
Price has reacted many times at this support zone → strong support.
This is also where price can form a reversal pattern if buyers return.
👉 If price breaks below this support, the bearish trend will continue strongly toward the lower support zone.
🔄 4. Trading Scenarios
Scenario 1: Breakout of the descending trendline → Price moves up to resistance
Price may bounce from the current support area → move up to retest the descending trendline.
If the trendline is broken and retested successfully → target is the major resistance zone above.
For BUY:
Wait for a break & retest of the descending trendline.
BUY GOLD : 4000 - 3998
Stoploss : 3988
Take Profit : 100-300-500pips
SELL GOLD : 4130 - 4132
Stoploss : 4142
Take Profit : 100-300-500pips

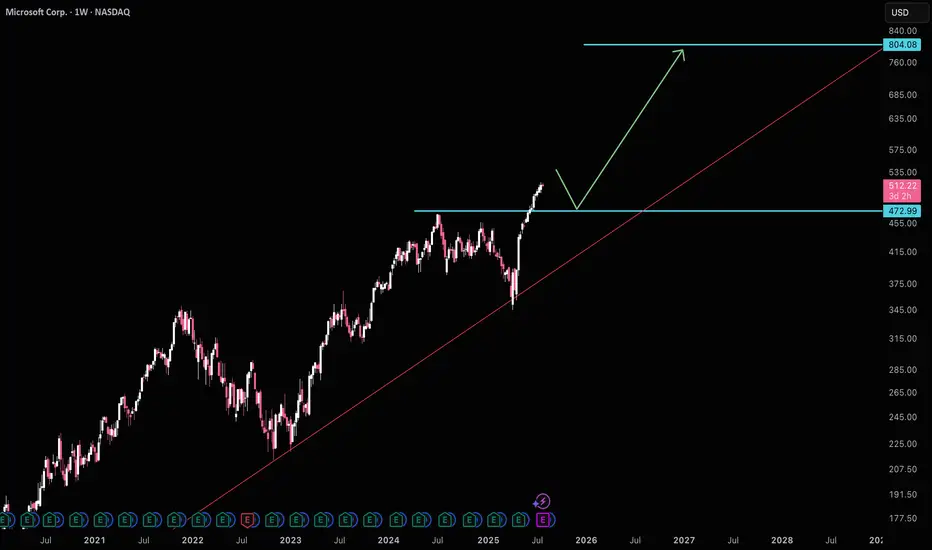
Mircrosoft wants to pullback to $470MSFT is likely to test $470 support before making it's move to $800. Another thing to be weary about is ratio MSFT/AAPL is at historical avg highs, which usually signals a bias towards AAPL. Waiting for $470 is a good idea before getting long again.
Good luck!
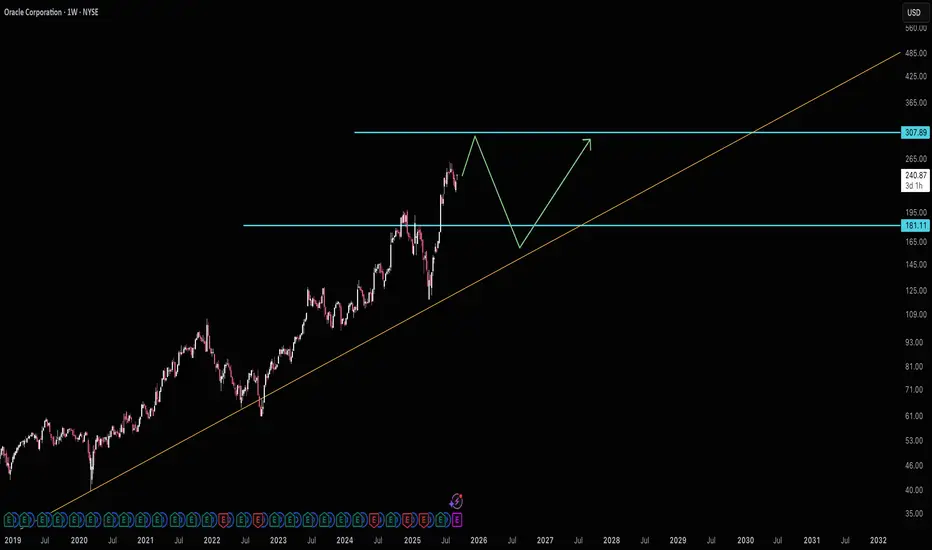
Oracle wants $181Oracle is well off it's long term average and accelerating growth by around 4 years if it hits $307. If it makes it there I would *highly* suggest selling and even potentially a short position. A fair price for ORCL would be $181.
Good luck!
FAZE 3Faze Three Ltd. (currently trading near ₹561.35) – Overview Faze Three Ltd., headquartered in Dadra & Nagar Haveli, is a leading manufacturer and exporter of home textiles, automotive textiles, and technical fabrics. Established in 1985, the company has built a strong global presence, supplying to major retailers and OEMs across the US, Europe, and Asia. Its product portfolio includes bath rugs, carpets, mats, upholstery fabrics, and specialized automotive textiles.
FY22–FY25 Snapshot • Sales – ₹1,050 Cr → ₹1,180 Cr → ₹1,320 Cr → ₹1,480 Cr Growth driven by global outsourcing, automotive textiles, and home furnishing exports
• Net Profit – ₹85 Cr → ₹95 Cr → ₹110 Cr → ₹125 Cr Earnings supported by scale, high-margin technical textiles, and backward integration
• Operating Performance – Strong → Strong → Very Strong → Very Strong EBITDA margins improving with premium product mix and export-led growth
• Dividend Yield (%) – 0.80% → 0.85% → 0.90% → 1.00% Consistent payouts alongside reinvestment into capacity and compliance
• Equity Capital – ₹13.5 Cr (constant) Promoter-led governance with no dilution
• Total Debt – ₹320 Cr → ₹300 Cr → ₹280 Cr → ₹260 Cr Gradual deleveraging supported by export cash flows and high-value contracts
• Fixed Assets – ₹450 Cr → ₹470 Cr → ₹490 Cr → ₹510 Cr Capex focused on technical textiles, automation, and sustainability initiatives
Institutional Interest & Ownership Trends Promoter holding ~55% FIIs/DIIs selectively invested due to strong textile exports and automotive demand visibility Public float ~45%, with delivery volumes reflecting long-term positioning by textile-focused funds
Business Growth Verdict Faze Three is scaling across home textiles, automotive fabrics, and technical textiles with strong global client stickiness Margins improving via high-value contracts and backward integration Debt is declining steadily with strong export cash flows Capex supports long-term competitiveness in technical textiles and global expansion
Management Highlights • FY25: Expanded automotive textiles and technical fabric portfolio; strengthened US and EU client base • Sustainability: Focus on carbon neutrality, water positivity, and zero-waste manufacturing • Digital: AI-enabled process optimization and predictive analytics in textile manufacturing • FY26 Outlook: 10–12% revenue growth, PAT expected to cross ₹140 Cr
Final Investment Verdict Faze Three Ltd. offers a mid-cap textile and automotive fabrics story built on innovation, sustainability, and global partnerships. Its improving profitability, disciplined capital structure, and expanding client base make it suitable for accumulation by investors seeking exposure to India’s textile exports and automotive demand theme. With strong execution and global reach, Faze Three remains a durable compounder in the mid-cap textile space.

OUTLOOK XAUUSD 15m Analysis (21st November 2025)Hey Guys, It's Friday, This is just a trade idea not a financial advise.
BUY/SELL SCENARIOS:
BUYS:
1) Body Candle Close the 4088.83 level.
2) Retest the 15m Bullish CHOCH at the 4078.34 level.
3) Create a 3/5m Bullish Engulfing Candle to capitalise on BUYS towards the 4133.00 level.
SELLS:
1) Body candle close below the 4056.34 level.
2) Retest the 15m Bearish CHOCH at the 4056.34 level.
3) Create a 3/5m Bearish Engulfing Candle to capitalize on SELLS towards the 3998.00 level.
Trade according to plan, don't FOMO!

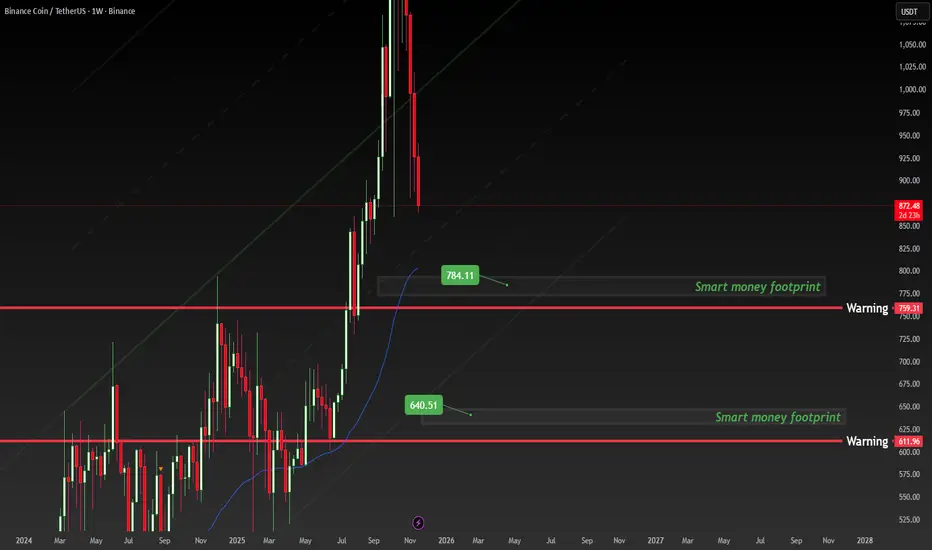
BNB ABOUT TO EXPLODE 300%BNB ABOUT TO EXPLODE 300%?! Smart Money Already Loading at $784 & $640 – Don’t Miss the Next Leg Up! 🚀
This is the EXACT footprint I’ve been waiting for on BNB/USDT weekly timeframe!
Smart money accumulated heavily at $640 and now defending the $784 zone like their life depends on it. Exactly the same pattern that launched us from $17 → $690 in 2021. History is literally repeating in front of our eyes!
Every time BNB holds these “Smart Money Footprint” levels, we see minimum 3-5x moves. The weekly chart is screaming “accumulation phase over” – next stop $2,000+ in this cycle!
Who else is stacking BNB right now? 👇
Tag your crew and let’s make this moon together!
Shoutout to the BNB gods on TradingView:
@CryptoCred @CryptoWolfSignal @TheCryptoDog @Trader_XO @DonAlt @CryptoNewton @WiseAnalyze @Alanmasters – what do you guys think, is $2,000 incoming this cycle? 👀
Drop a 🚀 if you’re loading BNB under $800
Save this chart – you’ll thank me at $2,000+
#BNB #BinanceCoin #Crypto #Altseason #1000x
BTC.D – Five Waves Completed: Preparing for a Wave 2 RetracementBTC Dominance has reached a pivotal stage. After completing a clean five-wave impulsive structure to the upside, the chart is now signaling the early stages of a broader corrective retracement. This aligns with classic Elliott Wave behavior: once a five-wave advance concludes, the market typically enters a deeper, sentiment-resetting Wave 2. For BTC dominance, this phase often marks a shift away from Bitcoin strength and into altcoin outperformance — the groundwork for a potential altseason.
Across the chart, the impulsive top is clear. Wave (v) terminated inside a major multi-year resistance zone, accompanied by structural exhaustion and weakening momentum. Following the top, BTC.D broke below the rising trendline that had supported the entire advance. The subsequent retest and rejection of this trendline confirms that the prior trend has ended. This kind of structural break is a textbook early signal for the start of a corrective wave.
Wave 2 in dominance is known for being deep and rapid. Fibonacci retracements between the 0.5 and 0.786 levels are typical, and the BTC.D levels align perfectly with this expectation. The 50% level sits around 50.6%, the 0.618 at 47.5%, and the 0.786 at 43.5%. This entire region forms the primary target area for the developing Wave 2. It represents the zone where BTC.D is most likely to stabilize before preparing for a larger Wave 3 advance later on. But during Wave 2, dominance usually weakens sharply — often fueling significant rotations into altcoins.
The horizontal structure reinforces this view. The 61–63% band, which previously acted as demand, has now turned into resistance. As long as BTC.D remains below this zone, the bearish corrective thesis remains firmly intact. Only a decisive reclaim of this level would challenge the view that Wave 2 is unfolding.
There is an alternative scenario on the chart: the possibility that the entire structure is part of a larger macro regular flat, meaning the current move could be a Wave C push up into 69–73%. While technically valid, this path requires BTC.D to reclaim the broken trendline and break cleanly above the 63% resistance band. Until those signals appear, this scenario remains secondary.
At present, the dominant evidence points toward the onset of a Wave 2 decline — one that could bring BTC dominance back into the 50–43% range. Historically, such corrections have aligned with some of the most powerful altcoin expansions. If BTC.D continues to reject from the current zone, the conditions for another altseason may already be forming.

Ethereum Falls Under $2,800 — A 44% Drawdown From the Highs📉 Ethereum ( BINANCE:ETHUSDT ) has officially broken below the $2,800 level, a major structural zone that has acted as both strong support and resistance in multiple past cycles.
🔻 The drop now totals -44% from the all-time highs, pushing price back into an area where long-term buyers previously stepped in aggressively.
📊 The weekly RSI sits near 40, historically a region that has offered short-term relief and attractive asymmetric setups.
🧭 From a risk-reward standpoint, this remains an interesting zone for gradual accumulation, especially as sentiment turns increasingly bearish.
💡 In markets, the best opportunities tend to appear when nobody wants the asset.

My Prediction for BTC 2025-2026 Bouncing between the Green lines !
I hope you understand my chart! What goes up must come down and vice versa! What goes down must go up! Also see the fair value gaps hitting 🫣🤩 I hope to validate! Let’s see if and when 🤓
Greetings and happy trading 🫡

Long NRLLonged NRL. Broken trendline. If it sustains over this and specially breaks 443 and closes above then it should go. I have already bought shares here. Do your own due diligence before jumping off the cliff. Entry, Stoploss & Exit all there but its for reference only.
Manage your risk! #DYOR

MSTR chart update. Bounce to $266-315 before more downside?Updating the prior chart as the levels I had were off. I think it's likely that we bounce from this level.
You can see we've now hit a key support and filled a gap that was on the chart at $176. I think it's likely that we see a strong bounce from this level.
Reasons being:
1. We're at a key support
2. 3 touches of bottom of flag, usually 4th one breaks it, 3rd creates a powerful move in the opposite direction
3. Strong call flow on MSTR the past few days
I think it's likely we bounce up to the $266 or 315 resistance levels. This is a trade, not a long term position to hold.
Let's see if it plays out. Breaking this level as lower support will open up the possibility to see lower levels.

Gold awaits non-farm payroll data for direction!Gold Technical Analysis: Today's highly anticipated non-farm payrolls report is a major event. This isn't just any ordinary employment data; it's the first employment report released since the US government reopened, drawing immense attention. Why is this non-farm payrolls data so crucial? Consider this: during the government shutdown, many economic data couldn't be released normally. Now that the government is finally back, this data is like a ray of light in the darkness, illuminating the latest situation in the US job market. Moreover, it will have a key impact on the Federal Reserve's future monetary policy direction, meaning it could potentially create significant volatility in the financial markets. Looking at Tuesday's ADP data, the focus is undoubtedly on weak employment and increased expectations of interest rate cuts. While there's already much speculation and analysis in the market, no one can guarantee the data will turn out well. If the data far exceeds expectations, it could give the US dollar a strong boost. How will the stock market, gold, and commodity markets react? If the data falls short of expectations, will expectations of a Fed rate cut intensify further? All these questions will be answered today.
Gold prices have fluctuated wildly these past two days, but this is in line with our expectations, and the market has cooperated. We've perfectly timed our long and short positions, and congratulations to those who followed our advice. After a morning surge followed by a pullback, gold has entered a period of low-level consolidation, continuing its back-and-forth movement. However, gold is likely to remain range-bound before the Non-Farm Payrolls report, so patience is key while waiting for the data. We've repeatedly bought gold around 4050-4030, and the expected rebound yielded several profits. Now, we're just waiting for the Non-Farm Payrolls report. Market conditions are constantly changing, and gold is currently consolidating within a large range, with the possibility of a sudden reversal. More patience, perseverance, and waiting are needed. Don't be impatient; haste makes waste. Let's witness together what kind of waves the Non-Farm Payrolls report will create in the US session.

SPX Big Drop Today - H4 DowntrendSPX opened up big today and quickly erased all the gains. It created a lower high (LH) on 61.8 and rejected there for a nice short. Price broke support on H4 signaling weakness, so we pull out fibs to measure where the next possible LH could be. First TP is on the -27% red line, which also lines up with previous daily support. Lets see how price reacts in that area. Feel free to drop opinions!

MSTR to $676MSTR is on major support, looking to run to $676 once bitcoin lifts (currently just below it's long term trend buy area).
Good luck!

Should I sell Bitcoin?This chart is to offer up some guidance to those thinking of selling.
Trend lines are made to be broken. They express the rate of increase at the absolute bottom of the selling. So when a trend line breaks you're now in the area you actually want to buy for long term as a new trend will form from that low.
As you can see with past Bitcoin trends whenever there's a new low made, that's where the price eventually wants to come back to. And if the move above the trend was significant enough it will likely break it as people sell at the bottom. Currently as you can see from the Yellow section we are in a steady trend much like the latter part of 2016-2017. We've made small moves up to the previous (covid low) trend line and back down. These oscillations have been historically quite small. So any moves below this trend line are likely not to be significant.
If Bitcoin ever attempts a move up into the covid low channel at makes it up to that upper trend line, That would be a significant rise and would very likely follow a significant fall.
As for right now Bitcoin has breached the trend line slightly and is in what I would consider an opportunistic buy area with very low downside risk.
Good luck!

CRYPTO: ETH/BTC (1D)ETH/BTC Elliott Wave Outlook: Is More Downside Ahead for Altcoins?
The ETH/BTC pair continues to sit at a critical juncture, and the broader altcoin market is watching closely. Using an Elliott Wave framework, the current structure suggests that both bullish continuation and a deeper corrective leg remain possible — but the next move depends heavily on how price behaves at the present support zone.
Current Structure: Wave (4) or Something Deeper?
Based on the chart, ETH/BTC completed a strong impulsive rally into what appears to be Wave (3), followed by a prolonged corrective structure labeled W–Y, which forms the basis of Wave (4).
Price is currently consolidating inside a key support zone — an area that aligns with the 0.618 retracement of the prior major impulse. This is typically a high-probability region for a Wave (4) low to form. But so far, buyers have not shown strong dominance, and price remains under a descending resistance trendline.
Scenario 1: Support Holds → Wave (5) Rally
If ETH/BTC holds the shaded support block, we may see the next leg higher — Wave (5).
This would likely result in:
A breakout above the descending trendline
A move toward the Fibonacci extensions shown on the chart
Altcoins gaining relative strength against Bitcoin
Wave (5) targets typically project toward the 0.236–0.382 extension, aligning with the higher levels drawn on your chart. This would favor a strong ETH recovery relative to BTC into early 2026.
Scenario 2: Support Breaks → More Downside First
However, a break below this structure — especially a move beneath the previous swing low — would invalidate the bullish Wave (4) interpretation.
If that happens:
ETH/BTC enters a deeper corrective phase
Altcoins (especially ETH) may continue underperforming
Price could drop toward the deeper 0.618 Fibonacci zone
The "invalidations" level becomes a critical marker
This deeper decline would likely be the final washout before a much larger upside reversal — essentially completing the correction before a true macro impulsive wave begins.
So, Are We Expecting More Downside for Alts?
Yes — more downside is still possible, but not guaranteed.
The market is sitting at a decision point:
Hold support → Begin Wave (5) upward
Break support → One more significant drop before recovery
Until the current range resolves, ETH/BTC remains neutral-to-cautiously-bearish, with structural bullish potential still intact as long as the key invalidation level holds.

GBP/USD Bears Halted Post-NFP – Decision Time at Pivotal SupportThe British Pound is poised snap a two-week rally with the break below the 52-week moving average taking GBP/USD into downtrend support. A mixed read on the September Non-Farm Payroll report today halted a four-day decline and while the broader downtrend remains intact, the near-term focus is on whether this support zone can spark a short-term recovery or give way to a deeper decline. The jobs data offered little directional clarity for the Dollar, and traders are now watching for confirmation from price action at this level to guide positioning into next week.
The Sterling decline is now testing support at the 100% extension of the decline off the yearly highs at 1.3080 with the 25% parallel just lower- looking for a reaction off this mark in the days ahead. Initial resistance is eyed at the May / July lows and the 2023 swing high at 1.3140/42 and is backed by the median-line, currently near ~1.3220s. A break / weekly close above this slope is needed to suggest a more significant low is in place and that a large recovery is underway within the broader downtrend. Subsequent resistance is eyed at the July low-week close (LWC) and the 38.2% retracement of the September decline at 1.3280/84 with broader bearish invalidation now lowered to the 50% retracement at 1.3369.
A break / weekly close below 1.3080 and the 25% parallel is needed to mark resumption of the June downtrend with subsequent support objectives seen at the March 2024 high and the 2025 March high-week close at 1.2894/95. Note that the lower parallel converges on this threshold next week- look for a larger inflection there IF reached. The next major technical consideration rests at 1.2745/73- a region defined by the 61.8% retracement of the yearly range and the February 2019 low.
Bottom line: Sterling is testing support this week and although the broader outlook remains tilted to the downside the immediate focus is on possible inflection off this zone with short-bias vulnerable while above. From a trading standpoint, rallies should be limited to 1.3140 IF price is heading lower on this stretch with a close below the 25% parallel needed to fuel the next major leg of this decline.
-MB

BtcusdtI think Bitcoin will bounce from the 77-80K range and touch a new high in the 140K range.
If the 77K range breaks downwards, we should wait for the 60K range.
