$BIST:DENGE/FX:USDTRY update$BIST:DENGE/FX:USDTRY
risk of a decending triangle. cancelling long idea for now
Triangle

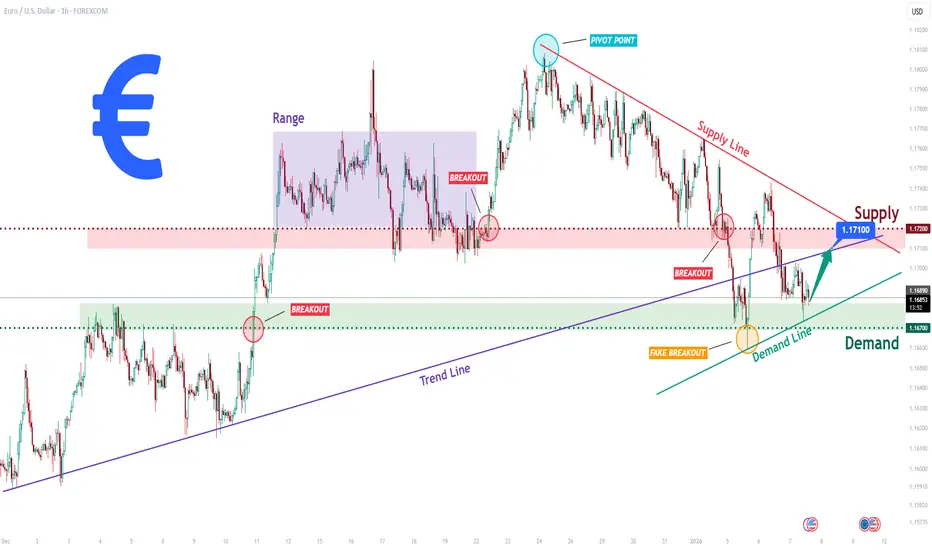
EURUSD Long: Compression Near Key Zones Signals Upcoming MoveHello traders! Here’s a clear technical breakdown of EURUSD (1H) based on the current chart structure. EURUSD previously traded within a well-defined ascending structure, respecting a rising trend line that acted as dynamic support during multiple pullbacks. This bullish phase showed consistent higher lows, confirming buyer control. After the impulsive upside move, price entered a consolidation range, highlighted on the chart, where buyers and sellers temporarily reached equilibrium. From this range, EURUSD executed a bullish breakout, confirming continuation and pushing price toward the upper structure. However, as price approached the Supply Zone around 1.1720–1.1750, bullish momentum started to fade. Multiple reactions, including fake breakouts and rejections near the pivot point, clearly signal strong selling pressure in this area. A descending Supply Line now caps price, reinforcing bearish pressure from above.
Currently, on the downside, price recently swept below short-term support, forming a fake breakout into the Demand Zone around 1.1670, which aligns with an ascending Demand Line. The quick recovery from this area suggests active buyers defending demand and preventing deeper downside for now. Currently, EURUSD is compressing between demand support and descending supply resistance, indicating a tightening structure and an upcoming directional move.
My scenario: as long as EURUSD holds above the 1.1670 Demand Zone and respects the rising demand line, a corrective bounce toward the 1.1710–1.1720 Supply Zone is possible. This area remains a key decision point. A strong rejection there would favor renewed bearish continuation, while a clean breakout and acceptance above supply would invalidate the bearish pressure and open the door for bullish continuation. Manage your risk!
EURUSD Rejection From Key Resistance, Target 1.1640Hello traders! Here’s a clear technical breakdown of EURUSD (1H) based on the current chart structure. After a strong bullish impulse earlier, EURUSD transitioned into a corrective phase and started trading inside a well-defined descending channel, indicating controlled bearish pressure rather than an aggressive sell-off. Price respected both the channel resistance and channel support, confirming the validity of this corrective structure. On the left side of the chart, we can see a breakout from a prior consolidation, followed by an impulsive bullish move. This rally eventually stalled and turned around near the upper highs, where selling pressure emerged and pushed price into the descending channel. During this phase, multiple reactions from the channel boundaries showed balanced participation from both buyers and sellers. As price moved lower, it approached the highlighted Seller Zone / Resistance Level around 1.1680. A short-term fake breakout above channel resistance occurred, but buyers failed to hold acceptance above it, signaling that sellers are still active at higher levels. Price then continued lower within the channel. The primary bearish scenario comes into play if EURUSD fails to hold above the 1.1680 Resistance / Seller Zone and shows clear rejection from this area. This zone aligns with the descending channel resistance, making it a high-probability area for sellers to step in. If price retests the 1.1680–1.1700 resistance area and forms bearish rejection signals (long upper wicks, bearish engulfing candles, or failure to hold above channel resistance), it would confirm that the move higher is corrective in nature. In this case, sellers are likely defending the structure and maintaining overall bearish control. Once rejection is confirmed, I expect price to resume its move lower inside the descending channel, targeting the 1.1640 Buyer Zone / Support Level as the first downside objective (TP1). A clean break and acceptance below this support would strengthen bearish momentum and open the path toward lower support levels, extending the correction further. However, if price breaks and holds above the descending channel resistance and the 1.1700 level, the short scenario becomes invalid, signaling a potential trend shift or deeper bullish continuation. For now, the market remains in a corrective bearish structure, and shorts are favored on pullbacks into resistance, as long as price stays below the key resistance zone. Please share this idea with your friends and click Boost 🚀

Steel cast can be breakout swing investment ideaThe trendline are self explainatory and the candle stick pattern already given small wick about the trendline. In todays bearish market, the full body candle gives an entry opportunity for Breakout.

SOLANA - retest resistance of the trading range BINANCE:SOLUSDT has been rising since the session opened amid a weak market. The altcoin is showing bullish momentum in a predominantly bearish market, with a focus on the 145.0 zone.
Bitcoin is rebounding from resistance amid a global downtrend. There is currently no bullish potential (across the entire market), which is putting pressure on altcoins overall.
SOL, against the backdrop of a neutral market, is seeking to test the resistance zone of 144.7 - 146.0 - a key liquidity zone that plays an important role for MM in the current circumstances.
A short squeeze and the formation of a reversal pattern could shift the imbalance towards sellers, which in turn could lead to a decline.
Resistance levels: 143.4, 144.7, 146.0
Support levels: 134.3, 127.55
Solana is trading in a neutral trading range of 145.0 - 123.0. The main trend is bearish. The bullish run and retest of resistance can be perceived as a hunt for liquidity. We are interested in the above-mentioned resistance zone and confirmation in the form of a false breakout to enter the market.
Best regards, R. Linda!

GOLD - Correction and retest of support on a bullish trend FX:XAUUSD is forming a correction from the resistance level of 4500 and reaching a local low of 4415. Against the backdrop of DXY growth, the correction may continue. The market is awaiting economic news...
Mixed US data: JOLTS job openings fell to 7.146 million. ADP employment rose by 41,000. The ISM services index rose to 54.4, which is higher than expected.
Expectations for two Fed rate cuts in 2026 remain (≈61 bps). The fundamental backdrop is mixed, with additional confirming data needed.
Geopolitics supports demand: the US has confirmed negotiations on the acquisition of Greenland. China has imposed a ban on the export of dual-use goods to Japan. The focus is shifting to Friday's US employment report (NFP).
The correction in gold appears to be temporary amid continuing expectations of Fed policy easing and geopolitical tensions. The NFP report will be the decisive factor in determining the direction — weak data could trigger a new round of growth.
Resistance levels: 4442, 4475, 4497
Support levels: 4427, 4400
As part of the correction, gold may test the support zone of 4425-4400. Overall, the trend is bullish, and the market correction may be temporary. A false breakdown and the bulls holding the price above key zones could trigger growth towards the flat resistance.
Best regards, R. Linda!

GBPJPY - Waiting for a Long Squeeze Before a Bullish RallyFX:GBPJPY is testing the key support area of 210.28 as part of a correction against the backdrop of an uptrend. What can we expect from the market?
The Japanese yen looks weak, forming a symmetrical triangle consolidation amid a global downtrend. A continued decline in the yen could trigger growth in the currency pair.
GBPJPY is consolidating between 210.28 and 211.59 amid a bullish trend. A manipulative decline is forming with the aim of hunting for liquidity. A long squeeze could trigger growth due to a shift in the imbalance towards the buyer.
Resistance levels: 210.7, 211.15
Support levels: 210.28, 210.05
There is a high probability of a false breakdown of the current trading range support. Focus on the 210.28 - 210.05 zone. After liquidity is captured, the upward movement may continue.
Best regards, R. Linda!

The 3-Step Rocket Booster Strategy + Non Farm Payrolls CatalystToday is the non farm payrolls
this economic data is known to be
a very good catalyst for price movements
This is why i had to hand in
this report to give you a heads up.
Yesterday i missed a trade in IBM NYSE:IBM
not only that about a week ago i made
a mistake in Starbucks..
The Starbucks mistake was due to
me not factoring
a very important pattern called
the ascending triangle
which is the one i use for my swing trading
Even though i am going to try
to give you better reports
With this one i am confident that
it will show us the outcome
we might be looking for
This is because its follwing the
3 step rocket booster strategy
1- The price is above the 50 ema
2- The price is above the 200 ema
3- The price has gapped up
The last step is very important because
its showing
you the ascending triangle
chart pattern
and you can see this
chart pattern
using the stochastic rsi
you can see below
look at how the lines have
crossed each other
Almost like a "rising triangle"
thats the chart pattern we
are looking for
Do you see it?
Rocket boost this content to learn more.
Disclaimer:Trading is risky please learn by
using a simulation account
to trade before you trade with real money.

PAEL - Technical Outlook PAEL is showing a potential breakout above a long-term descending resistance trendline, supported by increased volume and a firm base on the ascending trendline near 52. A sustained move above 54 could signal a strong bullish continuation with clearly defined targets:
• TP1: 56.03
• TP2: 57.82
• TP3: 60.20
• TP4: 62.63
Stop-loss is recommended at 51.30 to protect against false breakouts. Momentum indicators support a cautiously optimistic outlook.

ATRL – Swing setupATRL has provided an upside breakout from a symmetrical triangle / compression zone on the daily chart. After multiple sessions of consolidation, price has maintained a higher-low structure and is showing strength supported by volume. The overall trend signals a bullish continuation as long as the price holds above key support levels.
Buying Zone:
• First Buy: 688–690 (CMP zone – already shared during market hours)
• Second Buy (on dip): 672 (trendline & structural support)
Stop Loss:
• 640 (below major structural support)
Targets:
• TP1: 720
• TP2: 740
• TP3: 775 (major breakout level)
Notes:
Price is trading above the ascending trendline and RSI is also indicating strength. Minor pullbacks are buyable as long as the structure remains intact. Partial profit booking is recommended in the 720–740 zone, while 775 remains the medium-term breakout target. The trend will remain bullish unless 640 is breached.
For educational & technical discussion purposes only.

BTCUSD – DailyBitcoin (BTCUSD) has corrected sharply after a strong rally toward 120K+, and is now forming a higher low structure.
Price is currently compressed between:
• An ascending trendline
• A major horizontal resistance near 94,000
→ Ascending triangle / compression structure
Key Levels
• Dynamic Support:
Ascending trendline (87,000 – 88,000)
• Major Static Support:
85,000 – 86,000
• Key Resistance:
93,500 – 94,500
• Next Resistance:
98,000 → 102,000
Bullish Scenario (Primary)
If price:
• Closes above 94,500 (daily close)
• Confirms the breakout with a retest
➡️ Bullish continuation becomes likely.
Upside Targets:
98,000 → 102,000 → 110,000
Invalidation / Stop:
Daily close below 87,000
Bearish Scenario (Alternative)
If price:
• Breaks below the ascending trendline
• Closes under 87,000
➡️ Deeper correction is likely.
Downside Targets:
85,000 → 81,000
Bearish Invalidation:
Acceptance above 94,500
Final Takeaway
BTC is at a critical decision zone.
A breakout above 94K favors continuation, while losing 87K signals further downside.

Cipher Mining(CIFR) 1D: compression before expansionCipher Mining is a US-listed Bitcoin mining company with direct exposure to the BTC cycle and infrastructure scalability.
On the daily chart, price is forming a symmetrical triangle after the prior impulse. The key decision zone sits around 15, where the 0.786 Fibonacci level, diagonal support, MA100 and volume profile align. This area defines the execution zone, while direction is confirmed by higher timeframes.
Direction comes from the higher timeframes. On the weekly and monthly charts, indicators maintain a bullish configuration: moving averages are rising and positioned below price, the broader structure remains intact, and oscillators stay neutral-bullish with no reversal signals. This confirms that the current daily consolidation is occurring within a larger bullish context. The daily MA100 acts as dynamic support inside the range, strengthening the importance of the 15 level.
The base scenario assumes support holding at 15 followed by an upside breakout from the triangle. Initial targets sit near 20.5, followed by 25.5. A decisive breakdown below 15 invalidates the setup.
Fundamentally, CIFR remains a cyclical mining play. Revenue remains elevated, with the next quarterly estimate around $88M. EPS is still negative and free cash flow remains under pressure, which is typical during expansion phases. Strong financing inflows help support liquidity and ongoing infrastructure growth. The stock remains a leveraged bet on Bitcoin continuation.
In short: daily defines the entry, weekly and monthly define the direction.

ETHUSD – 30M Triangle Pattern AnalysisETHUSD – 30M Triangle Pattern Analysis
Ethereum is forming a symmetrical triangle pattern, created by higher lows and lower highs, showing price compression after a strong bullish move. This pattern usually reflects indecision before expansion.
🔺 Pattern Structure (Reason)
The ascending trendline shows buyers stepping in higher on each pullback.
The descending trendline shows sellers defending lower highs.
Price volatility is decreasing, indicating energy building for a breakout.
The pattern formed after an uptrend, giving it a slight bullish continuation bias, though confirmation is required.
📈 EMA & Price Action Context
EMA 9 & EMA 21 are closely aligned, reflecting short-term balance.
EMA 50 (~3,242) is acting as a dynamic mid-support inside the structure.
Price is currently trading near the middle of the triangle, where noise is common.
🎯 Targeted Price Levels (Measured Move)
Upper Breakout Scenario:
Break and acceptance above ~3,260–3,280
Upside Target: ~3,380 – 3,420 (measured from triangle height)
Lower Breakdown Scenario:
Break and acceptance below ~3,200
Downside Target: ~3,080 – 3,100
(Targets are projections, not guarantees.)
🔎 Key Trading Logic
Avoid bias inside the triangle; confirmation comes after breakout.
Expansion is expected once price exits the structure with acceptance.
False breakouts are possible near the apex, so structure confirmation is important.

Nifty shown strong down Trend but this zones are important why ?What trade I have taken and how I have predicted ?

US 100 Index – Facing the Test of Non-Farm Payrolls While the US 100 has made a solid start to 2026, registering a 1% gain in its first 5 days of trading, it has yet to surpass its previous record high of 26277 hit on October 30th. This contrasts with the US 500 and US 30 which both hit new peaks on Tuesday, January 6th, with both popular indices seeming to have benefitted from a broadening of the rally away from AI into other sectors of the economy.
Whether this trend continues into the weekend and early next week could now depend on the outcome of tomorrow’s US Non-farm payrolls release which may help traders determine not only the current health of the labour market and US economy, but more importantly, impact their expectations for the next series of Federal Reserve interest rate decisions.
A stronger than expected payrolls release, while good news for the economy, could weigh on technology stocks in the US 100, as it could imply the Fed may delay further rate cuts until later in 2026, while a weaker than expected number could mean the opposite.
In this regard, the price action post the payrolls release may well be crucial tomorrow. Early moves at the start of a new year can often be wrong, as traders rush to deploy new capital before the wider market gets to assess the macro-outlook. Currently, market expectations are for 2 further interest rate cuts from the Federal Reserve in 2026, which contrasts with Fed policymakers which only see 1. Tomorrow’s data could help clarify which is more likely with a potential knock-on impact for the direction of the US 100.
Technical Update: Decision Making Process Dominates Start of 2026
After the sharp 9.30% drop in the US 100 index from the October 30th high at 26277 to the November 21st low of 23834, the market has mostly moved sideways. These two levels have continued to hold prices in place, indicating a more balanced trading assessment for the past two and a half months.
As the chart above shows, the US 100 index has been making lower highs and higher lows in price since the October/November decline. This means sellers are willing to sell at slightly lower levels each time, while buyers are stepping in sooner on each dip. When prices start to converge like this, it forms what technical analysts call a “Symmetrical Triangle.”
Some traders might say this type of pattern usually continues the previous trend, which for the US 100 index was upward. However, trying to guess the direction of a breakout in advance can be risky. With this kind of pattern in place, it can be a safer option to wait for the price to move above the previous high or below the previous low to determine which directional bias may be emerging.
Potential Resistance Levels:
The most recent high that price strength failed at was 25844, which was set on December 10th. This potentially is the first key resistance level to watch in upcoming sessions. While prices stay below 25844, the triangle pattern can continue. However, if the market were to close above 25844, it could lead to a further phase of price strength.
If the market starts to show potential for further upside, a close above 25844 could shift traders’ attention to the next resistance at 26277, which is the high from October 30th, possibly further if this level in turn is breached.
Potential Support Levels:
The most recent low in this possible triangular pattern is 25063, which was set on January 2nd. This is the level where buyers last stepped in, so it could be a key support area inside the Symmetrical Triangle. While prices stay above 25063, it can be suggested that the support remains in place.
However, if prices were to close below 25063, it could be a sign that downside pressure is building, with the next level to watch being 24644, the low from December 17th. If the US 100 were then to close below 24644 as well, it could point to an even deeper move down toward 23834, which is the low from November 21st.
The material provided here has not been prepared accordance with legal requirements designed to promote the independence of investment research and as such is considered to be a marketing communication. Whilst it is not subject to any prohibition on dealing ahead of the dissemination of investment research, we will not seek to take any advantage before providing it to our clients.
Pepperstone doesn’t represent that the material provided here is accurate, current or complete, and therefore shouldn’t be relied upon as such. The information, whether from a third party or not, isn’t to be considered as a recommendation; or an offer to buy or sell; or the solicitation of an offer to buy or sell any security, financial product or instrument; or to participate in any particular trading strategy. It does not take into account readers’ financial situation or investment objectives. We advise any readers of this content to seek their own advice. Without the approval of Pepperstone, reproduction or redistribution of this information isn’t permitted.

On Vacation with the TriangleI read that 2026 should also be a favorable year for the "Real Estate" sector.
While searching among stocks in this sector, I came across this chart that shows an interesting triangle pattern, now close to a breakout.
The price has been using the lower side as support for 3 years and is approaching $20 in recent weeks for a possible bullish breakout.
Other interesting observations:
The current move starts from the POC of the upper cluster.
The previous break of the horizontal resistance was followed by a 35% increase.

GBP/USD Slumps Towards Two-Month Trend SupportGBP/USD is trading lower on the day as sterling comes under renewed pressure from soft U.K.-specific fundamentals and lingering uncertainty around the economic outlook. The pound weakened as investors continued to digest the Bank of England’s more dovish stance following last year’s rate cut, with markets increasingly pricing further easing as growth momentum cools. While broader risk sentiment has been relatively stable, sterling has underperformed peers as domestic concerns take precedence.
UK data and commentary continue to point to a fragile growth backdrop, particularly in interest-rate-sensitive sectors such as housing and construction, reinforcing expectations that the BOE will prioritize supporting activity over guarding against inflation. With little in the way of positive domestic catalysts today, GBP/USD has been driven lower by relative policy expectations, leaving the pound vulnerable as markets look ahead to upcoming U.K. data and further guidance from the BOE.
In the above chart, GBP/USD has retraced about half of its gains this week in the past two sessions, leaving the pair effectively unchanged for 2026. At first blush, the retracement would appear to be a correction within a modest uptrend since late-November, buttressed by positive slopes in each of the 20-day, 50-day, and 100-day exponential moving averages (EMA). A drop below 1.3400, however, would see the series of higher highs and higher lows over the past six weeks negated, concurrently representing a break below the 20-day EMA. Should GBP/USD trade above 1.3600 by the end of the month, traders may find a symmetrical triangle breakout taking shape.

GOLD - Retesting support at 4440 ahead of the news FX:XAUUSD is correcting from weekly highs of $4,500 amid a rising dollar and profit-taking ahead of key US labor market data
The market expects two Fed rate cuts in 2026. The ISM Manufacturing PMI in December (47.9) was lower than expected, reinforcing expectations of a dovish policy. In addition, geopolitical risks remain (Russia's actions off the coast of Venezuela, tensions between China and Japan), which continue to fuel demand for safe-haven assets.
Today, ADP employment data, JOLTS job openings, and the ISM services index will be released. Weak indicators could increase pressure on the dollar and support gold.
The correction appears to be technical amid profit-taking. The uptrend remains intact as the dollar remains under pressure due to expectations of Fed policy easing. Any decline in gold can be seen as a buying opportunity.
Resistance levels: 4475, 4497, 4520
Support levels: 4442, 4430, 4402
Two key support zones relative to the current trading range: 4442 - 4430. A long squeeze and liquidity capture followed by price consolidation above key levels could shift the imbalance towards the buyer (bullish trend)...
Best regards, R. Linda!

GOLD - Consolidation before resistance at 4470. Bullish trendFX:XAUUSD resumes growth and tests 4470, an important resistance level, amid a weakening dollar caused by expectations of further easing of Fed policy and continuing geopolitical uncertainty.
Expectations of a Fed rate cut intensified after the release of weak ISM Manufacturing PMI data.
Geopolitical risks have temporarily receded into the background, but remain a potential catalyst for a new wave of demand for safe-haven assets.
Attention is shifting to US labor market data (ADP report and JOLTS vacancies on Wednesday, NFP on Friday). Weak employment figures could increase pressure on the dollar and support gold.
Important nuances: China and Russia's reaction to US actions in Venezuela, as well as the open conflict between Russia and Ukraine.
Further dynamics will depend on employment data and a possible escalation of the geopolitical situation. A break above $4470 will open the way to testing higher levels.
Resistance levels: 4470, 4488, 4519
Support levels: 4440, 4430, 4400
If the metal does not pull back from 4470 and continues to storm the resistance, then attempts to continue growth from 4470 can be considered. Otherwise, the market may test 4440-4430 before rising (long squeeze). Within the current cycle, gold has a chance to test its ATH.
Best regards, R. Linda!

DOGEUSDT - Consolidation after growth is a positive signBINANCE:DOGEUSDT is testing resistance, but the coin is not going to reverse yet. Focus on the current consolidation at 0.145 - 0.1534. A long squeeze or a breakout of resistance could trigger growth.
Bitcoin has been growing throughout the week, forming a retest of resistance. If the growth continues, it could support a bullish run in altcoins.
After the rally, DOGE moved into consolidation at 0.145 - 0.1533. The market is showing positive dynamics. The altcoin may test the consolidation support before growing. However, a breakout of the 0.1533 resistance and a close above the level could trigger an early rise.
Resistance levels: 0.1534, 0.1648
Support levels: 0.145, 0.139
Regarding the current consolidation in the trading range format, I highlight two levels: 0.1534 and 0.145. If the overall positive background persists, a false breakdown of support at 0.145 or a breakout of resistance at 0.1534 with the price closing above the level could trigger further growth towards the local zone of interest at 0.165.
Best regards, R. Linda!

XAUUSD: Buyers Defend Support, Retest of 4,490 ResistanceHello everyone, here is my breakdown of the current XAUUSD setup.
Market Analysis
Gold previously traded under pressure near a descending triangle resistance line, where price action was compressed before buyers stepped in. After forming a solid base, XAUUSD broke above the triangle resistance and confirmed a bullish structural shift. This breakout initiated a steady upside move, supported by a rising trend line and a clear sequence of higher highs and higher lows. Following the initial breakout, price entered a range, signaling temporary consolidation and accumulation. Buyers eventually gained control again, leading to a clean breakout above the range and continuation higher. This move brought gold into the key Resistance Zone around the 4,490–4,520 area, where price was recently tested and met with strong selling pressure.
Currently, after the rejection from resistance, XAUUSD pulled back sharply but found demand near the Support Zone around 4,310, which aligns with a previous breakout level and the rising support line. The current price action shows a corrective pullback rather than a full trend reversal, with buyers stepping in to defend this support area. The structure remains constructive as long as price holds above this key demand zone.
My Scenario & Strategy
My primary scenario: as long as XAUUSD holds above the 4,310 Support Zone and respects the rising support line, the bullish bias remains intact. I expect buyers to continue defending this area and attempt another push toward the 4,490 Resistance Zone as the next upside objective.
However, a decisive breakdown below support would weaken the bullish structure and open the door for a deeper corrective move. Until that happens, the overall structure favors continuation to the upside after consolidation.
That’s the setup I’m tracking. Thank you for your attention, and always manage your risk.

Ascending Triangle appearing.FLYNG Analysis
Closed at 57.07 (06-01-2026)
Ascending Triangle appearing.
Crossing & Sustaining 62 - 63 with Good Volumes
may lead it towards 84 & then around 95 - 97.
Very Good Support seems to be around 50 - 52.
However, 43 should be the last hope. If this level
breaks, we may witness trend reversal.

Nasdaq 100 (NDX – Daily)Nasdaq 100 has completed a strong impulsive rally and is now consolidating near the highs.
The current structure is a bullish pennant / continuation wedge, forming after a sharp upward move.
Key bullish factors:
• Price remains above the moving average
• Consolidation is sideways and controlled, not aggressive selling
• No major distribution signs so far
Key Levels
• Dynamic Support:
24,800 – 25,000
• Major Support:
24,200 – 24,000
• Immediate Resistance:
25,700 – 25,800
• Post-Breakout Resistance:
26,500 → 27,200
Bullish Scenario (Primary)
If price:
• Breaks above the upper boundary of the pattern
• Holds above 25,800 on daily closes
➡️ Bullish continuation is confirmed.
Upside Targets:
26,500 → 27,200 → 28,000
Invalidation / Stop:
Daily close below 24,800
Bearish / Deeper Pullback Scenario
If price:
• Fails to break upward
• Loses the 24,800 support
➡️ A deeper corrective move toward demand zones becomes likely.
Downside Targets:
24,200 → 23,800
Bearish Invalidation:
Clean breakout and acceptance above 25,800
Final Takeaway
Nasdaq 100 is consolidating after strength, not weakness.
As long as price holds above 24,800, bullish continuation remains the higher-probability scenario.
