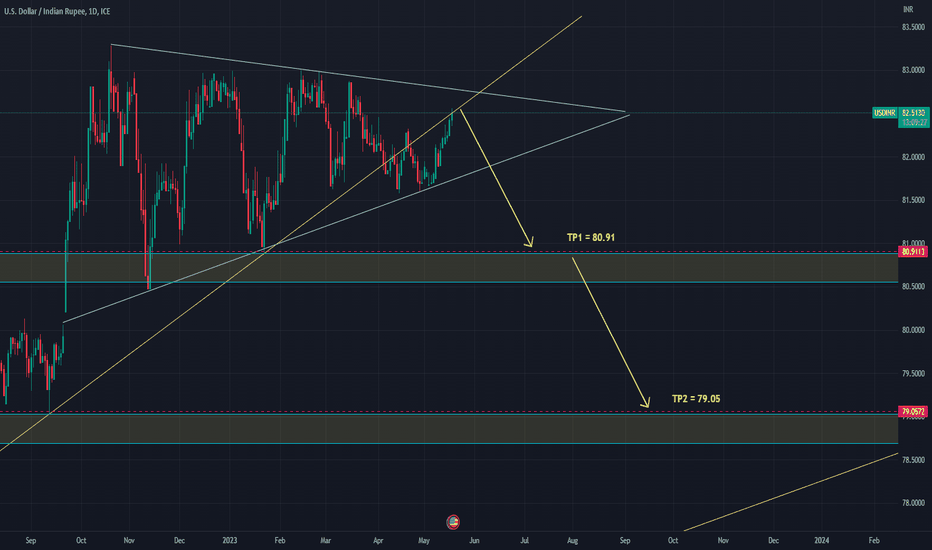
Can the Indian Rupee Survive a Closed Strait of Hormuz?The USD/INR currency pair is experiencing massive volatility today. Escalating global conflicts have pushed the Indian Rupee sharply lower. Traders are scrambling to adjust their positions as energy security fears dominate global markets. Navigating this currency shock requires analyzing multiple macroeconomic and industrial domains.
Geopolitics and Geostrategy
The closure of the Strait of Hormuz reshapes global currency alignments instantly. Iran's recent missile strikes against Gulf states triggered massive energy supply shocks. As Brent crude oil surges past $79 per barrel, emerging market currencies are buckling under pressure.
India imports over 80% of its crude requirements. This extreme vulnerability directly weakens the Rupee against a surging US Dollar. Consequently, New Delhi must rapidly pivot its geostrategy toward alternative Eurasian supply corridors. The US Dollar thrives as a defensive weapon during intense regional warfare.
Macroeconomics and Economics
The Indian Rupee dropped 39 paise to open near 95.77 against the greenback. This sharp currency depreciation accelerates imported inflation across the subcontinent.
Current Account Deficit: Higher crude prices widen India’s trade deficit rapidly.
Capital Flight: Foreign institutional investors are dumping domestic equities to preserve capital.
Central Bank Intervention: The Reserve Bank of India must deploy its $674 billion forex kitty defensively.
Aggressive monetary defense remains the only option to stabilize volatile macroeconomics.
Industry Trends and Business Models
Violating historical stability, wild exchange rate fluctuations disrupt corporate financial planning globally. Indian importers face skyrocketing costs for imported components. To survive, manufacturing corporations are changing their business models entirely.
Firms are abandoning spot purchases for long-term forward currency contracts. Energy-intensive industries now incorporate automated currency hedging as a core operational feature. Modern corporate business models prioritize currency insulation over short-term profit maximization.
Management, Leadership, and Company Culture
Currency volatility tests the absolute limits of executive leadership. C-suite leaders must foster an agile, risk-aware company culture. Slow bureaucratic approval chains cause devastating financial losses during forex shocks.
Modern corporate management empowers treasury teams to execute hedging strategies autonomously. Leadership must integrate currency risk education into standard engineering and operational training. An innovative company culture builds an organization that actively resists macroeconomic shocks.
Technology, High-Tech, and Cybersecurity
High-frequency electronic trading systems dictate intraday USD/INR movements. Automated algorithms process breaking geopolitical headlines within milliseconds to execute trades. This high-tech ecosystem requires massive, uninterrupted digital infrastructure.
However, geopolitical tensions also elevate severe cybersecurity risks. State-sponsored hackers frequently target central banking frameworks and forex clearinghouses to disrupt adversaries. Financial technology companies must implement quantum-resistant encryption immediately. Protecting digital trading networks preserves national currency stability.
Science, Patent Analysis, and Innovation
Scientific innovation offers long-term relief from oil-driven currency depreciation. Patent analysis reveals a massive surge in Indian green hydrogen technologies.
Domestic conglomerates are aggressively patenting novel electrolyzer designs and alternative fuel systems. Commercializing these scientific breakthroughs reduces long-term reliance on expensive imported fossil fuels. Over time, clean energy intellectual property protects the Rupee from geopolitical energy shocks. Scientific dominance directly creates a more resilient fiat currency.
The Pharmaceutical Industry Connection
India acts as the pharmacy of the world, creating a unique economic hedge. A rising USD/INR pair yields a dual impact on the domestic pharmaceutical industry.
Indian pharma firms earn massive revenues in US Dollars from generic drug exports. However, they also import expensive active pharmaceutical ingredients (APIs) from overseas. To mitigate this risk, pharmaceutical companies are investing heavily in local chemical synthesis. Currency fluctuations accelerate the domestic production of life-saving medications.
USDINR
USDINR (4H) BEARISH TARGETS...USDINR is showing signs of weakness after reaching the upper boundary of the rising channel on the 4H timeframe.
Price faced rejection near the resistance zone while struggling to maintain bullish momentum above the channel support area. A breakdown below the current support structure could trigger a corrective move toward the lower trendline region.
Bearish Scenario:
• Rejection from channel resistance
• Weak momentum near supply zone
• Potential move toward key trendline support
Target Zone:
TP1: 94.00
TP2: 93.80
The overall higher timeframe trend remains bullish, but short-term price action suggests a possible pullback before continuation.
Waiting for confirmation around support and resistance levels may provide a clearer directional bias.
Risk management is essential in volatile market conditions.
USDINR outlook in the coming yearsThe INR may remain bearish over the coming years and could potentially reach the 112 level by January 2030. However, there is also a possibility of the INR strengthening toward the 90 mark against the USD before resuming its weakness, which may extend toward 133 against the USD over the longer term.
This analysis is purely based on my personal perspective, and various fundamental, geopolitical, and economic factors could significantly influence or alter this outlook.
Multi-Timeframe Elliott Wave Map for USDINRHello friends, Welcome to RK_Chaarts,
Today we’re trying to explain & analyze the USDINR currency pair from an Elliott Wave perspective for Educational purpose only.
On the quarterly timeframe, at the Cycle degree, the red Wave III (red) appears to be nearing completion. After this, we can expect a red Wave IV (red) meaning a small to moderate downfall may follow. What we’re seeing now is likely the final leg of that IIIrd wave. Within this Cycle Wave III, on the monthly timeframe at the Primary degree, we have five clear subdivisions labeled in black. We can clearly see that black ((1)), ((2)), ((3)), and ((4)) are complete, and ((5)) (black) is now also nearing completion. Within that ((5))th wave, on the weekly timeframe at the Intermediate degree, we’ve drawn five subdivisions in blue brackets. On the weekly chart, it’s quite clear that within Wave ((5)), waves (1) and (2) are complete, and Wave (3) is nearing completion. After that, we may see a Wave (4), followed by Wave (5), and only then will the higher degree wave finish.
Similarly, within that Intermediate Wave (3) (blue), the subdivisions at the Minor degree (red) 1, 2, 3, 4, 5 are expected. On the daily timeframe chart on the right, we can clearly see that red 1, 2, 3, and 4 are complete, and red 5 is also nearing completion.
Going to an even lower timeframe, within that 5th wave, waves ((i)), ((ii)), ((iii)), and ((iv)) are complete, and wave ((v)) Minute degree (black) is also nearing completion. If we check smaller timeframes, we’ll likely see bearish divergences forming as well. So this entire wave labeling is drawn in alignment with Elliott Wave principles and rules. As we know, Elliott Wave patterns are repetitive in nature and the market tends to follow them. Let’s see if that plays out here. We’ll watch how the market unfolds from this point. This analysis is based purely on Elliott Wave theory, structure, wave counts, rules, and principles. I’ve shared a dual-timeframe snapshot with you all here. I hope this explanation helps you understand it better for educational or study purposes.
I am not Sebi registered analyst.
My studies are for educational purpose only.
Please Consult your financial advisor before trading or investing.
I am not responsible for any kinds of your profits and your losses.
Most investors treat trading as a hobby because they have a full-time job doing something else.
However, If you treat trading like a business, it will pay you like a business.
If you treat like a hobby, hobbies don't pay, they cost you...!
Hope this post is helpful to community
Thanks
RK💕
Disclaimer and Risk Warning.
The analysis and discussion provided on in.tradingview.com is intended for educational purposes only and should not be relied upon for trading decisions. RK_Chaarts is not an investment adviser and the information provided here should not be taken as professional investment advice. Before buying or selling any investments, securities, or precious metals, it is recommended that you conduct your own due diligence. RK_Chaarts does not share in your profits and will not take responsibility for any losses you may incur. So Please Consult your financial advisor before trading or investing.
USDINR: The Blow-off Top? Reversal Targets suggest 90.00 ...can be met where it might stall out, before even further Indian rupee strength into the second half of the year.
The Vision
After an aggressive rally fueled by geopolitical tension and oil volatility, USDINR appears to have found a definitive ceiling at the 95.22 mark. The price action is now showing clear signs of exhaustion, breaking below the immediate support of 93.75 and heading toward a potential structural shift. With the RBI intensifying its intervention to curb speculation, the path of least resistance has finally shifted southward.
Technical Breakdown
The chart highlights a projected "descending stair-case" move:
The Rejection: Sharp sell-off from the all-time high (ATH) zone, forming what looks like a broad "Head and Shoulders" or a failed breakout.
Immediate Target (Support 1): ₹91.00 — A high-liquidity zone that previously acted as resistance.
Secondary Target (Support 2): ₹89.78 — The base of the current 2026 bull run.
Final Mean Reversion: ₹87.97 — The long-term value area.
Fundamental Headwinds
RBI Intervention: The central bank has capped net open positions at $100M, effectively squeezing out the dollar bulls.
Bond Yield Surge: Rising Indian yields are making the Rupee more attractive for carry trades, putting downward pressure on the USD/INR pair.
Policy Pivot: All eyes are on tomorrow's (April 8) RBI policy announcement. A hawkish stance could be the final nail for this USD rally.
Possible Trading Plan: a sell-on-rise opportunities near 93.20 - 93.40, with a stop-loss above the recent swing high of 94.50.
What’s your take?
Do you think the RBI can hold it below 93, or will the "Hormuz Deadline" tonight spark one last spike?
#USDINR
#Forex
#TechnicalAnalysis
#PriceAction
#TradingView
#Nifty
#StockMarketIndia
#RBI
#IndianEconomy
USDINR Trading ChartsHere is the unvarnished truth about what TradingView can do, the exact tickers you need, and how to build synthetic proxies for the data they lock behind Wall Street paywalls.
### **The TradingView Tickers You Need**
**1. The DXY (Dollar Index)**
* **Ticker:** `DXY` (or `TVC:DXY`)
* **Setup:** Just type DXY into the search bar. This is your standard baseline for dollar strength.
**2. The MOVE Index (Bond Market Volatility)**
* **Ticker:** `TVC:MOVE`
* **Setup:** This tracks the ICE BofA U.S. Bond Market Option Volatility Estimate. This is your primary panic gauge. Set a horizontal line on the chart at **150** so you know visually when to expect Fed intervention.
**3. USDINR (High, Low, Close)**
* **Ticker:** `FX_IDC:USDINR` (or `OANDA:USDINR`)
* **Setup:** Open the chart. To get the High, Low, and Close automatically mapped on your screen, click on the **"Indicators"** tab at the top and search for **"Daily High/Low"**. Add it to the chart. It will plot horizontal lines showing the exact day's high, low, and closing levels dynamically.
---
### **The Institutional "Workarounds" (The Missing Links)**
TradingView is a phenomenal tool, but it does not have the licensing rights to stream proprietary Bloomberg Terminal data or OTC institutional swaps. Here is how you build the proxies:
**4. Bloomberg U.S. Gov. Securities Liquidity Index**
* **The Problem:** This is owned by Bloomberg (`GOVSQYZ Cmdty`). You cannot chart this exact index on TradingView.
* **The TradingView Proxy:** Use the **TLT Implied Volatility** or the Bid-Ask spread of short-term Treasury ETFs.
* **How to chart it:** Type `CBOE:VXTLT`. This is the Cboe 20+ Year Treasury Bond ETF Volatility Index. It is the absolute closest proxy on TradingView to track how thin and dangerous the Treasury order book is getting. When `VXTLT` spikes, the Bloomberg Liquidity Index is breaching your 3.0 threshold.
**5. Cross-Currency Basis Swaps (EUR/USD)**
* **The Problem:** Basis swaps are traded over-the-counter (OTC) directly between global banks. It is not exchange-traded data.
* **The TradingView Proxy:** You can chart the *Interest Rate Differential* as a synthetic proxy for offshore dollar stress.
* **How to chart it:** In the ticker search bar, you can use TradingView's math functions. Type: `US03MY - DE03MY`
* *What this does:* It subtracts the German 3-Month yield from the U.S. 3-Month yield. If this spread blows out violently, it perfectly mirrors the offshore scramble for dollars that we track in the basis swap market.
Chart 6: Charting the EFP Premium (The Panic Indicator)
This is the most critical chart. It will show you exactly how much of a premium European desks are demanding over the New York paper price. When this line spikes, the short squeeze is mechanically accelerating.
Open a new chart in TradingView.
Click on the Symbol Search box in the top left corner.
Type the following exact formula into the search bar:
XAGUSD - SI1!
Press Enter.
What this does: * XAGUSD is the global London Spot Silver price (the physical reality).
SI1! is the continuous front-month COMEX Silver Futures contract (the paper price).
By typing the minus sign, TradingView automatically calculates the spread between them second-by-second.
How to read it: If this line is sitting near $0.02 to $0.05, the market is normal. If you see this line violently spike above $0.20, $0.50, or even $1.00+, it means the COMEX shorts are trapped and institutions are scrambling for physical delivery.
USD/INR 2026: Forces Reshaping the RupeeThe USD/INR exchange rate sits at approximately ₹92.6 today, up roughly 3% year-to-date. Behind that number lies a collision of geopolitical shocks, monetary innovation, technological disruption, and a quiet but seismic shift in how India values hard assets. This article dissects every layer.
Macroeconomic Backdrop: The Rate Differential Problem
India's RBI cut its benchmark repo rate to 6.00% in April 2026, while the U.S. Federal Reserve holds the federal funds rate at 4.25–4.50%. That 175–200 basis-point differential persistently favors dollar-denominated assets. Foreign institutional investors rotate capital toward higher-yielding dollar assets during uncertainty, mechanically weakening the rupee. Imports of crude oil and electronics structurally drive India's current-account deficit, adding a second layer of persistent INR demand weakness. Until India narrows that gap through export acceleration or import substitution, upward USD/INR pressure remains a gravitational constant.
Geopolitics: The Iran War Premium
The rupee's most acute 2026 pressure point is the Iran conflict. India sources roughly 15–18% of its crude from Gulf suppliers, and the Iran war has elevated Brent crude to above $90/barrel. Every $10 rise in oil costs India approximately $12–15 billion in additional annual import expenditure. The RBI responded by restricting speculative forward transactions and barring corporates from rebooking cancelled FX contracts. Those emergency measures stabilized USD/INR near ₹93 but revealed how thin India's foreign-exchange reserve buffer has grown, declining by nearly $40 billion in just four weeks amid the market turbulence.
Geostrategy: De-Dollarization and the BRICS Dimension
India's long-term USD/INR trajectory links directly to the global de-dollarization debate. As a senior BRICS economy, India actively negotiates bilateral trade settlement in non-dollar currencies with Russia, Iran, and the UAE. The RBI's endorsement of silver as formal banking collateral, effective April 1, 2026, represents a structural step toward building a domestic credit architecture independent of dollar-denominated benchmarks. By enabling ₹2.5 lakh ($3,000) loans against physical silver at a 10:1 gold-silver collateral ratio, India reduces millions of households' need to rely on dollar-linked instruments. Over time, this domestic credit expansion could lower India's structural dollar demand, applying soft downward pressure on USD/INR.
Monetary Innovation: The RBI's Silver Play
The RBI's decision to accept silver jewelry and ornaments as loan collateral across banks and NBFCs represents the most consequential precious-metals policy of this decade. With India estimated to hold between 125,000 and 250,000 metric tons of privately held silver, the RBI has effectively "monetized" dormant household wealth without printing a single rupee. SEBI simultaneously mandated that gold and silver ETFs shift valuation from LBMA AM-fix pricing to domestic exchange-traded spot prices from April 1, 2026. This dual reform collateral expansion plus domestic-price anchoring — severs two legacy dependencies on London and New York benchmarks. For USD/INR, the implication is structural: India increasingly sets the price of its own hard assets in rupees, not dollars.
Industry Trends: Silver Demand Reshapes Import Dynamics
Silver's new monetary status intersects with India's industrial ambitions. India is the world's largest silver importer, absorbing 5,000–6,000 metric tons annually. Industrial consumption of solar photovoltaic cells, EV battery management systems, medical electronics, and defense components already absorbed roughly 60% of that volume before the RBI's collateral reform. If household silver now migrates into bank vaults as loan collateral rather than remaining liquid for resale, effective domestic supply tightens. Jewelers and small-scale fabricators will compete for a smaller float. Import demand rises. Silver purchases in dollars amplify the current-account deficit, adding marginal pressure on the rupee. Policymakers must balance financial-inclusion gains against import-cost consequences.
Technology and Fintech: Digital Rails Accelerating INR Velocity
India's UPI payment system now processes over 16 billion transactions per month, making the rupee one of the most digitally active currencies in the world. Fintech platforms PhonePe, Paytm, and Razorpay are increasingly offering FX-linked services such as cross-border remittances and multi-currency wallets. India receives over $120 billion annually in remittances, making it the world's top recipient. Each inflow represents structural dollar supply into the INR system, providing a natural hedge against the current-account deficit. The NPCI's expansion of UPI to Singapore, the UAE, France, and Mauritius now allows rupee-denominated settlement for overseas Indians, reducing the friction of dollar conversion and supporting long-run rupee liquidity.
Cybersecurity: FX Infrastructure Under Threat
India's currency infrastructure faces growing cyber risks. State-linked threat actors attributed to both Pakistan-based groups and Chinese APT clusters have targeted SWIFT-connected Indian banking nodes with increasing frequency in 2025–2026. A successful breach of interbank FX systems could trigger flash-crash volatility in USD/INR, as automated trading systems amplify thin-liquidity moves. The RBI's April 2026 crackdown on offshore derivative pricing discrepancies, which widened the gap between onshore and NDF (non-deliverable forward) markets, inadvertently created a secondary vulnerability: tighter NDF controls push speculative activity to less-regulated venues, which carry greater cyberexposure. Financial institutions must treat cyber resilience as a direct FX risk management imperative.
Business Models: IT Export Earnings and the Hedge Equation
India's IT sector, led by TCS, Infosys, Wipro, and HCLTech, generates approximately $250 billion annually in software and services exports, almost entirely in dollars. Every rupee of depreciation expands rupee-denominated revenue for these firms, creating a powerful corporate lobby that benefits from a weaker INR. However, these same firms face the cost of hedging 12–18 months of dollar receivables. When USD/INR volatility spikes as it did in March 2026, when the rate touched ₹94.86, hedging premiums surge, squeezing margins for mid-cap IT exporters who lack the treasury infrastructure of Tier-1 firms. Volatility itself, not just direction, constitutes the primary FX business risk.
Management and Leadership: RBI's Credibility Test
RBI Governor Sanjay Malhotra faces a defining credibility test. His decision to restrict forward contract rebooking and cap banks' open FX positions demonstrates tactical agility. But currency defense through administrative controls carries a long-run cost: reduced hedging efficiency, wider bid-ask spreads, and capital-account uncertainty for foreign portfolio investors. The RBI's April 8, 2026, policy meeting, where markets priced a 25 bps rate cut, forces a textbook trilemma choice: defend the rupee, stimulate growth, or maintain financial openness. Malhotra's communication strategy, calm, data-driven, and forward-guided, has maintained institutional credibility. Markets reward that credibility with reduced speculative pressure, providing a soft floor under the rupee.
Science and High-Tech: India's Patent Pipeline as Currency Signal
India's patent output is an underappreciated long-run INR support signal. Indian patent filings at the USPTO grew 18% year-on-year in 2025, driven by semiconductors, green hydrogen, and pharmaceutical processes. ISRO's commercial launch successes and the PLI scheme's acceleration of domestic chip manufacturing reduce India's dependency on technology imports, structurally compressing the current-account deficit over a 5–10 year horizon. Every dollar India stops importing technology is a dollar it stops spending. That import substitution, if sustained, gradually reduces structural USD demand within India's balance of payments, applying long-term appreciation pressure on the rupee against the dollar.
Company Culture and Innovation: Domestic Champions Reduce FX Dependency
India's "Atmanirbhar Bharat" (self-reliant India) industrial policy has catalyzed a generation of domestic manufacturers. Tata Motors, Ola Electric, and Reliance's Jio platforms invest billions in import-substituting production. Tata's semiconductor joint venture with PSMC and the Foxconn iPhone manufacturing expansion reduce India's electronics import bill, currently the second-largest after crude oil. Corporate cultures that prioritize domestic supply chains over global sourcing directly reduce dollar demand. As India's manufacturing base matures, the structural forces driving rupee depreciation, energy and technology imports, begin to erode, providing a medium-term tailwind for INR.
Outlook: Three Scenarios for USD/INR by December 2026
Bull case for INR (₹87–89/USD): U.S.–India trade deal signed; Fed cuts rates twice; oil retreats below $75; RBI restores reserve buffer. Silver collateral reform stimulates rural credit without inflating imports.
Base case (₹92–94/USD): Current-account deficit persists; RBI holds rates steady; oil stabilizes near $85–90; IT export hedging demand keeps the pair rangebound. Administrative FX controls contain downside.
Bear case for INR (₹97–100/USD): Iran war escalates, closing Strait of Hormuz; FPI outflows accelerate; RBI forced to choose between rate hikes and rupee defense. Silver imports surge, widening the deficit.
INDIAN RUPEE Technical Analysis! Buy!
Hello,Traders!
USDINR is trading in a strong uptrend inside the rising parallel channel. We also see a strong violation of the channel to the UPSIDE which only reinforces the bullish bias . Right now the price is making an natural correction to the downside, and is likely to return into the channel and retest the demand cluster of the rising trendline and the horizontal demand level below around a strong round number of 92.00, establishing a new higher low , from where I am expecting a strong bullish continuation inside the well established rising channel. Time Frame 2D.
Buy!
Comment and subscribe to help us grow!
Check out other forecasts below too!
USD/INR Outlook: Navigating the Global Energy ShockThe Indian Rupee faces an unprecedented challenge. Crude oil prices now exceed $115 per barrel. This energy surge destabilizes the USD/INR exchange rate. Investors must prepare for significant currency volatility. Current forecasts suggest the Rupee will test new lows against the Dollar.
Geopolitics and Geostrategy: The Energy Trap
India imports over 80% of its crude oil requirements. The Iran war and the Strait of Hormuz closure threaten supply. This geopolitical crisis directly impacts India’s trade balance. Geostrategy now dictates currency strength more than domestic policy. A prolonged conflict ensures sustained pressure on the Rupee.
Macroeconomics: The Widening Deficit
Natixis analysts warn of a widening current account deficit. High energy costs inflate the import bill rapidly. This shift drains India’s foreign exchange reserves. The Reserve Bank of India faces a difficult balancing act. It must defend the currency without stifling industrial growth.
Industry Trends: Corporate Hedging Shifts
Volatility forces a change in corporate treasury behavior. Firms now abandon unhedged dollar exposures. We see a massive shift toward long-term currency derivatives. Industry leaders prioritize capital preservation over speculative gains. This trend increases the demand for the Greenback.
Management and Leadership: Decisive Action
CFOs must demonstrate assertive leadership during this crisis. They are redesigning business models to absorb higher input costs. Proactive management identifies currency risks before they impact the bottom line. Leadership now requires a deep understanding of global energy markets.
Technology and High-Tech: AI in Forex
High-tech trading platforms now dominate the currency markets. AI algorithms analyze geopolitical news in real-time to execute trades. These technologies increase market liquidity but also heighten volatility. Firms using advanced predictive analytics manage USD/INR risks more effectively. Technology remains the ultimate shield against market unpredictability.
Cybersecurity: Protecting Financial Flows
Cybersecurity threats rise as currency markets become more volatile. State-sponsored actors target financial institutions to disrupt capital flows. Protecting the integrity of the SWIFT system is vital. Banks invest heavily in encrypted communication to secure cross-border transactions. Digital security is now a fundamental component of currency stability.
Science and Patents: Long-Term Resilience
Patent analysis shows India’s pivot toward green energy. Science drives the development of hydrogen and solar technologies. These innovations aim to reduce long-term oil dependency. Patents in energy storage will eventually stabilize the Rupee. For now, however, fossil fuel reliance remains the primary currency driver.
Business Models: Adapting to Volatility
Exporters are re-evaluating their pricing strategies. They must offset rising domestic costs with higher international prices. Some firms explore Rupee-denominated trade to bypass Dollar fluctuations. This evolution in business models reflects a new global reality. Adaptation is the only way to survive a $100 oil environment.
Coinbase: Navigating Tech Innovation and Global RiskCoinbase recently reported a staggering $667 million loss for the final quarter. Despite missing several analyst targets, the stock surged as investors recognized an attractive entry point. Market experts remain divided on whether the company represents a bargain or a high-risk gamble.
The Technological Moat and Patent Strategy
Coinbase maintains its dominance through aggressive high-tech development and a robust patent portfolio. Patent analysis reveals a strategic focus on cryptographic security and automated clearing systems. These innovations streamline decentralized finance (DeFi) while protecting users from sophisticated cyber attacks.
The company invests heavily in "Base," its proprietary Layer 2 scaling solution. This technology demonstrates a science-driven approach to blockchain efficiency. By securing intellectual property in cross-chain communication, Coinbase builds a significant competitive moat against traditional financial institutions.
Geopolitics and the Cyber Security Frontier
Geostrategy plays a pivotal role in Coinbase’s current market fluctuations. Global security agencies recently identified cryptocurrency links to illicit financing networks in Africa and Asia. Reports suggest criminal organizations use digital assets for human trafficking and state-sponsored shadow banking.
Coinbase must navigate these treacherous waters with advanced cybersecurity protocols. Investigators currently monitor potential interference in global crypto-security frameworks by hostile state actors. The company’s ability to prevent illicit usage directly impacts its long-term viability and regulatory standing.
Macroeconomics and Business Model Evolution
High interest rates and persistent inflation continue to dampen retail trading volumes. To counter this, Coinbase is shifting its business model toward subscription and services revenue. This transition reduces dependence on volatile transaction fees during bearish economic cycles.
The company’s economic strategy emphasizes institutional adoption through its custody services. Providing secure storage for large-scale investors offers a stable revenue stream. This diversification helps the firm weather macroeconomic storms that sink smaller competitors.
Leadership, Culture, and Industry Trends
CEO Brian Armstrong maintains an assertive, pro-innovation culture within the organization. He frequently defends the industry against critics from traditional banking sectors. This leadership style attracts top-tier engineering talent but also invites intense regulatory scrutiny.
Recent advertising bans in international markets highlight the friction between crypto-innovation and traditional governance. Coinbase faces the challenge of maintaining its "disruptor" identity while satisfying global compliance standards. The firm's success depends on balancing bold leadership with institutional transparency.
USD/INR Strategy: Tech Volatility and Geopolitics
The USD/INR pair rose sharply as Indian IT stocks experienced a significant sell-off recently. Foreign investors are pulling capital, fearing further equity downside in the high-tech sector. This shift creates immediate pressure on the Rupee despite the central bank’s steady intervention.
Geopolitics and the Energy Pivot
Geopolitical tensions complicate the India-US trade relationship today. Current negotiations regarding tariff cuts remain stalled by a costly energy pivot. India’s transition to greener energy requires massive capital imports to succeed.
These high costs offset potential gains from trade deals. This imbalance weighs heavily on the currency pair. Geostrategy now dictates that energy independence is essential for currency stability.
IT Industry Trends and High-Tech Outflows
India’s IT sector serves as the primary gateway for foreign exchange. Recent declines in high-tech stock valuations signal a shift in global investor sentiment. Industry trends suggest a cooling demand for traditional outsourcing models.
Markets now favor companies that prioritize rapid AI integration. They also reward firms focused on intellectual property development. When IT stocks bleed, the Rupee loses its strongest structural support.
Science, Patents, and Cyber Security
Patent analysis shows a surge in Indian firms filing for decentralized security protocols. However, cybersecurity threats remain a critical risk for financial stability. Sophisticated attacks on payment gateways can trigger sudden currency volatility.
Strong technological moats are essential for maintaining a resilient national currency. Science-driven innovation in encryption helps protect the financial ecosystem. Without robust cyber defenses, foreign capital remains hesitant to stay.
Macroeconomics and Central Bank Leadership
Central bank leadership determines the Rupee’s long-term trajectory. The Reserve Bank of India manages volatility with assertive market interventions. Meanwhile, US macroeconomic strength keeps the Dollar dominant globally.
Management must balance inflation control with competitive export pricing. Leadership teams face diverging economic paths in a post-globalization world. This divergence fuels the current fluctuations in the USD/INR exchange rate.
Business Models and Corporate Culture
Innovative business models are emerging to hedge against currency fluctuations. Indian startups are increasingly adopting global-first cultures to attract international venture capital. This influx of foreign direct investment provides a necessary buffer for the Rupee.
Management teams now view currency risk as a core strategic pillar. Companies that innovate their internal culture often see higher retention of foreign investment. A culture of innovation stabilizes the broader economic environment.
USD/INR at 90: Can the RBI Halt the Rupee’s Slide in 2026?The Indian rupee stands at a historic crossroads. As 2025 concludes, the currency hovers precariously near the 90.00 psychological barrier. While the Reserve Bank of India (RBI) maintains a defensive posture, a combination of record capital flight and geopolitical friction creates a challenging environment for the year ahead.
Geopolitics and the Tariff Storm
Trade tensions between Washington and New Delhi have intensified throughout 2025. The re-imposition of tariffs climbing as high as 50% on key Indian exports has strained the bilateral trade balance. Major sectors like jewellery, automotive parts, and electronics now face shrinking margins and reduced global demand.
This protectionist environment discourages foreign direct investment (FDI). Investors remain cautious as they await a potential trade deal. Without a diplomatic breakthrough, the "tariff overhang" will continue to pressure the rupee toward weaker levels in early 2026.
Record Capital Flight: The FII Exodus
The year 2025 marked a historic turning point for Indian capital markets. Foreign Institutional Investors (FIIs) pulled a record ₹1.58 lakh crore ($18 billion) from Indian equities. High domestic valuations and rising US Treasury yields prompted this massive rotation of capital back toward developed markets.
While Domestic Institutional Investors (DIIs) provided a cushion through steady SIP inflows, they could not fully offset the currency impact. This exodus has effectively removed a primary source of dollar supply, leaving the rupee vulnerable to every spike in global volatility.
Management & Leadership: The RBI’s Defensive Play
The Reserve Bank of India has adopted a "controlled depreciation" strategy. RBI leadership intervened frequently near the 90.00 mark, selling dollars through state-run banks to prevent a chaotic collapse. This proactive management provides the market with a "tacit floor."
Traders now view the 90 level as a critical pivot point. The central bank's leadership must balance currency stability with the need to keep Indian exports competitive. If the RBI softens its stance, the path of least resistance leads toward 91.50 by mid-2026.
Macroeconomics: A Tale of Two Central Banks
The Federal Reserve and the RBI are navigating diverging paths. In December 2025, the Fed delivered its third consecutive interest rate cut to 3.5%–3.75%. However, hawkish language in the Fed minutes suggests a slower pace of cuts for 2026.
In contrast, the RBI’s recent 25 basis point cut aims to boost domestic growth (forecast at 7.3% for FY26). This narrowing interest rate differential often makes the rupee less attractive for "carry trades," further supporting a bullish USD/INR trend.
Indicator Current Status Impact on Rupee
Oil Prices $61.70 (Brent) Positive (Lower import costs)
US Tariffs Up to 50% Negative (Export pressure)
FPI Flows Record Outflow Negative (Dollar scarcity)
GDP Growth 7.3% (Projected) Positive (Long-term resilience)
Technology and the Future of Trade
Innovation in "Cyber-traceability" and blockchain-based supply chains is becoming vital for Indian exporters. These technologies help firms bypass some regulatory hurdles by proving compliance with global standards.
Patent analysis reveals that Indian firms are rapidly filing for high-tech manufacturing processes. This shift toward high-value, patent-protected exports could eventually reduce India's structural trade deficit. However, the currency benefits of these innovations will take years to materialise.
2026 Prediction: Consolidation Before Clarity
The USD/INR pair will likely consolidate between 89.50 and 91.00 in the first quarter of 2026. The "invisible hand" of the RBI will prevent a vertical spike, but the lack of foreign inflows remains a major hurdle.
Smart traders should watch for the signing of a US-India trade deal. A successful agreement would act as the ultimate "Buy" signal for the rupee, potentially triggering a sharp recovery toward the 88.00 handle.
Review and plan for 17th December 2025 Nifty future and banknifty future analysis and intraday plan.
This video is for information/education purpose only. you are 100% responsible for any actions you take by reading/viewing this post.
please consult your financial advisor before taking any action.
----Vinaykumar hiremath, CMT
Why Is The Rupee Falling When The Dollar Is Weak?The Indian Rupee (INR) is exhibiting a pronounced, sustained weakness against the US Dollar (USD), pushing the USD/INR pair toward the 88.60 level, even as the global US Dollar Index (DXY) shows signs of softness. This resilience in the USD/INR confirms that domestic and structural headwinds—rather than external dollar strength—are primarily responsible for the Rupee's depreciation. A deep analysis across strategic, economic, and technological domains reveals that geopolitical delays and cautious monetary policy abroad are significantly outweighing any temporary relief from global dollar flows.
The central source of this structural weakness stems from two major factors: geopolitical uncertainty and macroeconomic policy divergence. The persistent delay in finalizing a comprehensive trade agreement between the US and India fuels Foreign Institutional Investor (FII) anxiety, leading to hesitant capital inflows. While FIIs showed a brief surge in buying, overall conviction remains low without a clear trade resolution. Concurrently, the US Federal Reserve's commitment to a "higher-for-longer" interest rate floor, despite a recent cut, strengthens the relative appeal of the USD. This policy stance attracts global capital to US assets, thereby limiting liquidity and increasing the cost of holding the INR.
Furthermore, India’s technological landscape adds to the structural demand for the USD. Low domestic Research & Development (R&D) investment and a heavy reliance on foreign patents mean the nation must spend more USD to import essential high-tech equipment and intellectual property. This technological deficit creates a persistent, structural requirement for foreign currency, putting continuous pressure on the Rupee. From a technical analysis perspective, the USD/INR pair's decisive hold above the 20-day Exponential Moving Average (EMA) confirms the market's bullish bias, suggesting the current trend is robust and targeting the all-time high of 89.12.
In essence, the Rupee's struggle is a complex interplay of internal and external structural factors. Until a major trade deal is confirmed, capital inflows become more decisive, or India's technological import needs stabilize, the market will continue to favor the USD. Traders must recognize that the technical path of least resistance for the USD/INR is upward, driven by these fundamental geopolitical and economic asymmetries rather than temporary movements in the global dollar index.
INR has made a major top against USDFall of INR against the USD began in early 1970s, or perhaps late 1960s--we don't know for sure for lack of trading data. Since then, it has depreciated against the USD in crystal-clear 5 legs, or waves according to Elliott Wave Theory (EWT). To validate EWT, there occurred a gigantic gap of 9.23% in July 1991 where third wave is supposed to be--a hallmark of third waves. Furthermore, there's even a divergence between Price and Elliott Wave Oscillator (5/35 MACD) on the Monthly chart--typical of fifth waves.
So, what's next then? Considering the time frame of the entire price move till date, I would say that a bear wave of Supercycle degree has just ended and we are looking at a 10-15 year advance in Indian Rupee against the US Dollar . In support of my forecast, INR has just posted a beautiful, unambiguous 5-wave advance in the shape of an expanding diagonal--hallmark of first waves--from 87.972 to 83.7625.
If I'm right, price should retreat a bit toward the classic 61.8% level at 86.3396, and then fall hard--and I mean very hard, with a gap--toward the levels below 80, followed by another pause and a small retreat, and another fall, thereby completing a set of 5 distinct waves . Should price follow the path of my forecast to that point, we would have a definite confirmation on hand that a Supercycle bear wave has indeed ended.
The final target of this Supercycle bull wave of INR vs. USD? It's too early and too far ahead to hazard a guess, but as per EWT principles, it should be somewhere close to 44. Yes. 1$ = ₹44. I hope I live to see that day. It's going to take a while, till 2040 perhaps, but we'll get there alright.
Indian market cannot go bullish until RUPEE becomes strong !a lot of analysts saying Dollar is going to week vs rupees but seeing technical chart, dollar is traded above 50 EMA and never come to touch since October. currently Dollar completed Symmetrical Pattern showing any upcoming momentum may happen, either bullish or bearish is just could say after seeing breakout/breakdown this pattern. To gain strength in Rupee it is required to give USDINR 50EMA breakdown or bearish crossover. Till then the rupee will remain weak and Indian stock market also.
USD is facing a Trendline resistance Vs INRUSD is facing a trendline resistance Vs Indian Rupee. Support zone currently for USD is near 87.06 followed by 86.82. Below this level we have the Mother line support for USD. This mother line support is at 86.55. If that is broken by the slide in USD 86.36 or 86.13 levels. Final support for USD will be at 85.65 before it hits Father line at 85.02. Resistances for USD are at 87.41, 87.55 and 87.76 before it can hit all recent high of 87.97. Shadow of the candle right now for USD is negative. Huge volatility in USD on either sides can be expected as Trump Tariff announcements continue for few months.
Disclaimer: The above information is provided for educational purpose, analysis and paper trading only. Please don't treat this as a buy or sell recommendation for the stock or index. The Techno-Funda analysis is based on data that is more than 3 months old. Supports and Resistances are determined by historic past peaks and Valley in the chart. Many other indicators and patterns like EMA, RSI, MACD, Volumes, Fibonacci, parallel channel etc. use historic data which is 3 months or older cyclical points. There is no guarantee they will work in future as markets are highly volatile and swings in prices are also due to macro and micro factors based on actions taken by the company as well as region and global events. Equity investment is subject to risks. I or my clients or family members might have positions in the stocks that we mention in our educational posts. We will not be responsible for any Profit or loss that may occur due to any financial decision taken based on any data provided in this message. Do consult your investment advisor before taking any financial decisions. Stop losses should be an important part of any investment in equity.
USDINR Best sell signal you can find.The USDINR pair has been rising parabolically since the late September 2024 bottom. This rise has however most likely come to an end as the 1W RSI hit the top of its 16-year Resistance Zone.
This Zone has been holding since the October 2008 High and as you can see, it has offered 7 excellent sell signals. Most of those times, the rejection hit at least the 1W MA50 (blue trend-line), so if you are looking for a long-term short trade, you can consider this.
-------------------------------------------------------------------------------
** Please LIKE 👍, FOLLOW ✅, SHARE 🙌 and COMMENT ✍ if you enjoy this idea! Also share your ideas and charts in the comments section below! This is best way to keep it relevant, support us, keep the content here free and allow the idea to reach as many people as possible. **
-------------------------------------------------------------------------------
💸💸💸💸💸💸
👇 👇 👇 👇 👇 👇
INRUSD - Indian Rupee Collapse UPDATEMy initial post on INRUSD was back on Sept 2022 more than 2 years ago.
My update is more of the same going forward. INR will continue to collapse despite its nominal economic growth.
When the economy is very small relative to its population, the growth rate doesn't matter as if a major economy like the US has similar growth. It's like comparing apples to oranges. But I certainly understand how people can be misled. That's why I am trying to explain it to you here today.
USDINR The 2-year Rising Wedge is holding.The USDINR pair continues to respect the Rising Wedge that we mentioned more than 2 months ago (July 24, see chart below), giving us both excellent buy and sell signals:
This 2-year Rising Wedge pattern is approaching its top (Higher Highs trend-line) once more so we're preparing for a sell signal again. The confirmation to sell within this pattern is given when the 1W RSI breaks above its MA line (yellow trend-line).
Our Target is 83.7500.
-------------------------------------------------------------------------------
** Please LIKE 👍, FOLLOW ✅, SHARE 🙌 and COMMENT ✍ if you enjoy this idea! Also share your ideas and charts in the comments section below! This is best way to keep it relevant, support us, keep the content here free and allow the idea to reach as many people as possible. **
-------------------------------------------------------------------------------
💸💸💸💸💸💸
👇 👇 👇 👇 👇 👇
Can Inflation Shift the Fed’s Rate Path? This week’s inflation data could be decisive for traders as markets weigh whether the Fed will cut rates by 25 or 50 basis points. Last week’s jobs report did not sway the market from its current consensus.
The US economy added 142,000 jobs in August 2024, falling short of the expected 160,000, based on the latest NFP data. According to the CME FedWatch Tool, the likelihood of a 25-bps rate cut climbed to 73%, while expectations for a 50-bps cut dropped to 27%.
Attention now turns to inflation, with consumer prices expected to fall to 2.6%—the lowest since March 2021—and producer prices anticipated to rise 0.2% month-over-month.
Key USD pairs to watch this week include EUR/USD, with the ECB's upcoming interest rate decision in focus. Additionally, pairs impacted by inflation data releases from Mexico, Brazil, Russia, and India could see significant movement.
Year long wedge- Chart patterns dont tell the whole storyIndian Rupee is on year long wedge formation
But its not strictly a technical pattern because INR is in dirty float meaning Central Bank manages its levels. Therefore the chart does not reflect the market participants view
Can't trade this kinda managed chart patterns
USDINR Bullish break-out signalThe USDINR pair broke this week above Resistance 1 (83.700), the long lasting level since the week of March 18 and following a strong rebound on the 1W MA50 (blue trend-line), the break-out should technically lead higher.
The long-term pattern remains a Rising Wedge and we expect at least a symmetrical +1.29% Bullish Leg to price the Higher High, similar to the March High. Our Target is 84.000.
-------------------------------------------------------------------------------
** Please LIKE 👍, FOLLOW ✅, SHARE 🙌 and COMMENT ✍ if you enjoy this idea! Also share your ideas and charts in the comments section below! This is best way to keep it relevant, support us, keep the content here free and allow the idea to reach as many people as possible. **
-------------------------------------------------------------------------------
💸💸💸💸💸💸
👇 👇 👇 👇 👇 👇