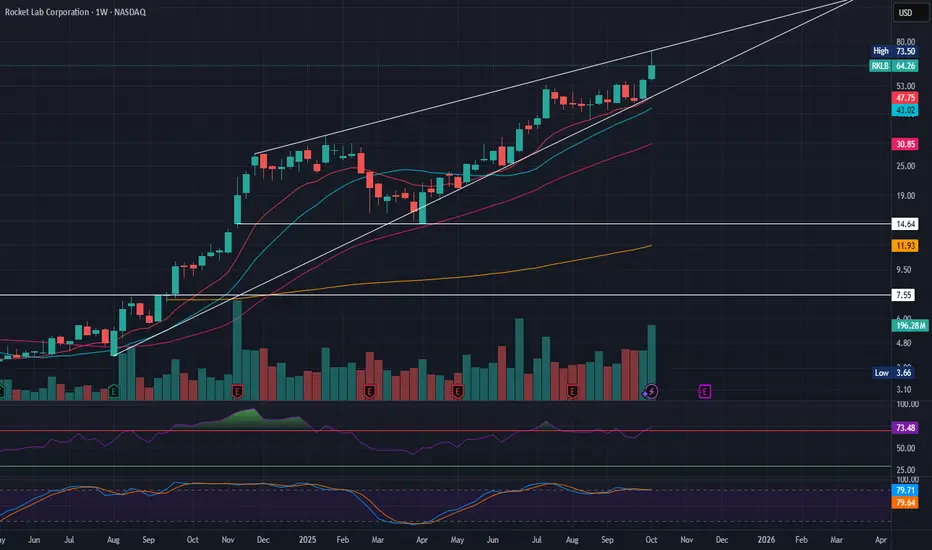
RKLB to peak $80-90 in Q4'25 or Q1'26. Trim gains. Buy in 2026.All good things must come to an end, and well... I think we're coming to the end here.
There's a lot I could write about how great this company is, but the stock chart says all that needs to be said.
THE UPSIDE
The rising wedge ends in the next quarter or two. I think there's still room for ~some~ upside with the upcoming SDA award Rocket Lab could win. There's also potential for broader NASA / general space news.
THE DOWNSIDE
I do not think that investors understand the company, and they will not like what they see when Neutron launches / gets delayed / has issues (practically inevitable for RKLB). Most revenues come from satellites, so maybe it's a non-issue. However, Neutron could change that math, but that's years away at best.
THE CONCLUSION
It's about time to lock in some gains in the $70-90 range IMO, and to look to buy the stock back in 2026.
Wedge
EURUSD 4H – Testing Major Holding Zone FX:EURUSD
Price has followed a clean descending channel, rejecting from the top resistance zone.
Current candles are reacting inside the yellow holding zone, which aligns with previous accumulation structure.
A potential W-formation could build here if bulls defend this level — otherwise, the next demand layer waits lower.
Market Overview
EURUSD has reached a critical zone after an extended bearish leg. Liquidity beneath equal lows has been swept, suggesting smart-money absorption before a possible reversal. If the market holds above the 1.15 region, buyers could step in for a corrective rally toward mid-channel levels. However, if the zone fails, price may dip toward the deeper support box before a larger bullish correction begins.
Key Scenarios
✅ Bullish Case 🚀 → 🎯 Target 1: 1.1620 | 🎯 Target 2: 1.1720 | 🎯 Target 3: 1.1860
❌ Bearish Case 📉 → 🎯 Target 1: 1.1490 | 🎯 Target 2: 1.1420 (deeper support zone)
Current Levels to Watch
Resistance 🔴: 1.1620 – 1.1720
Support 🟢: 1.1500 – 1.1420
⚠️ Disclaimer: This analysis is for educational purposes only. It is not financial advice.

Euro may Break the 1.1550 Support LevelHello traders, I want share with you my opinion about Euro. The dominant market pressure for the Euro has been bearish since the price failed to sustain its rally to the 1.1920 high. This reversal initiated a significant downward trend for EURUSD, characterised by the breakdown of several key market structures, including the prior upward channel and the major 1.1740 resistance level. Currently, this bearish impulse has brought the price down to the major horizontal support level at 1.1550, an area which also coincides with a historical buyer zone. The price is now in a consolidation phase, attempting a minor corrective bounce from this support. In my mind, this bounce appears weak and lacks the momentum to signal a true reversal. I expect that this small upward movement will fail to attract significant buying interest and will soon be overcome by the prevailing selling pressure. I think a failure of this bounce will lead to a decisive breakdown below the 1.1550 support level. Therefore, I have placed my TP at 1.1510, targeting a new structural low in what I believe is a continuation of the primary downward trend. Please share this idea with your friends and click Boost 🚀
Disclaimer: As part of ThinkMarkets’ Influencer Program, I am sponsored to share and publish their charts in my analysis.

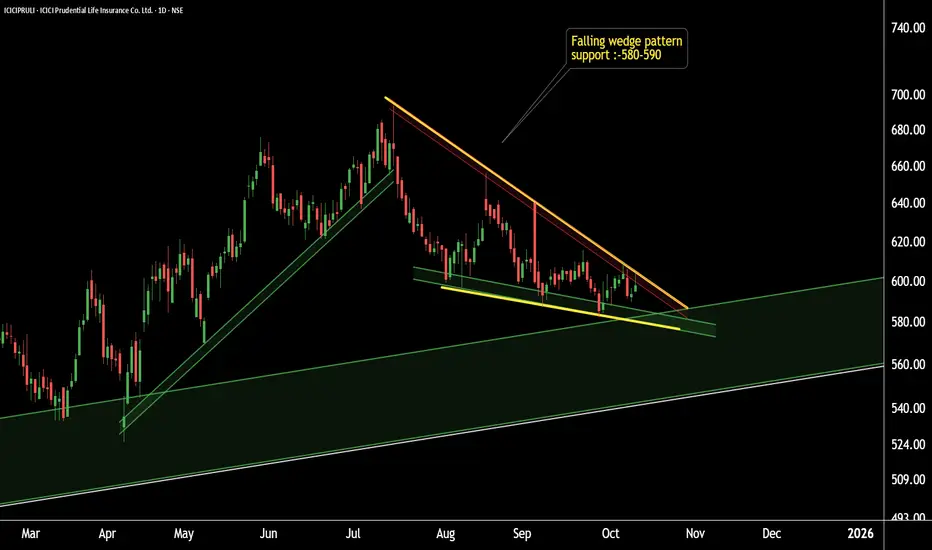
ICICIPRULI – Hidden Pattern Unlocked! Reversal or Continuation?ICICIPRULI Pattern Reveal
This is the daily timeframe chart of ICICIPRULI.
The stock is forming a falling wedge pattern, which is a bullish reversal setup.
Currently, ICICIPRULI is holding strong support near the 580–590 zone based on pattern structure.
If this level sustains, we may see higher prices in the coming sessions.
Thank You !!
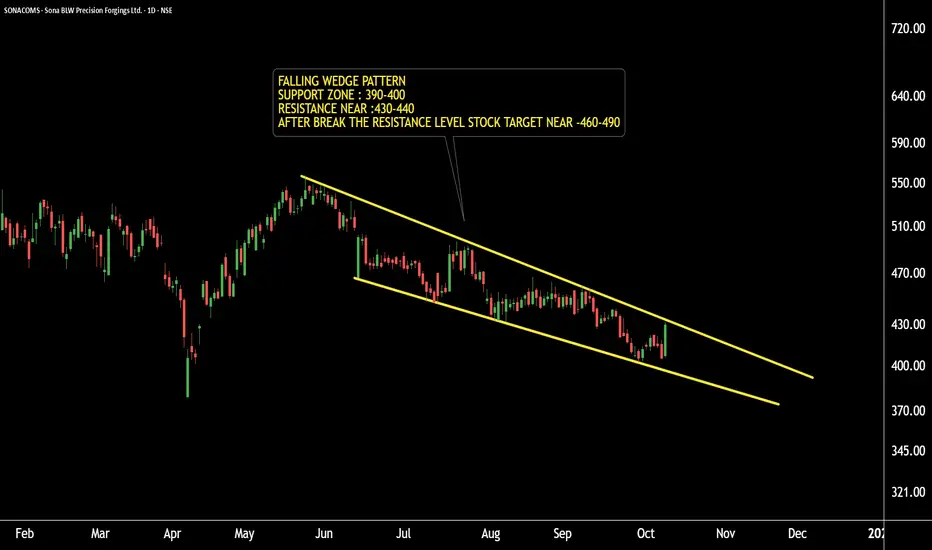
SONACOMS Technical Setup – Pattern Formation AlertSONACOMS – Falling Wedge Pattern Formation
Timeframe: Daily Chart
SONACOMS is forming a Falling Wedge pattern, which is a bullish reversal pattern in a bearish market phase.
The support zone is placed around ₹390–₹400 levels.
The resistance level is around ₹430.
A breakout above ₹430 may lead to pattern targets near ₹460 and ₹490.
If the support zone holds, we may witness higher prices in SONACOMS in the coming sessions.
Conclusion: Watch for a breakout confirmation for potential upside momentum.
Thank you !!
USDCHF – A Slow Mover Showing Big Signs of ReversalAlthough USDCHF is not the most volatile pair out there, it has been on my radar lately — especially after printing a low near 0.78, a level unseen since 2011.
Since June, the overall price action has been suggesting that we are approaching a major bottom. As shown on the daily chart, a falling wedge has developed over the past four months — a pattern that typically signals the end of a downtrend.
If we look closer, there’s even an argument for an inverted Head & Shoulders, with a descending neckline connecting the previous lower highs.
After the latest dip to 0.78, the pair bounced strongly, touched the neckline, and then consolidated for a few sessions — forming what looks like the right shoulder with a higher low structure.
Yesterday, USDCHF finally broke above the falling trendline, confirming the breakout. At this point, the odds favour a medium-term reversal.
• 🎯 First target: 0.8170 zone
• 🚀 Medium-term target: 0.83 area
That being said, my plan is simple:
→ Buy dips near 0.80 or slightly under, aiming for a 1:3 risk-to-reward setup.
The structure looks strong, the momentum shift is visible, and the timing couldn’t be better for a potential reversal.

EURUSD Bullish Trade SetupTrend: Bearish
Divergence Bullish: None
Reversal Pattern: Falling Wedge
Bias: Bullish
Scenario: Buy Stop at wedge breakout
Trade Plan
Stop Loss : 1.15925
Entry Level: 1.165
TP: 1.1708

USDJPY 4H – Reaching Psychological Correction Zone FX:USDJPY
Structure | Trend | Key Reaction Zones
Market surged with a parabolic bullish leg, now testing a major correction area (152.900–153.000).
Gap previously filled, price extended impulsively toward the psychological resistance zone.
Watching the decision area near 152.500 for possible retracement or continuation.
Market Overview
USDJPY has been on an aggressive bullish streak, pushing into a key resistance zone near 153.00 — a historically sensitive level where previous reversals occurred. While the dollar strength continues, exhaustion signs may appear as liquidity builds near the highs. A short-term pullback to 151.500–151.000 could set the stage for the next directional move.
Key Scenarios
✅ Bullish Case 🚀 → Break & close above 153.00 → 🎯 Target 154.200 → 🎯 Target 155.000
❌ Bearish Case 📉 → Rejection from 153.00 → 🎯 Target 151.500 → 🎯 Target 150.200
Current Levels to Watch
Resistance 🔴: 153.000 / 154.200
Support 🟢: 151.500 / 150.200
⚠️ Disclaimer: This analysis is for educational purposes only. Not financial advice.

BTCUSD 30m – Bullish Continuation ExpectedBITSTAMP:BTCUSD
Structure | Trend | Key Reaction Zones
Price formed a strong base at 120,800, bouncing from the demand zone.
Accumulation structure confirmed, with multiple liquidity grabs before breaking the descending trendline.
Currently retesting breakout — bullish continuation likely if price holds above 123,200.
Market Overview
BTC has successfully broken out from a short-term bearish channel after sweeping liquidity from the lower side. The demand zone between 120,800–121,200 provided a solid foundation for buyers, signaling fresh momentum. Now retesting the broken trendline, and if held, we could see a continuation toward the upper supply zone.
Key Scenarios
✅ Bullish Case 🚀 → Bounce from 123,200 → 🎯 Target 124,500 → 🎯 Target 125,700 → 🎯 Target 126,200
❌ Bearish Case 📉 → Break below 122,000 → 🎯 Target 121,000 → 🎯 Target 120,000
Current Levels to Watch
Resistance 🔴: 124,500 / 125,700
Support 🟢: 123,200 / 121,800
⚠️ Disclaimer: This analysis is for educational purposes only. Not financial advice.

SILVER (XAGUSD) – 15M | Strong Support Holding, Bullish ContinuTVC:SILVER
Market Overview
Silver took a quick rejection from the 48.70 resistance zone and corrected downward into the major support.
Price is now consolidating around 47.50, a key level that previously sparked bullish impulses.
If this level holds, momentum may shift again toward the upper range — signaling a potential bullish continuation phase.
Key Scenarios
✅ Bullish Case 🚀 →
🎯 Target 1: 47.80
🎯 Target 2: 48.23
🎯 Target 3: 48.70 (resistance retest)
❌ Bearish Case 📉 →
Invalidation if price closes below 47.30 (support breakdown).
Current Levels to Watch
Resistance 🔴: 48.23 / 48.70
Support 🟢: 47.40 / 47.50
⚠️ Disclaimer: This analysis is for educational purposes only. Not financial advice.

EURUSD – 1H | Rejection from Support Zone, Bullish Correction FX:EURUSD
Market Overview
EURUSD is currently reacting strongly from a well-defined demand/support base, following an extended downside leg.
The lower trendline and psychological support are holding firm, indicating potential for a corrective bullish leg towards the mid-range resistance zone if price sustains above 1.1650.
Key Scenarios
✅ Bullish Case 🚀 →
🎯 Target 1: 1.1683
🎯 Target 2: 1.1713
🎯 Target 3: 1.1778 (major rejection zone retest)
❌ Bearish Case 📉 →
Invalidation below 1.1640 (clean break under support).
Current Levels to Watch
Resistance 🔴: 1.1713 / 1.1778
Support 🟢: 1.1645 / 1.1660
⚠️ Disclaimer: This analysis is for educational purposes only. Not financial advice.

EURUSD: Reversal from the Lows and Up MoveHello everyone, here is my breakdown of the current Euro setup.
Market Analysis
From a broader perspective, the price of EURUSD has shifted into a bearish phase after a prior Upward Channel failed and broke down. This reversal led to the formation of the current Downward Wedge, a pattern that has been guiding the price lower.
Currently, the price is at a critical decision point. After a complex series of moves, it is now testing the lower support line of the wedge, which aligns with the major Support at the 1.1615 level.
My Scenario & Strategy
My scenario is built on the idea of a 'fake breakdown' at this key support. I'm looking for the price to dip briefly below the wedge's support line into the Support zone to hunt for liquidity, and then quickly reverse.
A swift reclaim of the wedge's interior would be a powerful signal that sellers are exhausted and a bullish reversal is underway. This is the key confirmation I am waiting for.
Therefore, the strategy is to watch for this reclaim. A successful reversal would validate the long scenario. The primary target for the subsequent rally is the Wedge Resistance Line at the 1.1670.
That's the setup I'm tracking. Thank you for your attention, and always manage your risk.

Darvas Box StrategyDarvas Box Strategy
Price Broke upper Resistance, and turned into Support
Price continuation Upwards
Nice look opportunity to long
.53 CENT Next Resistance

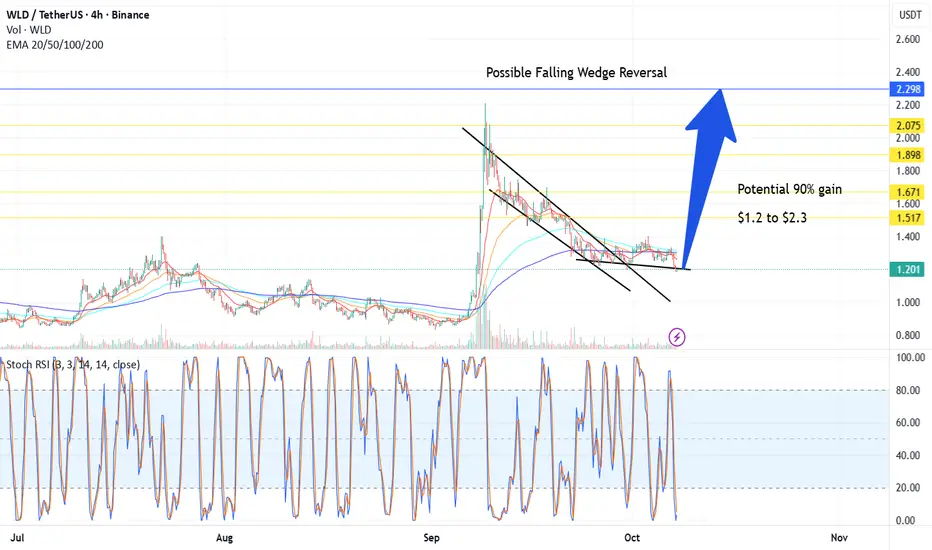
Possible Falling Wedge Reversal +90% run – 4H Setup - Worldcoin BINANCE:WLDUSDT could gain 90%
⚙️ Setup
Price has been trending down within a well-defined falling wedge since the local high.
Currently, it’s testing the lower trendline with Stochastics oversold and curving up, suggesting waning bearish momentum.
Volume has compressed, which is typical before a breakout.
We’re now at a decision point: either a bounce and breakout or a confirmed wedge failure.
Stochastics: Oversold (<20) with a possible bullish cross forming.
Volume: Decreasing — consistent with the final stages of compression.
EMAs: Price hovering around/under short EMAs (20–50); a close above them could trigger momentum shift.
📈 Plan / Hypothesis
Watching for bullish breakout confirmation above the upper trendline with increased volume.
Target: Height of the wedge projected upward (~ from breakout point).
Invalidation: 4H candle close below the lower trendline with volume expansion.
💭 Fundamenteal Thought:
We may or may not like Altman or Worldcoin's course of action to learn how to validate humanness, but the thing is, it's the only exposure we have to OpenAI and ChatGPT, and with AI everywhere, we are gonna need more than ever to validate people being real.
Considering Open AI, the disease, being worth $500 Billion, I think that the potential cure that Altman himself fabricated, Worldcoin, having a market cap of less than $3 Billion is pretty cheap. There's still many token to airdrop.
Anyhow, it all depends on what utility the token ends up delivering, I see that if this token is used to validate humanness, this will be really valuable. And ofc of what competitors do.
GBPUSD – 30M | Testing Support Zone, Bullish Bounce ExpectedFX:GBPUSD
Market Overview
GBPUSD is consolidating within a tight structure after a strong sell-off.
The pair is currently testing a major support base where buyers previously defended aggressively.
If price maintains above this zone, we may see a bullish recovery leg toward mid and upper ranges.
Key Scenarios
✅ Bullish Case 🚀 →
🎯 Target 1: 1.3451 (mid-range)
🎯 Target 2: 1.3485 (rejection zone retest)
🎯 Target 3: 1.3510 (extended liquidity reach)
❌ Bearish Case 📉 →
Invalidation below 1.3390 (if support fails to hold).
Current Levels to Watch
Resistance 🔴: 1.3451 / 1.3485
Support 🟢: 1.3400 / 1.3410
⚠️ Disclaimer: This analysis is for educational purposes only. Not financial advice.

ABT can potentially 4x in value reading up from the wedge its inThe smaller pink dotted measured move line is for the inv h&s pattern its formed inside the wedge with the top trendline of the wedge doubling as the invh&s pattern’s neckline. Hitting that smaller target is more or less a 2x from current price action. If we hit the full falling wedge target that’s a 4x from where it is currently. *not financial advice*
XAUUSD – 1H Correction From Rejection ZoneOANDA:XAUUSD
Market Trend | Structure | Reaction Zone
Gold remains bullish overall, but after testing the channel top near $3,985–$3,990, price shows clear rejection candles and slowing momentum. A short-term correction is now likely before the next impulse leg.
Market Scenario
📉 If bearish confirmation holds below the rejection zone, expect a corrective pullback toward demand.
This would allow price to retest structure supports before any continuation toward new highs.
Key Targets (Correction Move)
🎯 Target 1: $3,950–$3,945 → Demand retest zone (300–400 pips)
🎯 Target 2: $3,930–$3,925 → Trendline support zone (600–700 pips)
🎯 Target 3: $3,900–$3,895 → Mid-support area (900–1,100 pips)
Invalidation Zone
❌ Close above $3,995–$4,000 cancels correction setup — continuation to new highs likely.
⚠️ Disclaimer: Educational purpose only. Not financial advice.

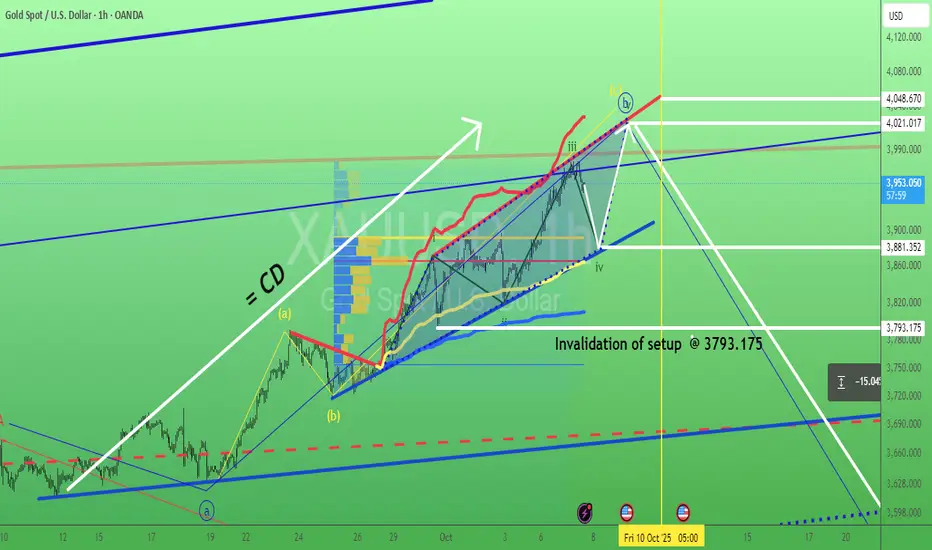
Gold intraday overview. 7/Oct/25XAUUSD short term swing setup. A rising wedge/ Expanding Ending Diagonal pattern. 3880 +/- is confluence zone of 1) VWAP (yellow MA ) support 2) Volume Profile's ( POC ) Horizontal Red Line.
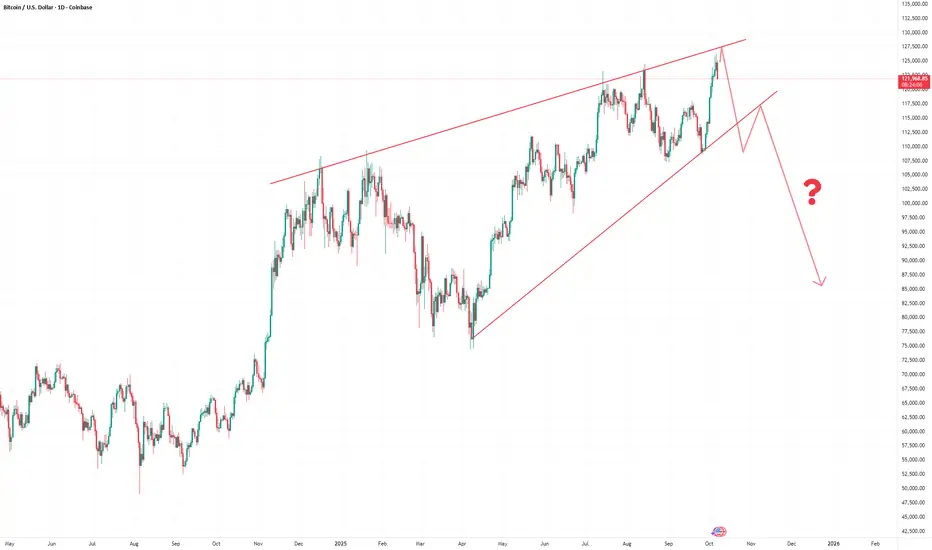
Despite ATH, Bitcoin is not looking solidCOINBASE:BTCUSD hit it's all time high above 126000 yesterday and yet, when you look at the structure of #BTCUSD, it doesn't inspire confidence. It looks like a huge rising wedge with bearish implications. And if this structure is going to play out then bitcoin is likely near it's top.
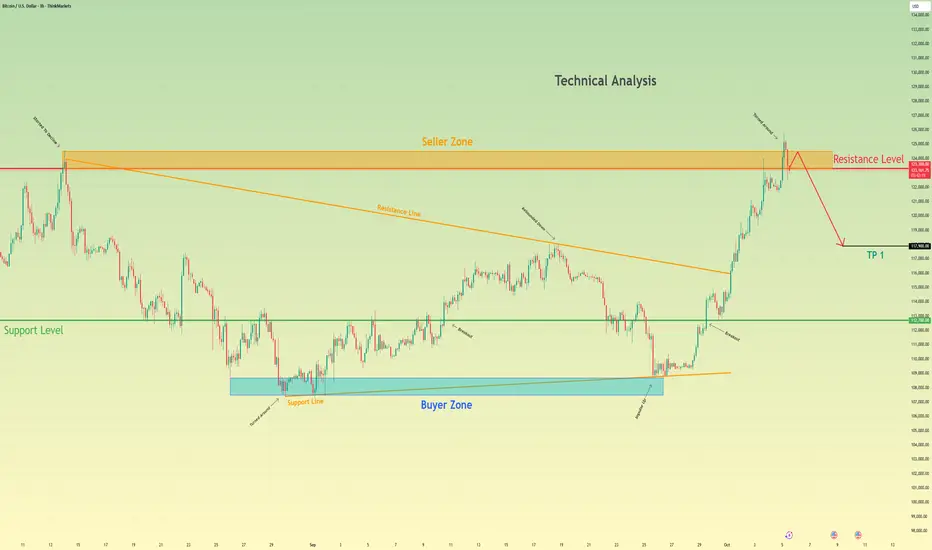
Bitcoin can Fail its Retest and Fall to 117900 pointsHello traders, I want share with you my opinion about Bitcoin. The market for Bitcoin has shown a significant sign of exhaustion and reversal after establishing a new all-time high at the 126000 level. Although this peak was preceded by a strong breakout from a prior downward wedge, the rally failed to sustain, leading to a sharp sell-off. This has shifted the market structure to a bearish bias, confirmed by a decisive breakdown below the key 123300 level. Currently, the price of BTC is in a minor corrective phase, rallying back towards this broken structure. This price action is setting up a classic retest of former support as new resistance. In my mind, this retest presents a high-probability opportunity for sellers. I expect that the price will make a small upward movement into the seller zone near 123300. I think a confirmed rejection from this area will validate the bearish reversal and trigger the next impulsive move downwards. Therefore, I have placed my TP at 117900, targeting a significant area of prior price action and liquidity. Please share this idea with your friends and click Boost 🚀
Disclaimer: As part of ThinkMarkets’ Influencer Program, I am sponsored to share and publish their charts in my analysis.
CROX BULLISH OCT 7 2025Crox is looking good here as price has a support from higher time frames. Price is also trying to narrow its range. I am long here . Do not blindly trade any thing
Always manage your risk & then trade

XAUUSD: At All Time High (ATH)XAUUSD have been surging high for this past months with high highs and higher lows, we are now anticipating it at 4000.gold have proven to be among the most valuable assets to purchase which can yield you profitably.
It is never late to take part in the run, it will be a way long run..
You have to believe in something
Like and follow up
Thanks for reading.

54% Spot Profit ARUSDT / Arweave coinEntry Point : 5.248
Partial-exit : 5.884
Take Profit: 6.65
Stop-Loss : 4.89
A partial exit in the range of 30% to 50% is under consideration and make it free.
