TRXUSD (daily)After the recent drop, price has retraced to the 0.382 Fibonacci level, forming what appears to be a wedge pattern. The PRZ (Potential Reversal Zone) also aligns with a strong support area for a potential bullish move. If price respects the pattern, there's room for upside. However, as always, this market tends to defy technical expectations.
Wedge

XAUUSD: Channel Breakout, Targets $4,290.Hi Traders,
XAUUSD. excellently fulfilled my previous review, and continues its upward rise in ascending trendline. in this structure we can clearly notice the resistance zones and also the channel breakout with a firm momentum of higher highs.
A little pullback might occur below $4199 setting the pair to a potential bullish at $4290-$4300 as the next ATH.
Share your thoughts on this review..
Thanks for reading.

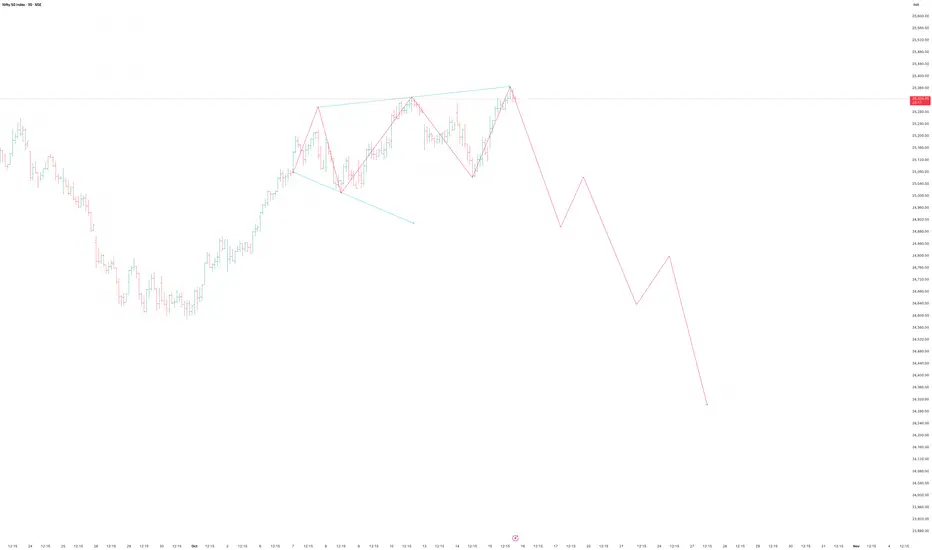
NIFTY Pattern analysis📈 Chart Structure Overview
The chart clearly shows a rising wedge formation — a bearish reversal pattern typically appearing at the end of a bullish rally.
✅ Summary View
Aspect Observation
Pattern Rising Wedge (Bearish)
Bias Short-term corrective / bearish
Key Resistance 25,380–25,420
Key Breakdown Zone 25,120
Targets 24,900 → 24,700 → 24,400
Stop-loss (for short) 25,450
Conclusion
Nifty’s price action suggests distribution and exhaustion at the top.
A confirmed breakdown below 25,120 could open up a short-term correction of 500–700 points.
Stay cautious of false breakouts above 25,400 unless backed by strong volume.
Disclaimer:
This analysis is for educational and technical insight purposes only.
Trading decisions should be based on your own confirmation strategy, volume validation, and risk management.
EURUSD – Triple Top Zone Formed | Correction Expected Before FX:EURUSD
📊 📉
Market Overview
EURUSD continues to respect its ascending structure but is currently struggling to break above the top resistance, forming equal highs — a liquidity trap area.
A clean rejection here could drive price toward the 1.1620–1.1610 demand base before the next bullish impulse.
Buyers are expected to re-enter at this region to continue the broader bullish leg.
Key Scenarios
✅ Bullish Case 🚀 → After correction to 1.1620–1.1610, expect move toward 🎯 1.1650 | 🎯 1.1680
❌ Bearish Case 📉 → Break below 1.1600 may shift structure toward 1.1560 zone
Current Levels to Watch
Resistance 🔴 1.1645 – 1.1650
Support 🟢 1.1620 – 1.1600
⚠️ Disclaimer: This analysis is for educational purposes only. Not financial advice

GOLD (XAUUSD) – Decision Zone Ahead | Bulls Holding DemandTVC:GOLD
Market Overview
Gold has shown repeated rejections from the demand base, confirming aggressive buyer interest.
Every retest of the yellow box created higher lows, showing accumulation before a potential expansion toward new highs.
If bulls hold above 4 200, continuation toward the 4 228–4 235 zone (previous all-time-high region) is expected.
Key Scenarios
✅ Bullish Case 🚀 → 🎯 Target 1 4 218 | 🎯 Target 2 4 230 | 🎯 Target 3 4 240
❌ Bearish Case 📉 → Rejection from decision zone → Retest of 4 185 then 4 165
Current Levels to Watch
Resistance 🔴 4 218 – 4 230
Support 🟢 4 185 – 4 165
⚠️ Disclaimer: This analysis is for educational purposes only. Not financial advice.

EURUSD Short: Trend Continuation After BreakdownHello, traders! The prior market structure for EURUSD has shifted to a bearish bias following a major reversal from the supply 2 level near 1.1835. The failure of a prior ascending channel initiated a new downtrend, which has been guiding the price auction lower through a series of complex breakdowns and consolidations.
Currently, the price action has shown significant weakness by breaking below the key horizontal support at the 1.1580 level. After multiple failed attempts by buyers to hold this level, sellers have successfully pushed the price below this critical area. The auction is now in a corrective pullback, approaching this broken support level from below for a classic retest.
My scenario for the development of events is a continuation of the downtrend. I believe this rally is a corrective retest that will fail upon reaching the 1.1580 level, which should now act as strong resistance. In my opinion, a confirmed rejection from this area will validate the bearish control and trigger the next impulsive move down. The take-profit is therefore set at 1.1510. Manage your risk.

EURUSD: Down Trend will Continue in ChannelHello everyone, here is my breakdown of the current Euro setup.
Market Analysis
EURUSD has shifted to a bearish structure. This happened after a 'fake breakout' to a new All-Time High was aggressively sold off, leading to a sharp reversal. This sell-off has since been contained within a well-defined Downward Channel, creating a series of lower highs and lower lows.
Currently, the price is in a corrective rally phase. After finding support near the 1.1550 level, the price has bounced and is now directly testing the descending resistance line of this channel. This is a critical area where the dominant downtrend could resume.
My Scenario & Strategy
I'm looking for the price to complete this corrective rally, possibly with one small final push higher, and then show a clear sign of rejection from the resistance line. This failure to break out would be the key signal that sellers are stepping back in.
Therefore, the strategy is to watch for this rejection. A confirmed reversal would validate the short scenario. The primary target for the subsequent decline is 1.1525, aiming for a new low within the channel's structure, near the Support zone.
That's the setup I'm tracking. Thank you for your attention, and always manage your risk.

AUDCAD: Bearish Move From Resistance Confirmed 🇦🇺 🇨🇦
There is a high chance that AUDCAD will retrace from the underlined resistance.
A bearish violation of a support line of a rising channel after its test
provides a strong intraday bearish confirmation.
Goal - 0.9123
❤️Please, support my work with like, thank you!❤️
I am part of Trade Nation's Influencer program and receive a monthly fee for using their TradingView charts in my analysis.

AUDUSD | Sliding Door Moment Below 0.6550The Aussie’s drop below 0.6550 wasn’t on many radars a month ago. A resurgent USD and renewed US–China trade friction have flipped the tone, leaving AUD at a critical crossroads.
Technical Lens:
AUD/USD sits just under key support near 0.6550 — a zone that could define whether the pair stabilises into year-end or slides toward the 0.62 handle. Momentum remains fragile, but oversold signals are emerging on shorter timeframes.
Scenarios:
The Calm Returns: A diplomatic thaw or tariff pause could lift sentiment and reopen the path toward 0.68 by December.
Controlled Chaos: Ongoing noise without escalation keeps AUD capped near 0.66 as the Fed easing cycle does the heavy lifting.
Fractured Trade Front: A full tariff hike wave risks dragging AUD/USD toward 0.62 as RBA easing expectations rise sharply.
Dollar Backfire: An aggressive tariff shock could first hit AUD, then spark a USD selloff that flips the script back toward 0.67.
Catalysts:
Watch for headlines ahead of the Trump–Xi summit in South Korea (Oct 31), China’s next PMI prints, and RBA guidance into November.
Takeaway:
AUD/USD is sitting on a fault line — 0.6550 is the pivot between relief and renewed trade-driven stress.

GBPJPY BearishEntered a short position on GBPJPY, anticipating that bearish sentiment will continue to unfold.
The unfilled gap below, combined with the market’s consistent respect for bearish structure, supports the case for further downside movement.
Let’s see how this plays out.
#Pipmultiplier #GBPJPY #TechnicalAnalysis #Forex #TradingView

Possible Wedge Breakout Possible Wedge Breakout on the Daily Chart.
✅ RSI looking good
✅ MACD curling up
✅ Strong earnings
❓ we need Volume and Momentum on breakout

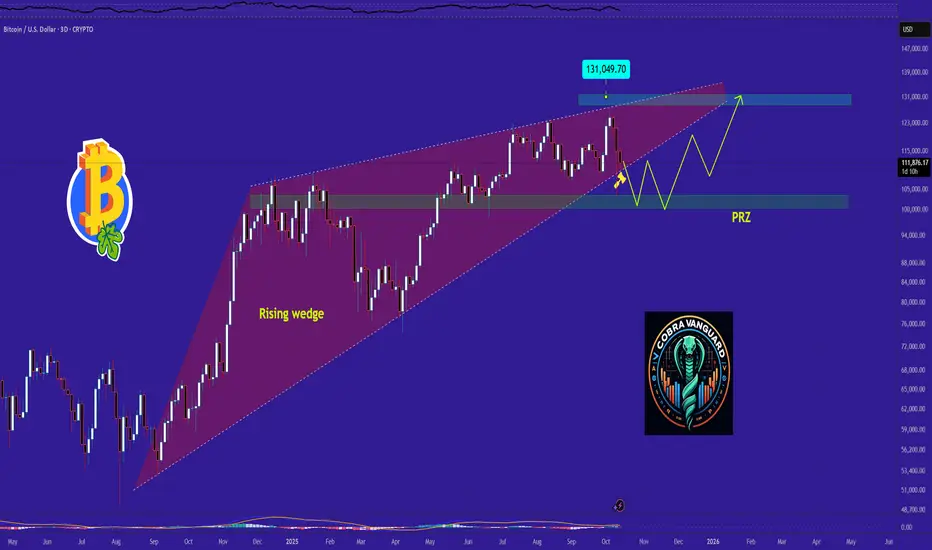
BTC Outlook after the Dip. What to expect NOW?The recent drop in Bitcoin could continue to impact the market for quite some time.
This increases the likelihood of a breakdown from the descending wedge pattern, potentially pushing the price down toward the PRZ (Potential Reversal Zone), which is estimated around $99K.
Once price reaches the PRZ, a strong pump may follow. follow us for more update
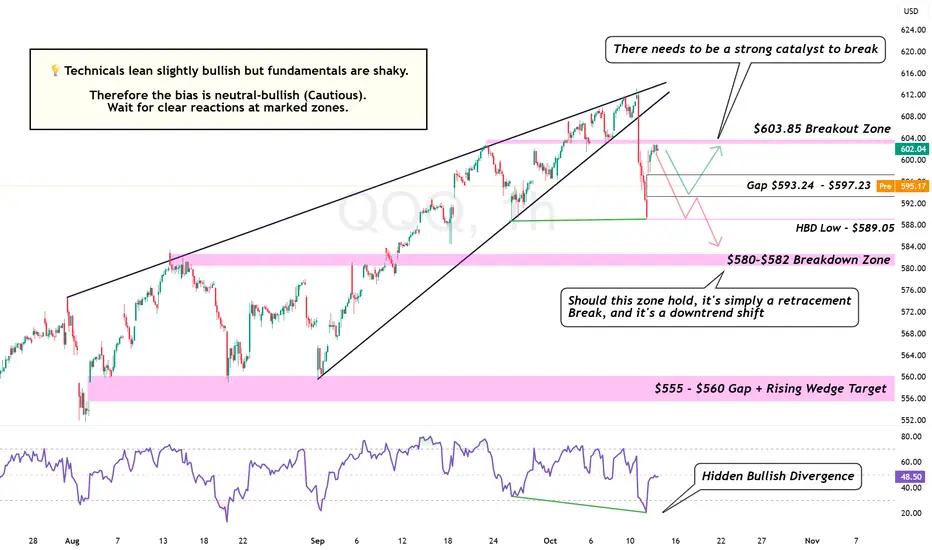
QQQ: Bull Trap or Bounce Time? The $593 Line in the SandQQQ is gapping down right into a massive technical test: the $593 Gap Support.
This is not a regular drop. Our chart is showing a rare conflict:
Bullish Setup: A Hidden Bullish Divergence (HBD) is screaming for a bounce.
Bearish Risk: A loss of the low could trigger a rapid descent to the $580 Zone.
The bias right now is neutral-bullish — cautious optimism.
If bulls hold the gap, expect a short-term rebound toward $603–$605 where sellers will likely re-emerge.
But if $593 gives way, this turns into a full-on correction targeting $582 → $560, completing the wedge breakdown target.
This is the moment of truth.
Bulls need to defend $593 or risk a complete sentiment shift.
Key Levels:
$603.85 — Breakout Zone
$593.24–$597.23 — Gap Support
$589.05 — Structural Floor
$580–$582 — Breakdown Zone
$555–$560 — Rising Wedge Target
Bias: 🟡 Neutral-Bullish (Cautious)
Timeframe: 1H
Indicators: RSI Hidden Bullish Divergence, Rising Wedge Breakdown
CADJPYI FORSEE A SHORT position on CADJPY.
since friday the yen has been gaining strength.
price has been creating lower highs and lower lows.
there is a market gap still yet to be closed.
price bounced of the descending trendline.
formed a continuation pattern.

DASH/USDT , 1W ( Ready for 85% Up Move ) Dash is moving inside wedge or ascending channel pattern , when it is at support and forming the pattern at support after breaking out the pattern it is giving very good move like previous and now we can expect 80% move .
and at the same time Bitcoin dominance is decreasing and altcoins dominance is started increasing , so look on all the altcoins
and follow proper risk management , it has very good chances to move UP side but first we have to protect the down side , where risk management comes into game .

NZDUSD: Anticipating A Breakout Below..?NZDUSD have been moving on a downward channel of support and resistance with lower lows and lower highs. In this structure we can spot that the price is at the lower support level currently, which we are expecting a breakout below this level as the 1D candle is showing bearish.
Meanwhile a possible reversal at this support would trigger the pair to go up..
Key Points:
A confirmed breakout below this lower lows would activate a fall with a target at 0.5509
Like and follow up
Thanks for reading.

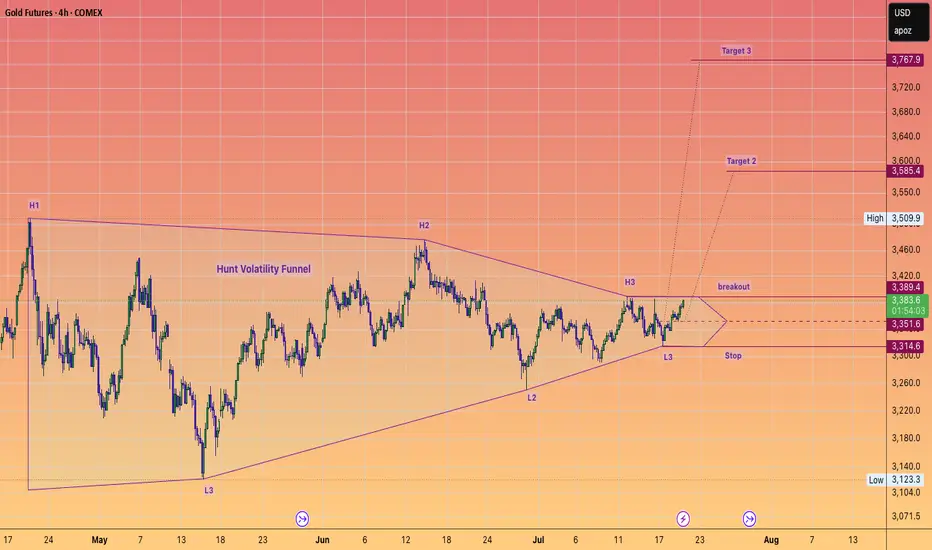
Trade Alert! GOLD to $3800 SOON.#HuntVolatilityFunnel setup which is about to trigger to the upside.
This setup should take gold to or very close to $4K IMHO
#GC
#GOLD
#SILVER
#METALS
ArbChart Structure:
Price action is forming a rising wedge/triangle, approaching the upper trendline (likely near 0.36–0.37).
wait for price to touch the upper boundary—this is where late longs panic in, crowding the top, and a sweep or rejection at the trendline offers a prime short entry.
short
entry 36-38
tp
0.35
0.347
0.34
0.33
stoploss
0.44

GOLD (XAUUSD) 15M – Bullish Continuation SetupTVC:GOLD
🚀
Structure | Trend | Key Reaction Zones
Price perfectly respected the demand zone near 3945–3960 and rebounded strongly.
Market is maintaining a clean ascending channel structure, signaling controlled bullish momentum.
A higher-low formation above 4020 confirms continued buyer strength.
Market Overview
Gold respected the lower trendline and demand zone, showing a sharp bullish reaction back above 4020. The structure remains intact for an upside continuation as long as 4020 holds as intraday support. The next bullish impulse could target the previous high zone near 4060. A clean break above that may extend the rally toward 4080.
Key Scenarios
✅ Bullish Case 🚀 → 🎯 Target 1: 4060 | 🎯 Target 2: 4080 | 🎯 Target 3: 4100
❌ Bearish Case 📉 → 🎯 Target 1: 4000 | 🎯 Target 2: 3960 (if structure breaks below 4020)
Current Levels to Watch
Resistance 🔴 : 4060 – 4080
Support 🟢 : 4020 – 3960
⚠️ Disclaimer: For educational purposes only. Not financial advice.

XAUUSD 15M – Channeling Higher After Demand Reaction TVC:GOLD
Structure | Trend | Key Reaction Zones
Price tapped perfectly into the previous support zone, triggering a sharp bullish recovery.
The market is now moving inside a rising channel, showing healthy bullish correction.
Key focus remains around 4 020 – 4 058, where rejection or breakout will confirm the next phase.
Market Overview
Gold reacted sharply from the prior demand zone, forming a textbook W-reversal structure followed by clean channel continuation. Buyers are currently maintaining control as long as price holds above 3 985 – 3 962 levels. A breakout above 4 020 could extend momentum toward the rejection zone near 4 058, completing the full bullish leg.
Key Scenarios
✅ Bullish Case 🚀 → 🎯 Target 1 : 4 020 | 🎯 Target 2 : 4 058 | 🎯 Target 3 : 4 080
❌ Bearish Case 📉 → 🎯 Target 1 : 3 985 | 🎯 Target 2 : 3 926
Current Levels to Watch
Resistance 🔴 : 4 020 – 4 058
Support 🟢 : 3 962 – 3 926
⚠️ Disclaimer: For educational purposes only. Not financial advice.

$SMR WedgeWedge forming with potential breakout either direction. A break below with a close on the daily would be a strong entry either direction.

BTC; A Recession Before The Next Rise..?Hi Everyone..
Lets take a view at BTCUSDT, the crypto market witnessed a strong liquidation on Friday and it happens to be the highest ever in the history to occurred at a single day.
On the report side, the dip effect was principally from U.S and China trade pressure on the announcement of %100 tariff on Chinese goods been imported. however the U.S dollar currency strengthen more amid the government shutdown. at the moment the "Uptober" psychology is at pause.
In regard to this structure, we can observe clearly how the price broke the lower circle with a sharp retracement creating a chance of downward movement, with a target toward 92k$ and $76k as the next partial support.
Like and follow up
Thanks for reading

BTCUSD: Rally between Trend Line can ContinueHello everyone, here is my breakdown of the current Bitcoin setup.
Market Analysis
From a broader perspective, the market for Bitcoin has been through a very complex and volatile consolidation. After multiple failed moves and tests of both the 108800 Support and the 118000 resistance, the price has finally shown a clear directional bias with a powerful breakout to the upside.
This breakout has established a new, clear uptrend which is being guided by an ascending trend line. Currently, after a strong impulsive rally, the price is in a healthy corrective phase, pulling back towards this main trend line for a potential retest, which is a key area to watch.
My Scenario & Strategy
I'm looking for the price to complete its correction down to this ascending trend line. The key signal for me would be a confirmed and strong bounce from this dynamic support, indicating that the pullback is over and buyers are ready to resume the rally.
Therefore, the strategy is to watch for this bounce. A successful defense of the trend line would validate the long scenario. My new target for the next impulsive wave higher is 127300, which would be a new ATH.
That's the setup I'm tracking. Thank you for your attention, and always manage your risk.
