BITCOIN DOMINANCE has BROKEN DOWN Initially, we have a head and shoulders pattern that has yet to reach its target.
Additionally, there is a significant breakdown from a broadening ascending wedge.
Expanding wedge formations exhibit increasing volatility as they develop.
These ascending broadening wedge chart patterns emerge during uptrends, signalling trend continuation with higher highs and higher lows, often touching the upper and lower boundary lines of the wedge.
When the head and shoulders pattern was formed, it FAILED to reach the upper boundary.
This suggests a exhaustion of the uptrend.
The activation of the head and shoulders confirmed that a reversal was underway.
Now, we are witnessing the breakdown of the wedge, followed by back testing, which confirms the weakness of #Bitcoin compared to the #ALTS, particularly #Ethereum, of course.
I still believe that Bitcoin has higher price targets that will be achieved, so I remain optimistic about BTC.
If you own Bitcoin, it would be wise to stay with that asset and avoid getting caught up in the extreme volatility of alt coins.
For those of us who have been battling and enduring in the trenches over the past few years, the opposite holds true.
We CANNOT give in to Bitcoin maximalism at this point in the game!
This is our Time!
Wedge

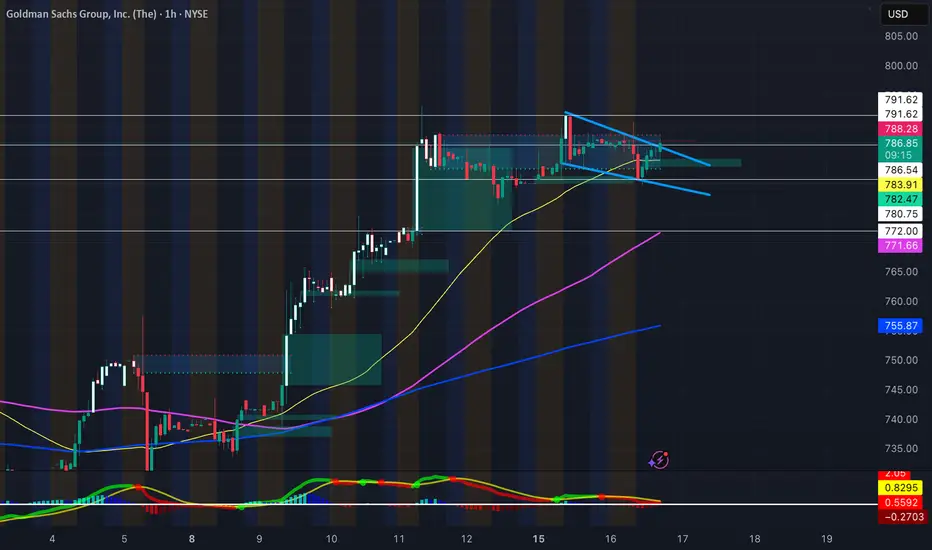
Long GS Falling Wedge FormingFalling wedge forming on NYSE:GS hourly, with NYSE:GS bouncing off its 50-day SMA. It's EMA's are curling upwards, and a bullish FVG formed as support. With pending FOMC conference tomorrow and potential rate cuts, certainly will be watching NYSE:GS
PT1 - 790.40
PT2 - 794.50
PT3 - 798.90
GBPCAD: A Pullback From Resistance..GBPCAD have been moving between this tight range of support and resistance, in respect to this structure it is clearly showing us a short opportunity heading down.
The pair is trending on bullish wedge of higher highs and higher lows, however we anticipate a reversal from the support zone.
Possible Outline:
Buy and sell at the resistance while you await a breakout from this areas.
Hello traders what is your opinion on this review ?
Like and follow up my page
Thanks for reading

EURGBP Short Trade SetupTrend: Bullish
Divergence: Bearish
Continuation Pattern: None
Reversal Pattern: Rising Wedge
Bias: Bearish
Scenario: Sell Stop at LH Breakout
Trade Plan
Stop Loss: 0.87475
Entry Level: 0.8715
TP1: 0.8683

Bitcoin will Retest Support Before the Next Leg UpHello traders, I want share with you my opinion about Bitcoin. The market structure for Bitcoin has seen a significant shift from bearish to bullish, following a strong reversal from the 109300 - 110000 buyer zone. This pivotal move led to a breakout from a prior downward wedge, invalidating the bearish trend and establishing the current, well-defined upward channel. The price action for BTC has since been constructive, creating a series of higher highs and higher lows within the boundaries of this new channel. Currently, the asset is undergoing a healthy corrective phase after being rejected from the highs, and the price is now trading at a critical inflection point, close to the ascending support line of the channel. In my mind, this pullback represents a classic trend-continuation opportunity. I expect that the price will bounce from the channel's ascending support line. I think this rebound will have enough momentum to break through the 117500 Resistance Level and continue its rally towards the major seller zone. Therefore, I have placed my TP at 119500. Please share this idea with your friends and click Boost 🚀
Disclaimer: As part of ThinkMarkets’ Influencer Program, I am sponsored to share and publish their charts in my analysis.

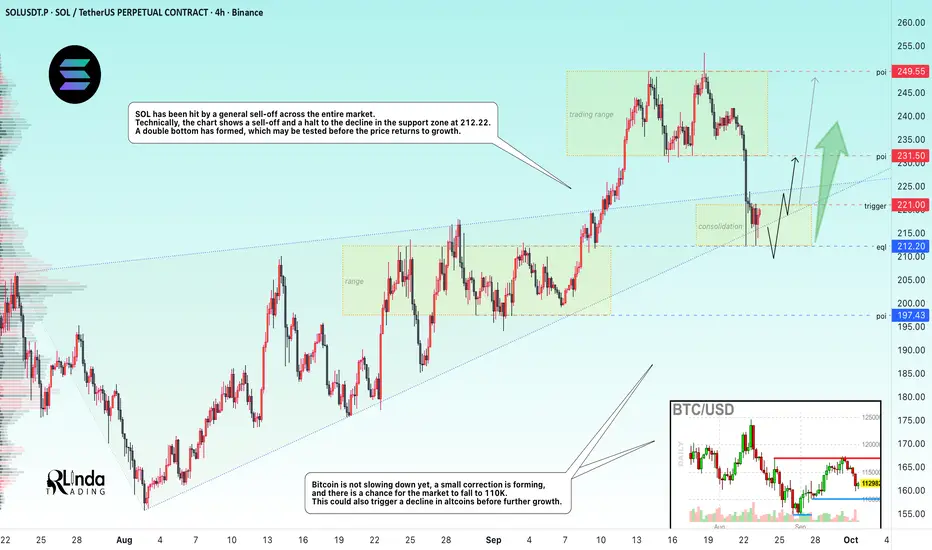
SOLANA → When will the sale end? Bullish trend...BINANCE:SOLUSDT.P is testing the key support zone of 210-215 amid a market decline. However, it is too early to say that the correction is over; additional signs are needed...
Bitcoin is not slowing down yet, a small correction is forming, and there is a chance for the market to fall to 110K. This could also trigger a decline in altcoins before further growth. SOL has been hit by a general sell-off across the entire market. Technically, the chart shows a sell-off and a halt to the decline in the support zone of 212.22. A double bottom has formed, which may be tested before the price returns to growth.
The current consolidation in the range of 212.0 - 221.0, the boundaries of which are of interest to the market, gives hope.
Support levels: 212, 200, 197
Resistance levels: 221, 231.5
A breakout of the local consolidation resistance and a close above 223.5 - 224 could trigger further growth within the bullish trend. Otherwise, MM may test the liquidity and support zone of 212.0 before the coin begins its recovery phase.
Best regards, R. Linda!
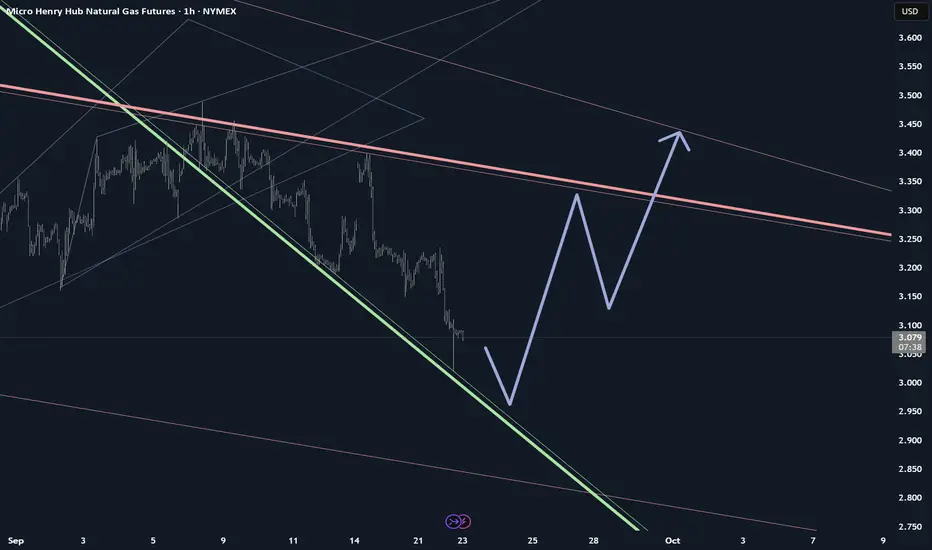
Nat Gas Expanding RangePrice appears to be forming an expanding wedge(Megaphone).
Beware price is still well inside the higher time frame downtrend.
If this pattern is respected, Price swings will widen and price will break to the upside(RED LINE). However, there is a likely chance of exhaustion in price movement as it plays out.
NYMEX:MNG1!
EURUSD Bullish SetupTrend: Bearish
Divergence: Bullish
Continuation Pattern: No
Reversal Pattern: Falling wedge
Bias: Bullish
Scenario:Entry at LH Breakout
Trade Plan:-
Stop Loss 1.17265
Entry Level 1.1794
TP1 1.1862

EURUSD: wedge narrowing with downside targets in sightOn the daily chart, EURUSD has formed a rising wedge pattern, and the current price action indicates readiness for a decline. Attempts to hold above 1.1800 have failed, pressure has increased, and last week’s close can be viewed as a potential false breakout.
The first downside target is at 1.1413, where a strong support level lies. Further targets may shift to 1.0750 and 1.0480 levels that have accumulated significant volume over the past few months. A full breakdown of the wedge would give momentum to the bearish scenario and increase pressure on the euro.
From a fundamental perspective, the picture remains mixed: the 200 EMA capping from above and the sideways movement in the dollar index confirm the likelihood of euro weakness, but every pullback continues to be aggressively bought, preventing a collapse. If the dollar gains additional support from US macroeconomic data or Federal Reserve policy, the bearish scenario will become dominant.

ACC , 1W Breakout In this stock we clearly see the Channel or Wedge pattern is formed and Ready for Breakout , Wait for candle Close in 1D with good volume , then we can see very good move up to 45% nearly .
As now nifty is given Breakout from 1D Channel pattern and in Market Breadth 1D has given breakout and in weekly market Breadth it is near the Resistance , if we see good volume close in this week we can expect Market will be Bullish for next 2-3 Months .
Follow for more Swing Ideas Like This .

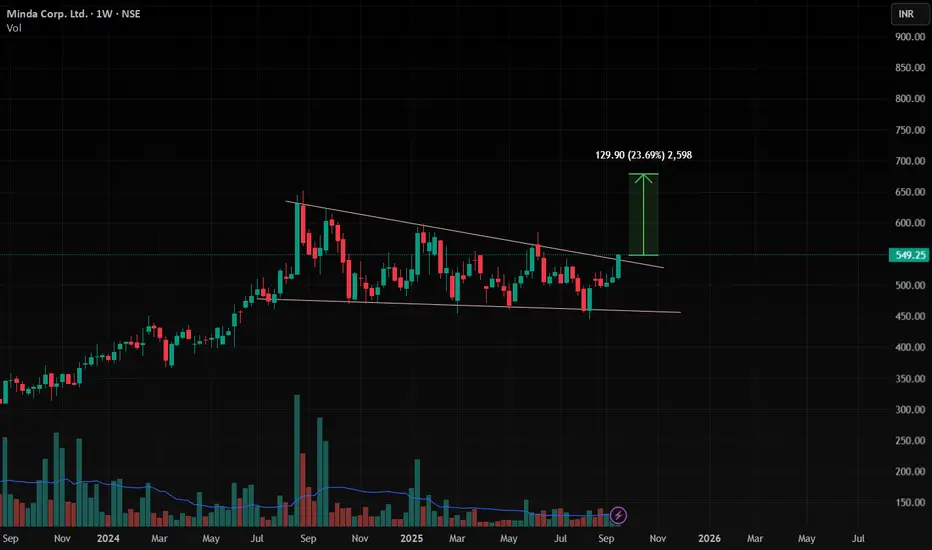
MindaCorp Weekly Breakout In this stock we clearly see the Triangle or Wedge pattern is formed and given Breakout ,we can see very good move up to 25% nearly .
As now nifty is given Breakout from 1D Channel pattern and in Market Breadth 1D has given breakout and in weekly market Breadth it is near the Resistance , if we see good volume close in this week we can expect Market will be Bullish for next 2-3 Months .
Follow for more Swing Ideas Like This .
GOLD → Breakthrough of correction resistance. Uptrend FX:XAUUSD entered a correction phase after the Fed meeting and interest rate cut, but by the end of the week, the market managed to recover from the decline and return to the zone of interest, breaking through the resistance of the downtrend...
The dollar is correcting after the Fed meeting on interest rates. The index is testing resistance at 97.5-98.0, and a false breakout of this zone could trigger a fall in the index, which in turn would only support the forex and gold markets...
At this time, the metal is reducing its correlation with the DXY and breaking the resistance of the downward correction, which is provoking an impulse to 3685. Technically, Friday's trading session is closing quite positively, which generally indicates a high level of demand.
I would highlight several key levels: the previously broken resistance at 3674 (below this zone there is a hidden liquidity pool) and resistance at 3685 (trigger). A retest of the lower level is possible before the price continues its growth. The target within the current movement can be considered 3700 - 3710.
Support levels: 3674, 3668, 3660
Resistance levels: 3685, 3703, 3710
If, during the Asian/Pacific session, gold consolidates without a pullback and closes above 3685, the market may continue to rise towards the specified target. However, if the market lacks potential (after the weekend), then MM may test 3674 - 3668 before the price returns to growth towards the target of 3700.
Best regards, R. Linda!

$FLOCK breakout in progress Price reclaiming key level$FLOCK breakout in progress Price reclaiming key levels with strong momentum. Price breaking out of the wedge Bulls aiming for the 0.40–0.45 zone next Volume confirming the upside pressure Potential rally toward 0.50 if momentum holds.

XAUUSD Long: Path to $3715 After Successful RetestHello, traders! The price auction for XAUUSD has been developing within a well-defined upward wedge for some time. This bullish structure has guided the price higher through a series of higher highs and higher lows, with the demand zone 2 at 3575 acting as a key pivot point low for the formation, establishing the underlying uptrend.
Currently, the auction has reached a critical stage after a strong impulse resulted in a breakout above the key horizontal demand level at 3665. This move shows strong bullish initiative, but such breakouts are often followed by a retest to confirm their validity before the next major leg up.
My scenario for the development of events is based on this breakout being successful. I expect the price to make a corrective pullback to retest the broken 3665 demand level from above. In my opinion, if this former resistance holds as new support, it will be a strong confirmation of the bullish trend. This should trigger a continuation of the rally towards the upper resistance line of the wedge. The take-profit is therefore set at 3715, just below this upper boundary. Manage your risk.

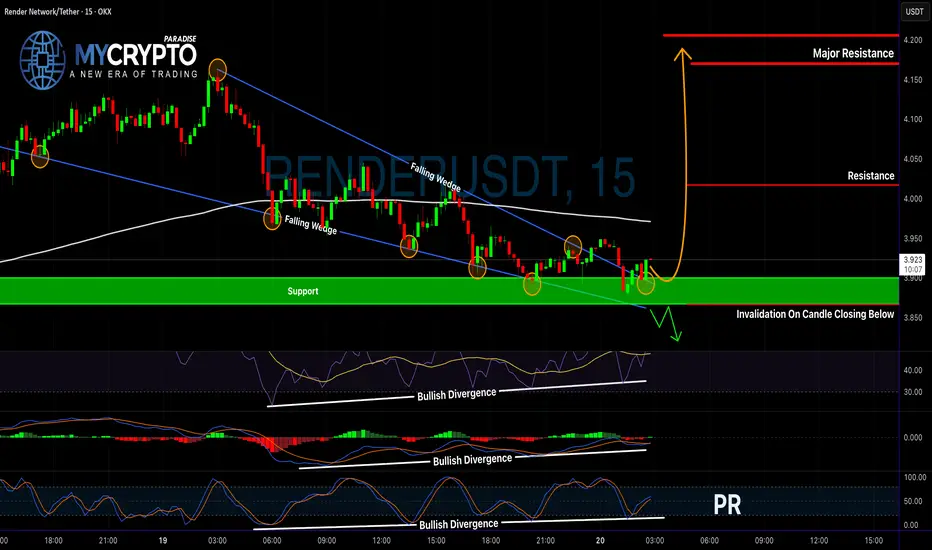
Is RENDER About to Explode?Yello Paradisers, are you watching closely? RENDERUSDT just completed a textbook breakout—and it might be your best shot at catching a high-probability move before the crowd even notices.
💎RENDERUSDT has officially broken out of a falling wedge—a powerful bullish pattern—confirmed by bullish divergence on the RSI, MACD, and Stochastic RSI. When all three indicators align like this, the probability of a strong upside move significantly increases.
💎Even better, price action has already retested the wedge breakout, and from the current levels, the market is offering a favorable risk-to-reward (RR) setup.
💎Now, if you’re looking for additional confirmation, a more cautious play would be to wait for a pullback into the nearest support zone, and then enter on a bullish candlestick formation. This approach could not only boost your confidence but also improve your overall RR.
💎However, stay sharp—if price breaks and closes below the support and our invalidation level, the entire setup gets invalidated. In that case, patience is key. Wait for stronger price action before considering re-entry.
🎖Strive for consistency, not quick profits. Treat the market as a businessman, not as a gambler. Be patient, stay focused, and let the market come to you, Paradisers. That’s how the winners play this game long-term.
MyCryptoParadise
iFeel the success🌴
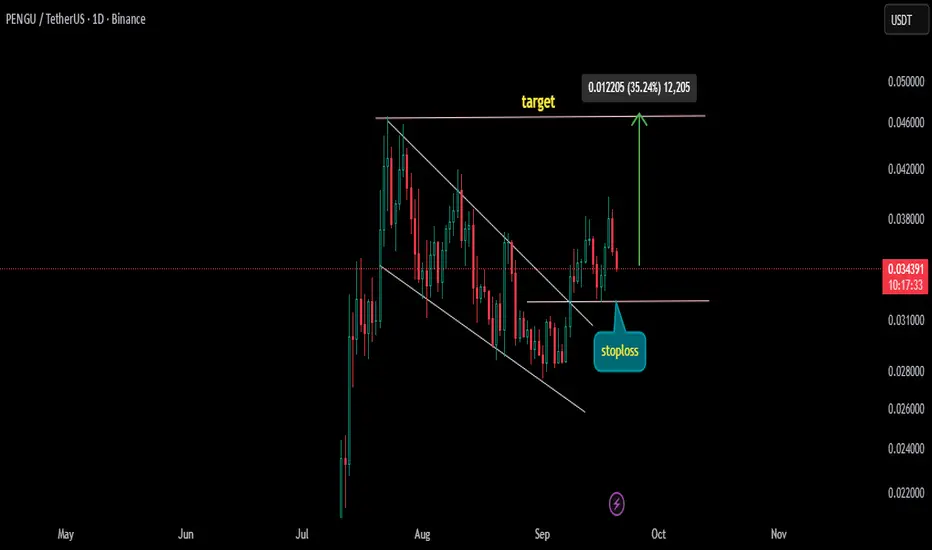
Rising Wedge pattern on PENGUUSDT A Rising Wedge Pattern is triggered on Charts . this chart pattern is considered to be highly profitable by traders on longs, always puts stoploss on neckline of pattern as shows in charts
Euro can Bounce From Wedge Support and Rally to 1.1930Hello traders, I want share with you my opinion about Euro. The market for the Euro has transitioned from a clear trending phase into a more complex corrective structure after the prior upward channel failed to sustain its momentum. Following a significant rejection, the price broke down and underwent a deep correction, which was ultimately absorbed by the major 1.1430 - 1.4000 buyer zone. This level served as a critical pivot, halting the decline and initiating the current market phase, which has taken the form of a large upward wedge. The price action for EURUSD has since been contained within this new pattern, rotating between its ascending support and resistance lines. Currently, the asset is at a key inflection point, having completed a corrective swing down to test the ascending support line of this wedge. In my mind, this sets up a long, rotational scenario. I expect that buyers will defend this dynamic support. A confirmed bounce from this support line would validate the integrity of the wedge and signal the start of a new rally towards the upper boundary. Therefore, I have placed my TP at 1.1930, a target that aligns perfectly with the resistance line of the wedge. Please share this idea with your friends and click Boost 🚀
Disclaimer: As part of ThinkMarkets’ Influencer Program, I am sponsored to share and publish their charts in my analysis.

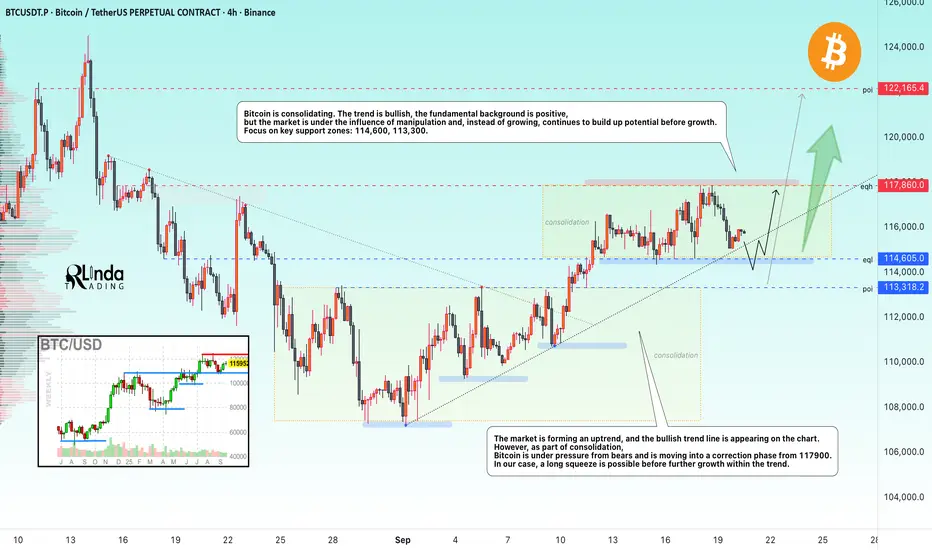
BITCOIN → Manipulation, long squeeze before growth BINANCE:BTCUSDT is in a global bullish trend. The fundamental background, following the start of interest rate cuts, is taking a positive turn, but instead of growth, the market is consolidating...
Bitcoin is showing resilience, trading within the specified trading range (above 114K) amid the Fed's policy easing. For three weeks in a row, growth has been supported by dovish signals from the central bank and growing institutional demand.
Key drivers: The Fed's 25 bps rate cut and forecasts of further easing (to 3.6% by the end of 2025) have strengthened the fundamental backdrop in the cryptocurrency market. Corporate and ETF purchases continue to fuel the bullish trend. Low rates reduce the attractiveness of bonds and increase interest in Bitcoin.
Technically, the market, influenced by manipulation rather than growth, continues to accumulate potential before growth.
Resistance levels: 117860,
Support levels: 114600, 113300
The market is forming an uptrend, with a bullish trend line appearing on the chart. However, as part of consolidation, Bitcoin is under pressure from bears and is moving into a correction phase from 117900. I expect that MM may form a long squeeze in the liquidity zone. That is, a false breakdown of the consolidation support and trend at the same time, and only then return to an upward movement.
Best regards, R. Linda!
Archer (ACHR) Bullish Pennant Breakout?I love this chart setup so wanted to share. It has a little bit of everything from market structure, fib levels, pattern recognition, falling wedges.. a bullish backdrop for tech, speculative plays, and the air transportation sector in particular.
Archer's top competitor is $JOBY. They have been performing amazing as of late, experiencing all time highs, even. During the last few months though I have watched NYSE:ACHR closely looking for an opportunity to diversify and buy up some real estate. Now is looking like a decent time to start accumulating for a swing trade in my humble opinion.

EURGBP - Testing Supply at the Channel TopEURGBP has been grinding higher on the 4H, respecting a rising channel. Price is now tagging the overbought zone near the upper bound and a 0.873–0.875 supply area.
This confluence is key 🔑. If sellers react here, I’ll look for short setups on rejection, aiming for 0.867 first, then 0.863 toward demand and the lower channel.
If price breaks and holds above 0.875, the short idea is invalidated and 0.880+ could follow. Until then, it’s a “look for shorts at supply” play.
What’s your take - fade the touch at supply, or wait for a confirmed break and retest? 🤔
⚠️ Disclaimer: This is not financial advice. Always do your own research and manage risk properly.
📚 Stick to your trading plan regarding entries, risk, and management.
Good luck! 🍀
All Strategies Are Good; If Managed Properly!
~Richard Nasr

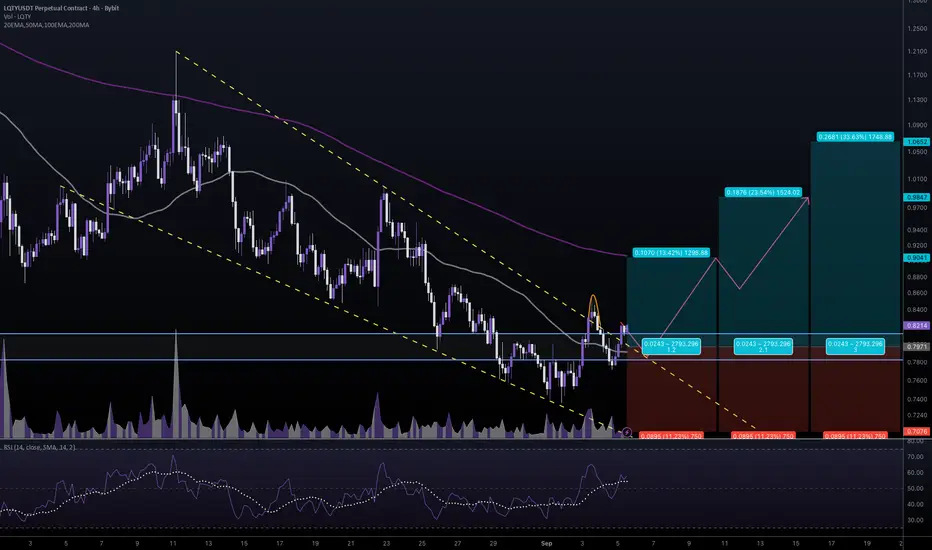
#LQTYUSDT #4h (Bitget Futures) Faling wedge breakout and retestLiquity just regained 50MA support after a first deviation, seems likely to resume bullish towards 200MA resistance and more.
⚡️⚡️ #LQTY/USDT ⚡️⚡️
Exchanges: Bitget Futures
Signal Type: Regular (Long)
Leverage: Isolated (4.0X)
Amount: 4.5%
Current Price:
0.8214
Entry Zone:
0.8116 - 0.7826
Take-Profit Targets:
1) 0.9041
2) 0.9847
3) 1.0652
Stop Targets:
1) 0.7076
Published By: @Zblaba
$LQTY BITGET:LQTYUSDT.P #4h #Liquity #DeFi liquity.org
Risk/Reward= 1:1.2 | 1:2.1 | 1:3.0
Expected Profit= +53.7% | +94.1% | +134.5%
Possible Loss= -44.9%
Estimated Gaintime= 1-2 weeks
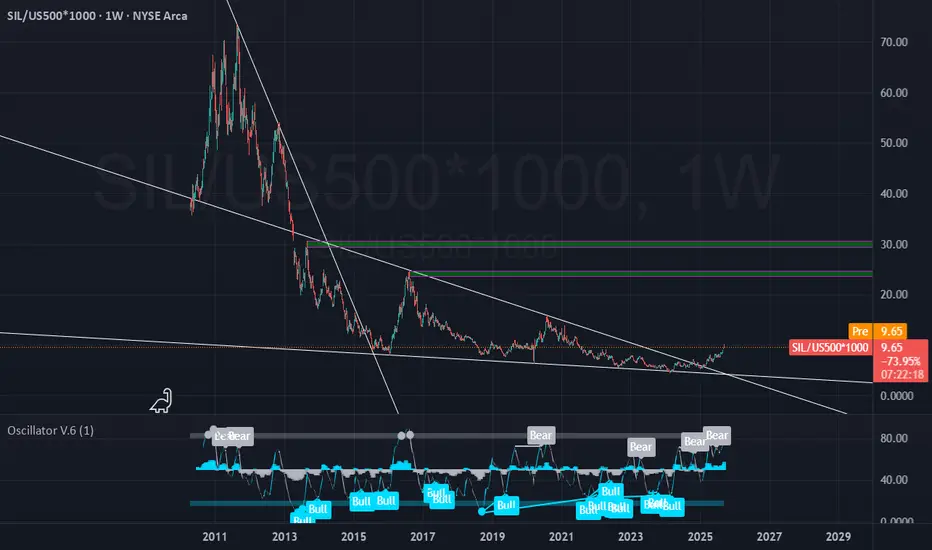
Silver: From Underperforming to OutperformingThe Silver miner ETF has been underperforming the US Stock market for quiet some time.
The times are shifting, seeing the breakout off the Falling Wedge.
Targets from this moment: 100% Minimum
Potentially: 200%+
TLDR: for maximazing performance, you are better off owning SIL ETF (or silver stocks) then the S&P500.
510 or 500CNASDAQ:CRWD 510C Above the key level
Or 500C around the Previous target
Targets 505.77 - 517.69
Stop below 488
