DYDX Secondary Trend. Capitulation Zone. Wedge. 30 08 2024Logarithm. Time frame 3 days.
Line chart.
Main trend and this secondary trend zone in it.
DYDX Main trend 30 08 2024
Wedge

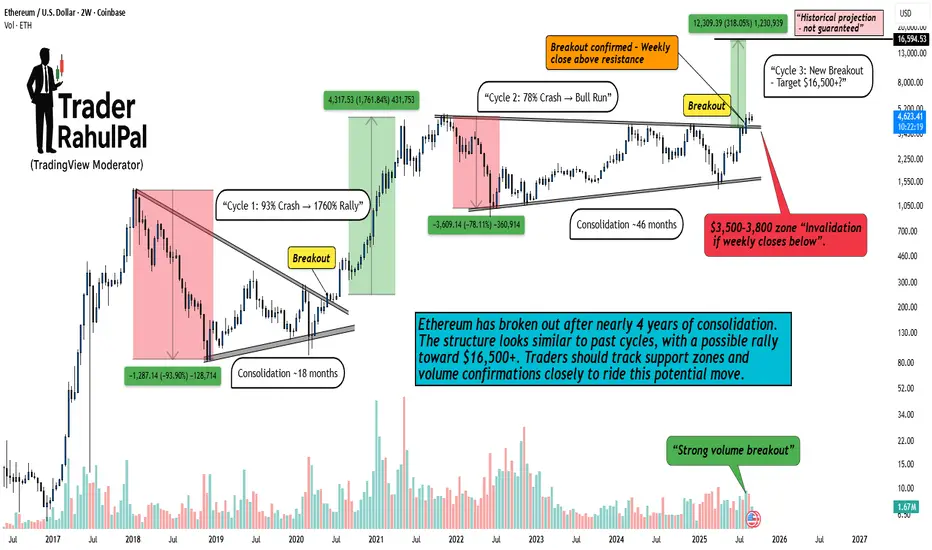
Ethereum Breakout – From Crash to Bull Run, History Repeats?Hello Traders!
Ethereum has once again confirmed a major breakout after years of consolidation. If we study its past cycles, we can see a repeated pattern: deep crashes, long consolidation, and then explosive rallies. The current setup looks no different.
Cycle 1: 2017–2020
ETH crashed nearly 93% , shaking out weak hands.
After 18 months of consolidation , it broke out strongly.
Result → A massive 1760% bull run .
Cycle 2: 2021–2023
ETH faced another 78% crash during the bear market.
This time, consolidation lasted around 46 months .
Breakout again led to a solid bull phase.
Cycle 3: 2025 (Current)
ETH has confirmed a weekly close above resistance – signaling breakout.
Strong volume support adds conviction.
Projection suggests a move toward $16,500+ , about 318% potential upside .
But remember: invalidation if ETH closes below $3,500–3,800 .
Why This Matters
Ethereum doesn’t just move randomly – it moves in cycles . Each cycle has followed the same sequence:
Crash → Consolidation → Breakout → Bull Run
If history repeats, we may be witnessing the early stages of another explosive cycle.
Rahul’s Tip
Always respect both sides of the market. Big targets look exciting, but risk management is everything. Mark your invalidation levels, and never forget: every bull run starts with patience during consolidation .
Disclaimer: This analysis is for educational purposes only and should not be taken as financial advice. Please do your own research or consult your financial advisor before investing.
Analysis By @TraderRahulPal (TradingView Moderator) | More analysis & educational content on my profile
👉 If you found this helpful, don’t forget to like and follow for regular updates.
HBARUSDT → Correction before the rally...After strong growth from the 0.14 zone, BINANCE:HBARUSDT HBAR updated its maximum to 0.30 and entered a correction phase, testing the intermediate and strong support level of 0.2300. A false breakdown has formed, and price consolidation above the key zone could trigger another rally.
HBAR currently has two key levels: 0.243 and 0.2337. The bulls are trying to keep the correction at the upper support level. However, there is a huge pool of liquidity hidden behind 0.2337, which could be tested (before growth resumes) if 0.243 fails to hold the price.
Locally, the coin is breaking the structure of the downward correction (consolidation in a bull market) and is trying to consolidate above support (in the zone of interest). The end of the current correction phase may lead to a resumption of distribution.
Support levels: 0.2432, 0.2337
Resistance levels: 0.2547, 0.26, 0.2763
The formation of a bullish structure relative to 0.2432 will confirm the presence of an interested, large buyer. This could trigger strong growth. Otherwise, I will wait for a retest of 0.2337, from where I will look for an opportunity to open long positions with the aim of medium-term growth.
Best regards, R. Linda!

GOLD → Consolidation before continuing growth to 3700 FX:XAUUSD resumed its growth on Friday, approaching the $3,650 level, amid growing expectations of aggressive Fed rate cuts and geopolitical risks. The metal remains near record highs and is poised for a fourth consecutive week of gains.
Key drivers: Probability of a 25 bp rate cut on September 17 — 92%, chance of a 50 bp cut — 8%. Markets are expecting three cuts in 2024. US plans to impose new tariffs on India and China are supporting demand for safe havens.
Gold remains in a bullish trend. The weak US economy and geopolitics are pushing it to new highs, but profit-taking at current levels is possible.
There is no news today, so trading may be relatively calm.
Technically, if the price does not retest 3738 but begins to consolidate near 3657 and attempts a breakout, the chances of continued growth will increase.
Support levels: 3638, 3630
Resistance levels: 3649, 3657
I expect the market to reach the liquidity zone of 3638 before returning to retest the trigger. However, if MM deems this maneuver unnecessary and forms a trading range between 3657 and 3649, then closing above 3657 could lead to another bullish distribution.
Sincerely, R. Linda!

ARC - READY TO MOON ?? Im still holding LSE:ARC and it's likely to explode soon; here's why:
📈Multi month wedge
📈Strong buy volume (weekly) |accumulation]
📈Bullish pennant
Moonshot incoming soon?

ENS Ready for 100% Up MoveNow the price is at the Weekly support and forming a wedge pattern and ready to break from this pattern , enter after the strong candle close in weekly .
and at the same time Bitcoin dominance is decreasing and altcoins dominance is started increasing , so look on all the altcoins
and follow proper risk management , it has very good chances to move UP side but first we have to protect the down side , where risk management comes into game .
Follow for more Ideas and potential coins/ Stocks .

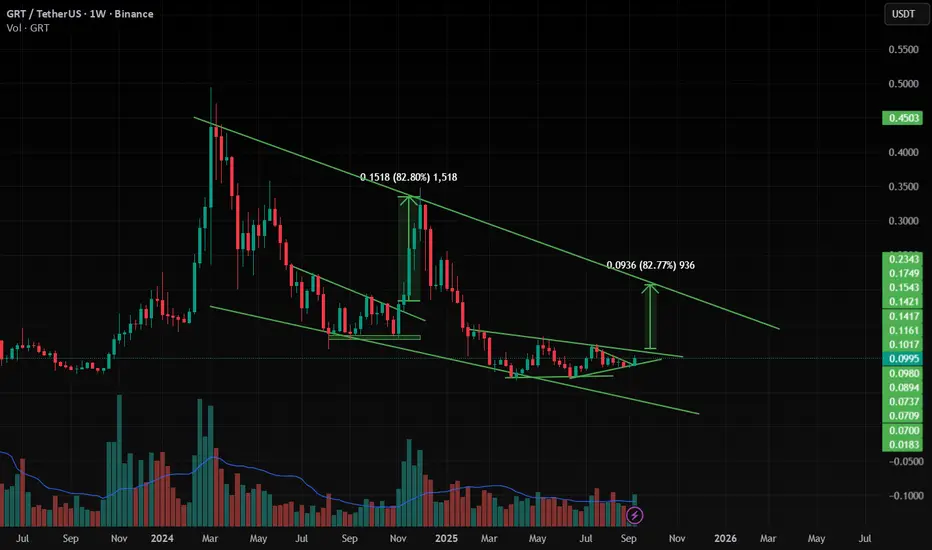
GRT is ready to move 80% Up GRT is moving inside the Triangle or Flag or wedge , and when it is breaking from pattern at support giving good move .
and at the same time Bitcoin dominance is decreasing and altcoins dominance is started increasing , so look on all the altcoins.
and follow proper risk management , it has very good chances to move UP side but first we have to protect the down side , where risk management comes into game .
ANKR/USDT ,1W ( Ready for 140 % Move ) ANKR is moving inside the Triangle pattern and when it comes to support and breaks a pattern then it is very much possible to give very good move.
and at the same time Bitcoin dominance is decreasing and altcoins dominance is started increasing , so look on all the altcoins.
and follow proper risk management , it has very good chances to move UP side but first we have to protect the down side , where risk management comes into game .

IMX/USDT , 1WIn Weekly if IMX breaks the Wedge pattern with strong candle close . it will move very fast (300%) like the same as past move . as the altcoins season is starting and slowing gaining momentum.
and at the same time Bitcoin dominance is decreasing and altcoins dominance is started increasing , so look on all the altcoins
and follow proper risk management , it has very good chances to move UP side but first we have to protect the down side , where risk management comes into game .

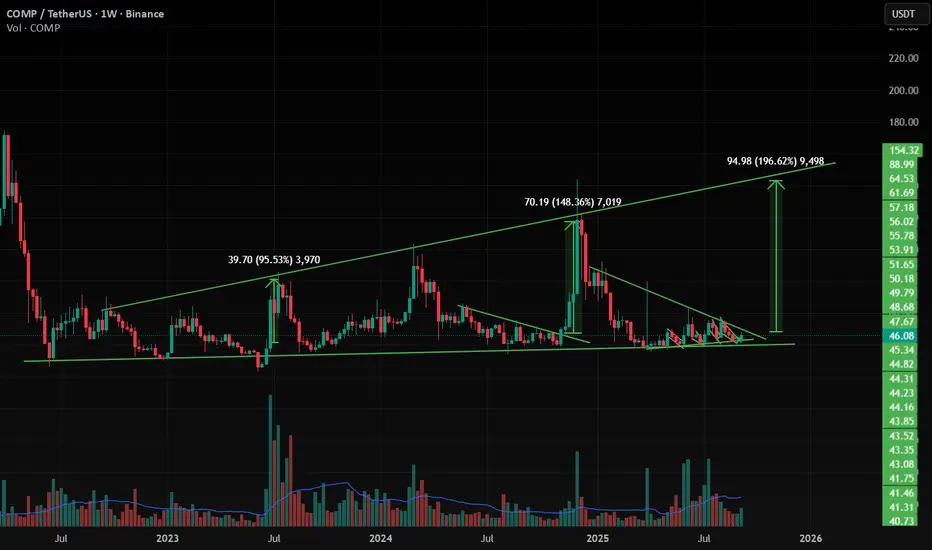
COMP/USDT , 1W , Bullish COMP has moving same as previous moves , so it will give nearly 200 % UP move very strong if it breaks the upper trendline in Weekly and strong candle close .
it has forming Expansion channel pattern inside it is giving good up movement when it touches
support zone and breaking out from the pattern in weekly time frame .
and at the same time Bitcoin dominance is decreasing and altcoins dominance is started increasing , so look on all the altcoins
and follow proper risk management , it has very good chances to move UP side but first we have to protect the down side , where risk management comes into game .
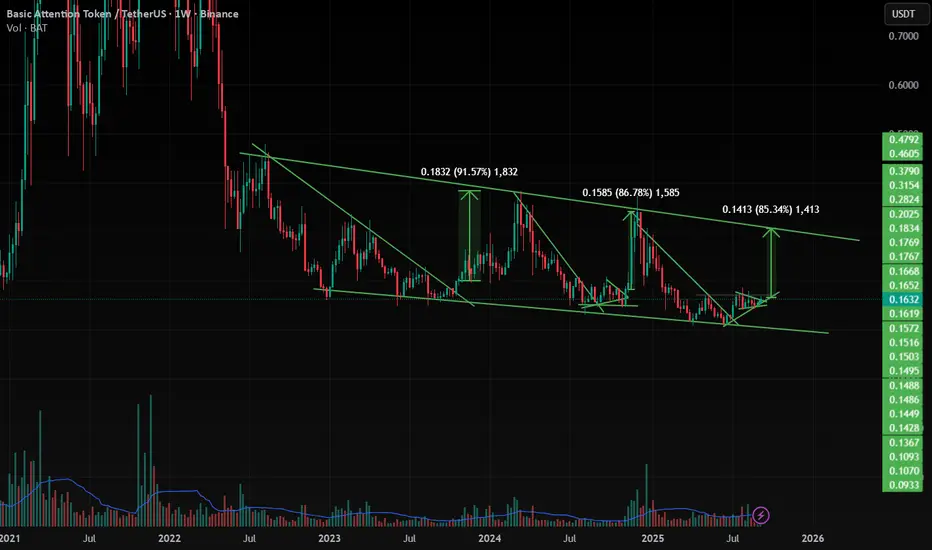
BAT/USDT , 1W BAT has moving same as previous moves , so it will give nearly 85 % UP move very strong if it breaks the upper trendline in Weekly and strong candle close .
Main important points are
1. BTC Dominance is falling Daily
2. ETH Dominance is increasing
3. Altcoins Dominance is Increasing
Means Volume is moving from BTC too Altcoins Slowly , soo Altcoins season is coming soo , look on Breakouts in altcoins , they will perform vey well .
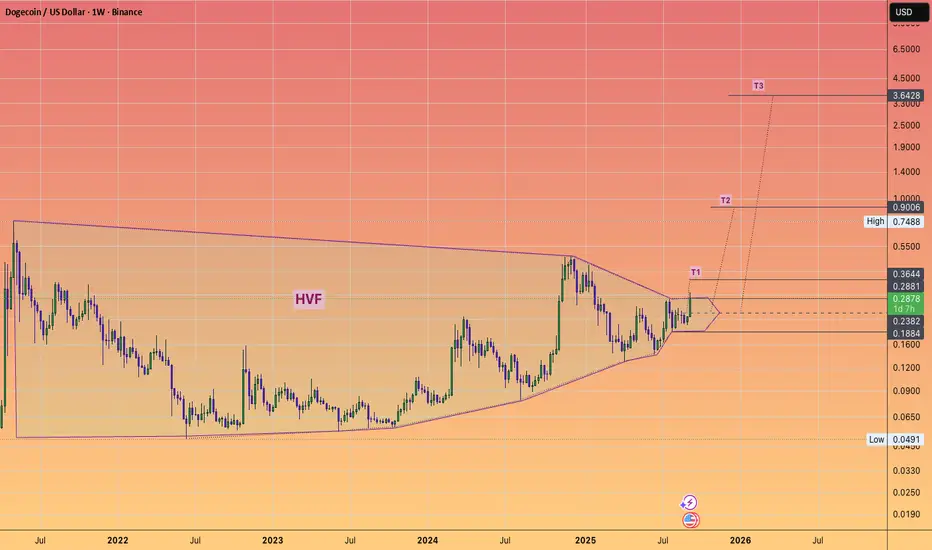
DOGECOIN can go higher than you think.#DOGE
Can get to around 4 Bucks a coin.
Yea I know thats around half a trillion of marketcap.
What does the @TheCryptoSniper think of this #HVF
SUI Wedge BreakoutSui formed a bullish Wedge and it broke out.
If the price established above 3.63, We can expect a bullish move up to 4.4 area.
Stops at 3.07.
BTC is bullish now and many Traders don't see it !So if you pay attention to the BTC chart you can see that the price has formed a Ascending wedge which means it is expected to price move as equal as the measured price movement.( AB=CD )
NOTE: wait for break of the WEDGE .
Best regards CobraVanguard
CRV Bullish FlagCRV is forming a bullish Wedge.
If the price broke the resistance level at 0.86 and Established above, We can expect a bullish move up to 1.11 area.
Stops at 0.71.

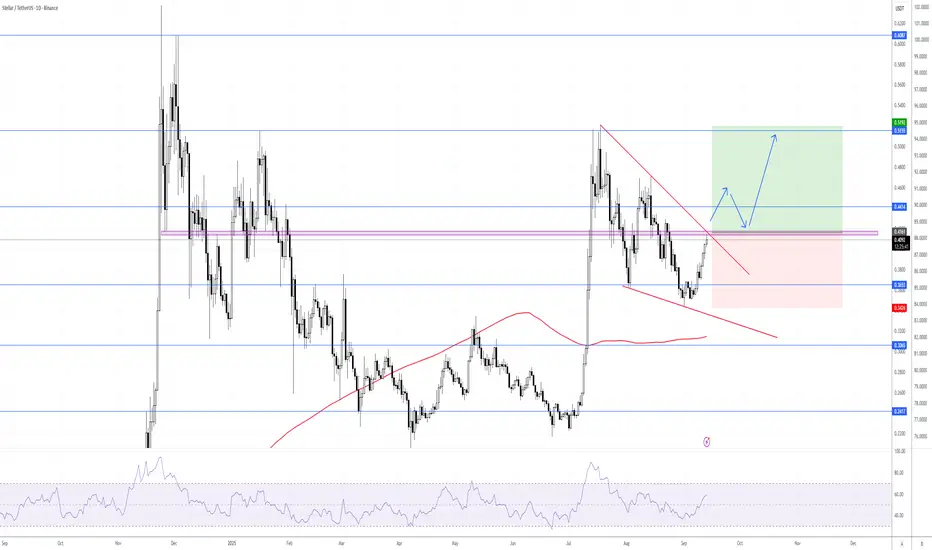
Stellar Bullish FlagXLM/USDT formed a bullish falling wedge and is now approaching resistance. Breakout confirmation above 0.4161 opens the path to 0.5155, with potential extension to 0.6087. Wait for the breakout and the retest. Stop loss below 0.3425.
BTCUSD: Consolidation will ContinueHello everyone, here is my breakdown of the current Bitcoin setup.
Market Analysis
From a broader perspective, the market for Bitcoin has shifted from a trending phase into a wide consolidation Range. This occurred after the price broke down from a prior Upward Wedge, signaling a pause in the bullish momentum and establishing the current boundaries between the 107700 Support and the 119000 Resistance.
Currently, the price has completed a full rotation from the bottom of this Range and is now approaching the major horizontal Resistance at the 119000 level. This is a historically significant area that has repeatedly capped rallies and acted as a strong barrier for buyers.
My Scenario & Strategy
I'm anticipating that the price will make a final push into the 119800 - 119000 Resistance Zone. The key signal I'm watching for is a clear rejection from this area, confirming that sellers are still in control at these prices and that another rotation downwards is likely.
Therefore, the strategy is to watch for this rejection at the top of the Range. A confirmed reversal would validate the short scenario. The primary target for this downward rotation is 111000 points, an intermediate level within the Range where a price reaction could be expected.
That's the setup I'm tracking. Thank you for your attention, and always manage your risk.

USDCHF: Bearish Scenario Explained 🇺🇸🇨🇭
There is a high chance that USDCHF will continue falling from
a key intraday horizontal resistance.
A bearish breakout of a support line of a rising wedge pattern
provides a strong bearish confirmation.
Goal - 0.7937
❤️Please, support my work with like, thank you!❤️
I am part of Trade Nation's Influencer program and receive a monthly fee for using their TradingView charts in my analysis.

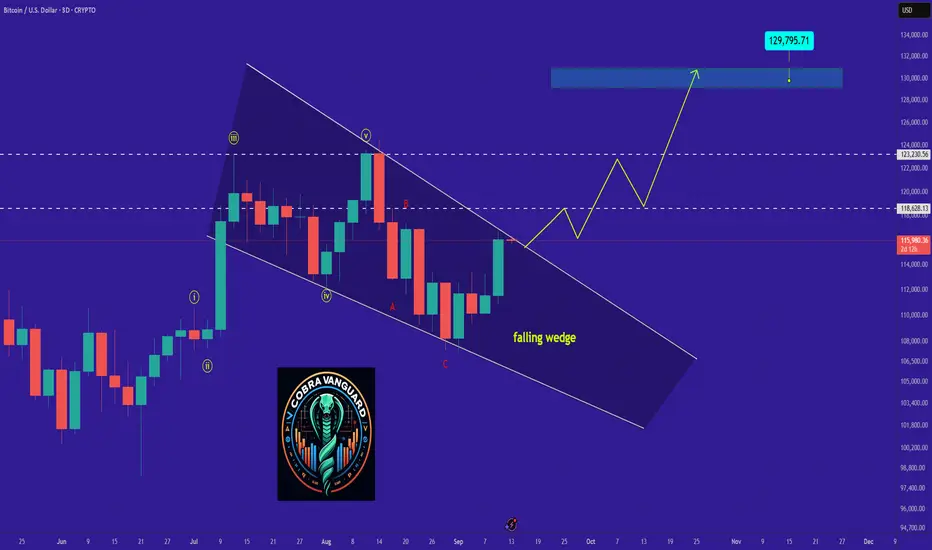
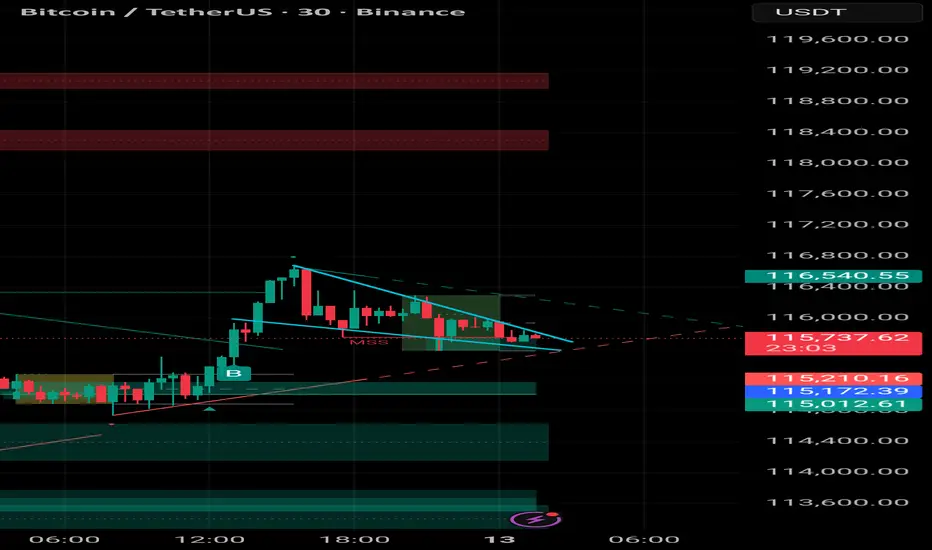
BTC / USDT : Falling wedge breakout confirmedBitcoin (Update)
BTC has confirmed a breakout from the falling wedge pattern. After some consolidation, we anticipate a strong bullish move toward the $124,000 zone.
Keep it on your radar — breakout confirmation is in place, momentum could build quickly. Always manage risk in volatile conditions.

Invalidation raising wedge btc, long this shitIf you guys have playing altcoin, you will experience few altcoin counter such as solana and pumpfun this week, u most probably having a bad day on hitting your stop loss.
Solana is doing a failed rising wedge, the price straight away pump up the neckline.
On Thursday night before cpi result out, Pumpfun is doing a short fakeout setup and dump down.. But the price action pump up after 12am..
It is clearly how the market maker know doing a chart pattern.. As senior trader, we also know the chart pattern and have a very good experience one. Everything is in our blood.
But how is the market maker earn those expert money?
Lady and gentleman, let me present to you, Invalidation rising wedge. This is the perfect pattern to liquidate shorties and senior traders in the market. This will be the best way to outperform and get the most liquidity in the market..
There will be high possibilities market close green in next week. Watch it and see it and long it.
See you all guys.. If you like mine trading idea, please like, share comment and follow mine page. Thank you very much.

WANT TO BEAT THE MARKET WITH CONFIDENCE?? 🚀 Want to beat the market and trade with confidence?
Follow me for expert insights and clear setups!
Back in July, I called the #BTC Dominance top before anyone else and predicted the #alts season.
That move shifted billions in capital across the market; those who followed were ahead of the game! 🏆
Every week, I share exclusive #BTC outlooks and in, depth weekly market reports with over 90% accuracy and always ahead of the curve.
Today’s spotlight:
🗓 04/09 #BTC Dominance vs now… 🎯
Key support zone: | 53% |
If we break below this levels, get ready for a big shift of capital into #alts!
Join the community, stay one step ahead, and take your trading to the next level! 🔥

Falling Wedge Waiting To Breakout ? This looks like a falling wedge breakout is coming for btc. What do you guys think? 🤔
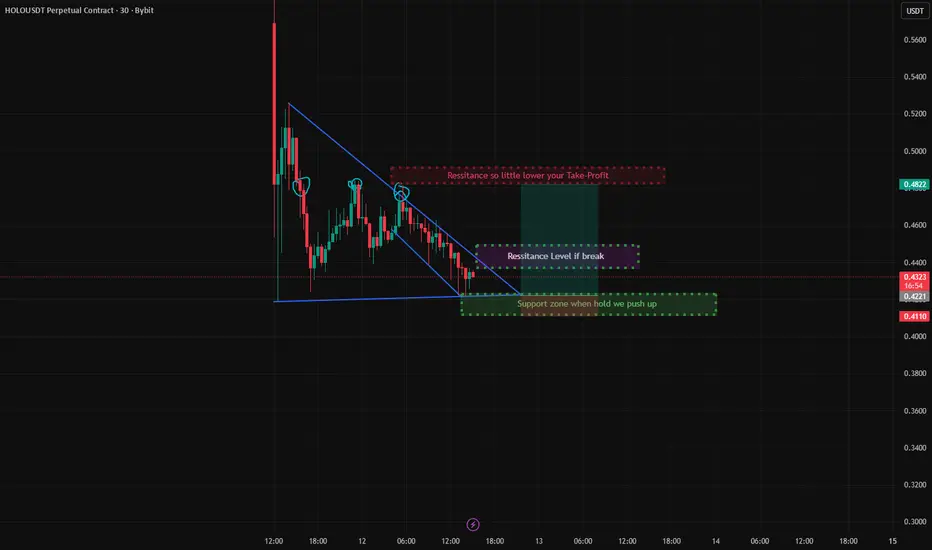
HOLO/USDT🔍 Key Technical Zones:
🔽 Descending Resistance Trendline: Price has touched and respected this level multiple times. A breakout above this trendline could signal a bullish move.
✅ Support Zone (Green Box):
Around $0.42 – price has held this level multiple times, forming the base of the wedge. A strong bounce from here increases bullish probability.
🔼 Immediate Resistance (Purple Box):
Around $0.45 – if the wedge breaks, this is the first resistance zone to watch.
🎯 Take-Profit Zone (Red Box):
Near $0.48 – a conservative TP area just below the major resistance zone to ensure filled orders.
🧠 Strategy Suggestion:
Entry idea: Consider long position on breakout above the descending wedge resistance with volume confirmation.
Stop-loss: Below the support zone ($0.42 or slightly lower).
Target: $0.45 to $0.48 area depending on risk appetite.
⚠️ Note:
Watch for false breakouts or wicks through trendlines.
Always manage risk — this is not financial advice.