ETH/USD – 30m | Descending Trendline Rejection & Critical RetestBITSTAMP:ETHUSD
Structure | Trend | Key Reaction Zones
ETH is facing heavy rejection from the descending trendline and showing lower highs (LH). Critical support zones are holding buyers for now, but momentum is tilted bearish.
Market Overview
After a sharp liquidity grab near 4490–4500, ETH rejected strongly from major resistance. Price is now retesting critical support zones, and sentiment suggests sellers remain active. Bears are in control unless support breaks or bulls reclaim higher levels.
Key Scenarios
✅ Bullish Case 🚀 → Break above 4362–4380 may extend recovery towards 🎯 4435 and 🎯 4490.
❌ Bearish Case 📉 → Failure at 4300 support may extend downside towards 🎯 4260 and 🎯 4215.
Current Levels to Watch
Resistance 🔴: 4362 / 4437 / 4490
Support 🟢: 4300 / 4260 / 4215
⚠️ Disclaimer: For educational purposes only. Not financial advice.
Wedge

XAUUSD Long: Upward Trend ContinuesHello, traders! The prior market structure for XAUUSD was dominated by a large consolidation wedge pattern. This period of balance was resolved with a decisive bullish breakout, which was subsequently confirmed by a retest of the 3440 demand zone. This successful test of former resistance as new support confirmed a structural shift in control to the buyers and initiated the current bullish phase.
Currently, the price has entered an acceleration phase. Following the breakout, a strong, impulsive rally has developed, which is now being guided by a steep ascending trend line. This indicates that the bullish initiative is in full control and the market is in a clear expansion phase, having left the prior consolidation area behind.
The primary scenario anticipates a continuation of this bullish momentum. Any minor corrective pullback towards the ascending trend line is expected to be met with renewed buying pressure, providing an opportunity to join the trend. A successful hold of this dynamic support would be the trigger for the next leg higher. The take-profit for this trend continuation is therefore set at 3600 points. Manage your risk!

GBPUSD – Supply Zone Bears on Watch!GBPUSD continues to trade within a broad descending channel on the 4H timeframe. Price is approaching a well-defined supply zone that aligns with the upper red trendline resistance.
📉As long as this area holds, sellers are expected to step in, making it a high-probability zone to look for short setups.
A rejection from this level could push price back toward the lower boundary of the channel, keeping the bearish structure intact. Traders should stay cautious and watch for confirmation signals before engaging.
⚠️ Always remember: patience pays. Let the market come to you.
📚 Always follow your trading plan regarding entry, risk management, and trade management.
Good luck!
All Strategies Are Good; If Managed Properly!
~Richard Nasr

Bullish Wedge On GoldGold keeps on showing a very strong momentum for buy, confirmed by a bullish wedge pattern. A very good opportunity for taking buy signal with a tp @3.602

GOLD → The uncertainty factor before the news. Down / up?FX:XAUUSD after updating another high to 3578 went into the phase of profit taking before two busy news days. The trend is aggressively bullish, but the risks of correction are quite high due to the uncertainty factor....
The price pulled back from record highs amid profit taking and reduced panic in the bond market. The dollar stabilized, but remains under pressure due to expectations of Fed rate cuts this year. The key event will be the publication of US employment data (NFP) on Friday.
A correction after a sharp rise is a natural reaction, but the expectation of Fed policy easing is supporting the metal's price.
Geopolitics: Trade risks (Trump's tariffs) mitigate gold's fall.
Gold's correction so far looks like a pause before further movement. The main driver is NFP data, which will determine Fed rate sentiment and USD direction. But, today all eyes are on ADP Nonfarm, Initial jobless claims, and ISM data. Unexpected data may intensify the sell-off....
Resistance levels: 3546, 3559, 3563
Support levels: 3526, 3508
It is difficult to determine the news reaction in advance, we will have to orient ourselves after the fact. Technically, I expect a deeper correction for a healthy market. I expect a retest of the 3560 zone and further decline to local liquidity zones.
Regards R. Linda!

AUDNZD: Pullback From Support Confirmed 🇦🇺🇳🇿
There is a high probability that AUDNZD will rise from the underlined support.
A bullish violation of a resistance line of a bullish flag pattern on an hourly
time frame provides a reliable confirmation.
Goal - 1.1133
❤️Please, support my work with like, thank you!❤️
I am part of Trade Nation's Influencer program and receive a monthly fee for using their TradingView charts in my analysis.

XAUUSD (8H)Breakout Momentum & Bulls in Control|SELLER OR BUYER?FOREXCOM:XAUUSD
Structure | Trend | Key Reaction Zones
Gold broke above the 3450–3500 resistance zone with strong momentum. This breakout is now confirmed, and bulls remain in full control. The next upside extension points towards the 3570–3600 zone.
Market Overview
After several accumulation phases and liquidity grabs, price built a strong base. Buyers stepped in aggressively from the 3405–3450 area, turning it into solid support. With breakout momentum active, the trend remains bullish. Pullbacks towards 3450–3500 could act as healthy retests before further continuation.
Key Scenarios
✅ Bullish Case 🚀 →
🎯 Target 1: 3570
🎯 Target 2: 3600
🎯 Extended: 3650
❌ Bearish Case 📉 →
🎯 Downside Target 1: 3450
🎯 Downside Target 2: 3405
Current Levels to Watch
Resistance 🔴: 3570 – 3600
Support 🟢: 3450 – 3500
⚠️ Disclaimer: This analysis is for educational purposes only. Not financial advice.

HBAR - bullish structure daily & Monthly!🟢 #HBAR - Price Analysis
🔼 Possible Ascending Triangle on monthly (see last chart!)
🟣 Weekly structure looks healthy, clean 50% fib retest at $0.2100
⚡️ Technically:
Bull flag in play if support holds here!
Possible next leg up loading 📈
Watching for a retest of the monthly resistance (triangle zone)
Short Term:
→ Neutral zone: $0.2250 – $0.2100
→ Big upward move possible on resistance break.
→ Risk: Daily close under $0.2100 would flip momentum bearish!
💡 Keep an eye on the upper daily trendline!
HTF Resistances: $0.2680 | $0.2700 - $0.2900 - $0.400
Key zones all mapped out on my charts 👀

Bearish setup on SEI!🚀 As you know, I'm very bullish on NYSE:SEI !
→ AUG 28: BREAKING - 21Shares files S-1 with the SEC for a SEI ETF📈
→On-chain volume is exploding, growth is exponential!📈
→Clean falling wedge structure forming on H4📈
→Daily Ichimoku retest area in play✅
Adoption is coming = More revenues, more investment, more devs → price up! 🚀
🧠 Not financial advice, just sharing my research so you can make informed bets!I do the digging, you make the decision.
Key setup: Valid > $0.2650 on daily close.

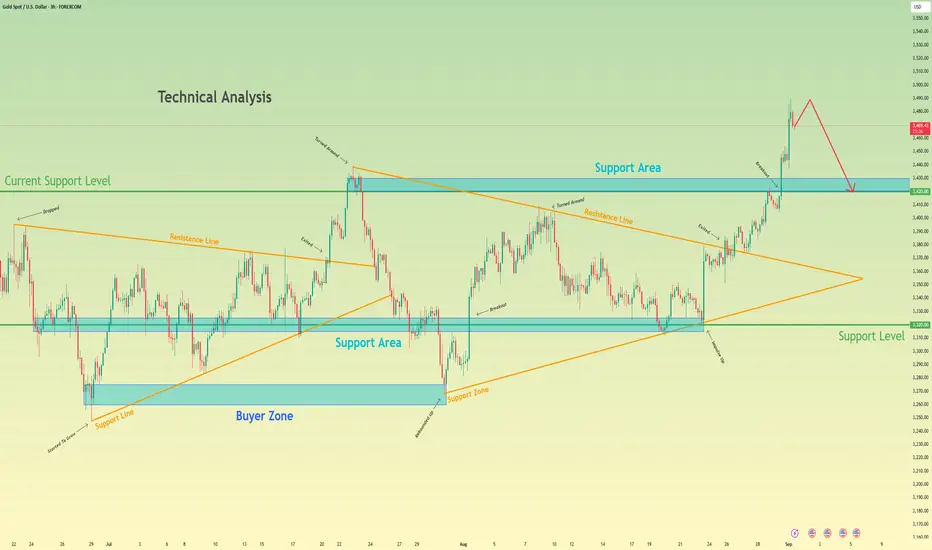
Gold may make correction, after strong upward movementHello traders, I want share with you my opinion about Gold. The prolonged period of consolidation for Gold has decisively resolved to the upside, following a powerful breakout from a multi-week symmetrical wedge. This event signalled a clear shift in market control to buyers, invalidating the prior ranging environment and initiating a new, impulsive bullish phase. The price action for XAU since the breakout has been characterised by a strong, high-momentum rally that has pushed the asset to new highs. Currently, this upward movement appears to be overextended, suggesting that the market may be due for a healthy corrective pull-back. The primary working hypothesis is a short, counter-trend scenario designed to capture this anticipated correction. The expectation is that the current rally will soon find a peak, exhaust itself, and undergo a sharp decline back towards the breakout point. This corrective fall would be a natural part of a healthy uptrend, allowing the market to test the old resistance as new support. Therefore, the TP is logically placed at the 3420 level. This target is highly significant as it corresponds precisely with the current support level and the support area where the breakout originated. Please share this idea with your friends and click Boost 🚀
EURCHF: Move Up Ahead?! 🇪🇺🇨🇭
I see a strong bullish pattern on EURCHF on a daily:
the price broke and closed above a resistance line of a bullish
flag pattern after a test of a critical demand zone.
With a high probability, growth will continue soon.
Next resistance - 0.9393
❤️Please, support my work with like, thank you!❤️
I am part of Trade Nation's Influencer program and receive a monthly fee for using their TradingView charts in my analysis.

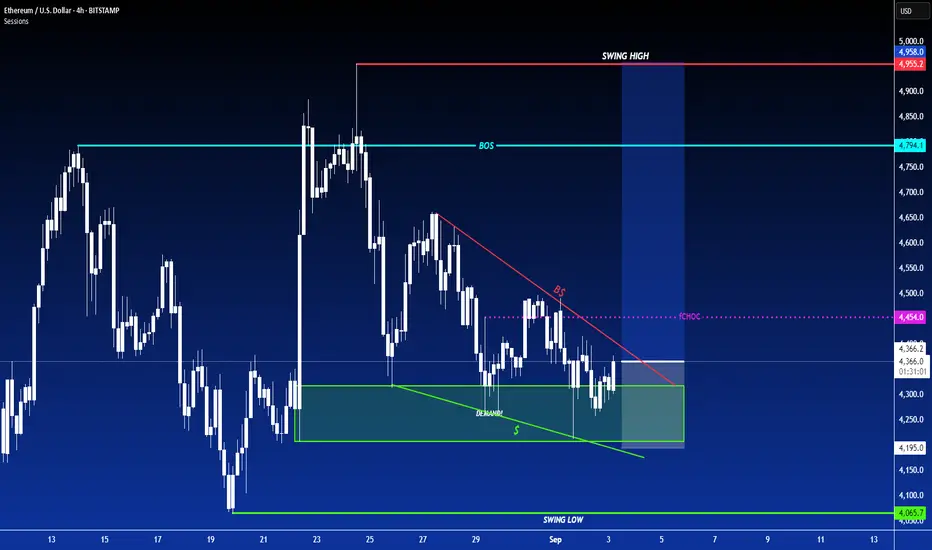
LONG ON ETH/USD ETHEREUMEthereum has a nice falling wedge into a major demand zone.
I will be taking ETH as a market buy now looking for price to reach 5000
making over 500 points to the previous High.
GBPNZD → Retest 2.276 before resuming the bullish trend FX:GBPNZD is testing a key support level as part of a correction after breaking through consolidation resistance. The trend is bullish, and liquidity capture could resume the upward movement.
GBPNZD is testing a strong support level within the uptrend during the correction phase. Against the backdrop of the long-term decline of the NZD, the currency pair has every chance of continuing to grow.
On the daily timeframe, we have a fairly strong upward structure, with the previously broken consolidation resistance and the 0.5f area playing a key role. This tandem hides a liquidity area that could become a driver for the market. A false breakdown of 2.276 could trigger a resumption of growth.
Support levels: 2.276, 2.2682
Resistance levels: 2.2983, 2.3215
The bullish trend may support the main trend. The current correction is a healthy movement within an uptrend that may continue after a pullback and consolidation.
Best regards, R. Linda!

EUR/USD | Triangle Formation |EUR/USD – Symmetrical Triangle Formation | Elliott Wave Count (ABCDE)
Price action is currently developing within a symmetrical triangle pattern, with waves a–b–c–d–e in play.
Demand Zone (Buyers Zone): Price recently tapped into demand, showing bullish reaction.
Supply Zone 2 (1.1687): Acts as a key resistance level for short-term targets.
Wave Structure: The market is respecting Elliott Wave triangle formation, suggesting a possible bullish breakout after wave e completes.
Plan: Expect consolidation within the triangle before a potential push toward 1.1687. Break and close above may confirm continuation; failure could lead to retest of lower support levels.
📊 This setup aligns with both Elliott Wave theory and supply-demand dynamics, offering clear short-term trading opportunities.

EURUSD (1H) – Pullback Into Demand Zone, Key Decision AheadFOREXCOM:EURUSD
Structure | Trend | Key Reaction Zones
Price recently broke out of a rising channel, retracing sharply back into the demand zone (1.1610 – 1.1630). The structure still holds higher lows (HL) but faces resistance near 1.1680.
Market Overview
After strong bullish momentum towards 1.1740, EURUSD rejected at major resistance and is now consolidating lower. The demand zone will act as a make-or-break level. A bounce may confirm bullish continuation, while a breakdown could extend bearish momentum.
Key Scenarios
✅ Bullish Case 🚀 →
🎯 Target 1: 1.1680
🎯 Target 2: 1.1720
🎯 Extended: 1.1743
❌ Bearish Case 📉 →
🎯 Downside Target 1: 1.1610
🎯 Downside Target 2: 1.1580
🎯 Extended: 1.1574
Current Levels to Watch
Resistance 🔴: 1.1680 – 1.1720
Support 🟢: 1.1630 – 1.1610
⚠️ Disclaimer: This analysis is for educational purposes only. Not financial advice.

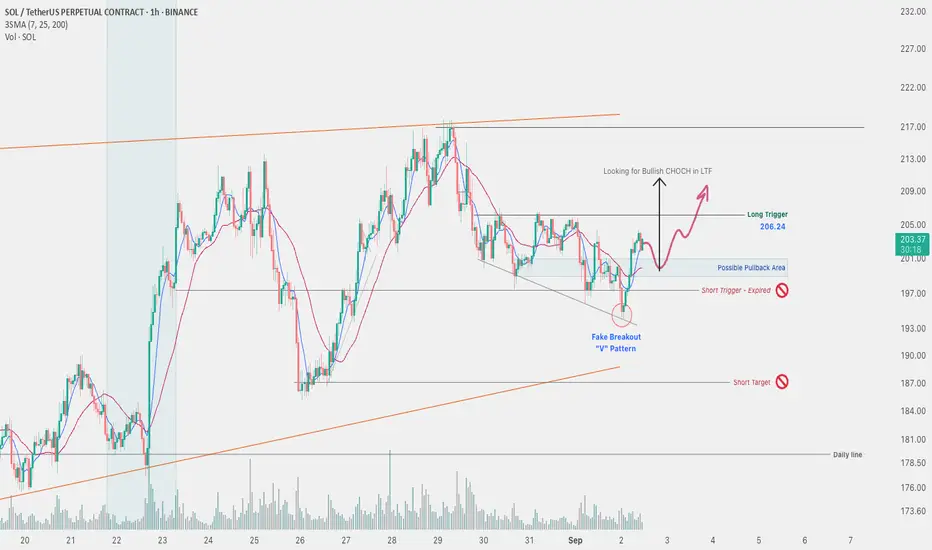
Sep 2, 2025 - SOLUSDT 1H Chart Analysis-01Despite the broader long-term uptrend in Solana, yesterday I was considering a risky short position on one of the altcoins and had already defined the triggers. Fortunately, the short trigger was broken while I wasn’t monitoring the chart, so no position was opened.
The positive development is that we saw a fake breakdown of the 197.36 support zone. After collecting liquidity below this level, Solana initiated a strong bullish move.
I’ve marked the long trigger at 206.24. However, for an early entry ، if I spot a market structure shift in the pullback zone, I’ll scale in with a partial position. Then, if the main level breaks, I’ll add more volume to the trade.
I will also check my entries with the SOLBTC chart for more confirmation
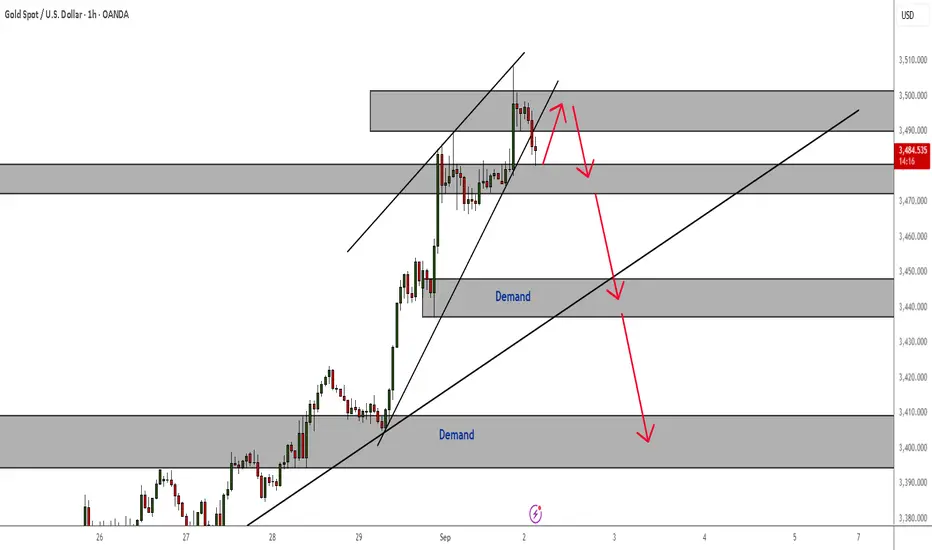
Gold Break of All Time Highs May Lead to A RetracementNow that ATHs have been claimed, it might be time for a pullback.
Wait for a retest of that broken trendline support or a break of that support structure highlighted on the H1 time frame and begin to target demand zones as price steadily moves to the downside.
AVALANCHE - GOOD ENTRY FOR LONG SWING TRADE, 100%+AVALANCHE (AVAX) - Layer 1 blockchain, that functions as a platform for decentralized applications and custom blockchain networks. It is one of Ethereum’s rivals, aiming to unseat Ethereum as the most popular blockchain for smart contracts. It aims to do so by having a higher transaction output of up to 6,500 transactions per second while not compromising scalability.
Looking for an entry around $25 and exit around $50 on spot for a nice 2x. Its possible for price to move a bit lower in the short term depending on overall crypto market, however this is a good swing trade and any lower entry would be a better entry. You can wait for bullish volume and a catalyst if you feel its risky, or overall crypto/altcoin sentiment to increase.

EVER potential runnerI believe insurance will be a great spot in 2026, especially if there is a mix of growth stocks in your spread of exposure. Between Oscar and other hot names, I believe EVER might actually be less risky. The company is partnered with major insurance companies, including Liberty Mutual, Progressive, The General, Root, and more. This company helps originate. The company pre-validates potential high-intent customers. They also align them with the partnered insurance companies' requirements ahead of time, which gives them expanding margins.
Technically, we note a wedge ready to break out on rising volume. BBWP has bottomed, so expansion is likely soon. RSI has had a meaningful reset. Most importantly, the stock has corrected to the golden pocket, a key area for large buyers—the golden pocket lands between the .5 and .618 (golden fib).
I will enter shares here since this small-cap's option chain is not mature.

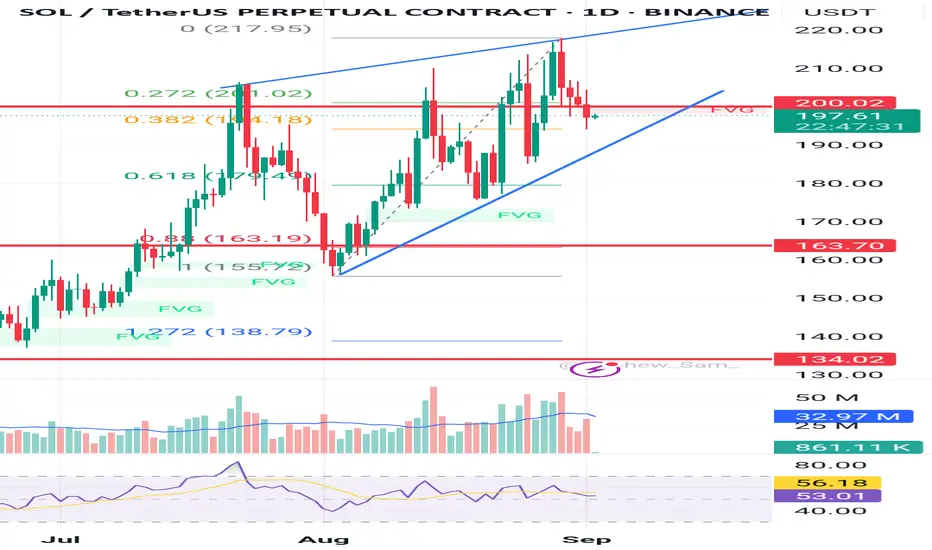
Rising wedge solMusic look like stopping soon.
Sol have High possibilities breakout from this rising wedge pattern in daily chart soon.
Any long position is good to take profit for spot and futures trader.
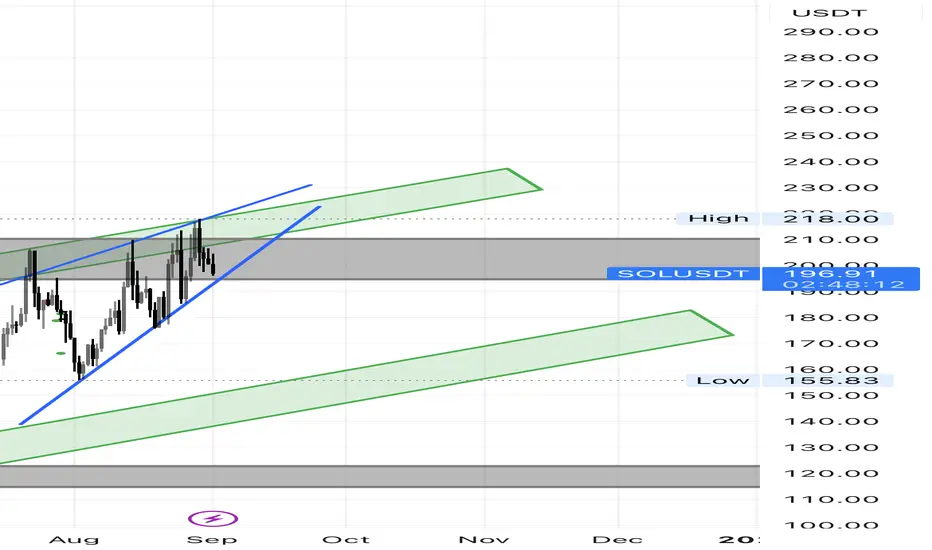
Is SOL about to drop SOL is now making a mini rising wedge inside the weekly resistance zone. Once SOL breaks out of this wedge it might lead to a new down trend before finding support at around $150-$120 before it begins to go back up to possibly around $230 or more, It depends on the momentum of the move.
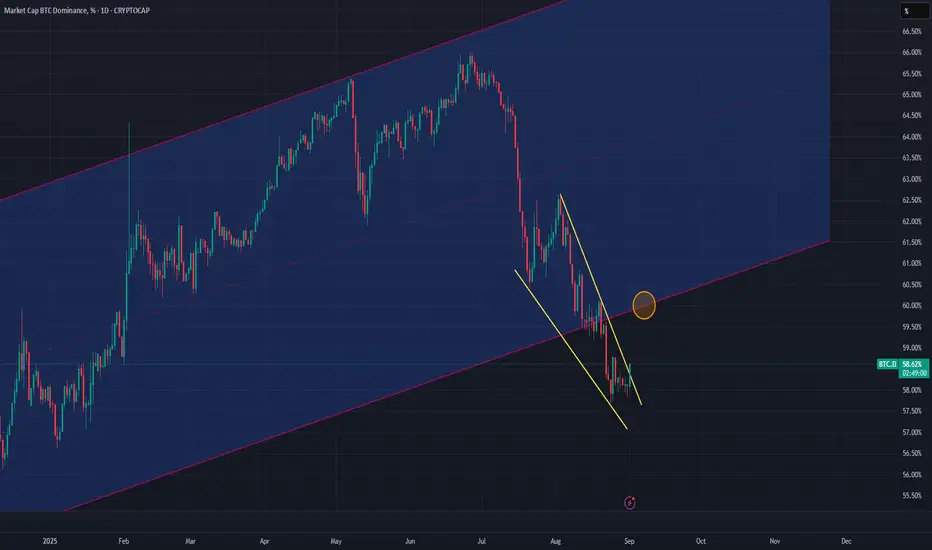
BTC Dominance - Wedge Pattern BTC Dominance (BTC.D) chart broke out of a long term parallel channel in late Aug 2025. Chart was forming a wedge pattern which has now broke out towards upside.
Chart is expected to retrace up to bottom trendline of the parallel channel (from where it initial broke out) around 60%.
This in turns means that we should expect some bearish price movements across all alt coins.
Once BTC.D chart hits 60%, it will continue its downward trend.
XAUUSD (15M) – Price Compression Near Trendline,Breakout LoadinGFOREXCOM:XAUUSD
ChatGPT said:
Perfect, Yash 👍 Let’s prepare the dual format description for XAUUSD (15M) exactly in your locked style.
📊 TradingView Version (Professional & Clean)
XAUUSD (15M) – Price Compression Near Trendline, Breakout Loading ⚡
Structure | Trend | Key Reaction Zones
Gold is compressing between resistance and short-term demand, showing LHs at the top and LLs near 3,465. Price is coiling for a breakout.
Market Overview
After sellers rejected 3,489, XAUUSD has been trapped in a narrowing range, forming lower highs but holding demand near 3,465. Momentum is weakening, and traders should watch closely for a breakout resolution from this triangle compression. A bullish push above 3,481 can trigger upside continuation, while failure below 3,472–3,465 risks further decline.
Key Scenarios
✅ Bullish Case 🚀 →
🎯 Target 1: 3,478
🎯 Target 2: 3,481
🎯 Target 3: 3,489
❌ Bearish Case 📉 →
🎯 Downside Target 1: 3,472
🎯 Downside Target 2: 3,465 (Critical Support)
Current Levels to Watch
Resistance 🔴: 3,478 → 3,481 → 3,489
Support 🟢: 3,472 → 3,465
⚠️ Disclaimer: This analysis is for educational purposes only. Not financial advice.
