Breakout from falling wedge pattern?I think as soon as the EMA crossover VWMA occurs on the 1D that we will see a breakout from here. 1D macd bullish signal already occured in the meanwhile. Bulls are back!
Wedge

BITCOIN bounceBitcoin broke down from the long-term rising wedge and now could bounce to around 110k before deciding whether to go higher or enter a new bear market.

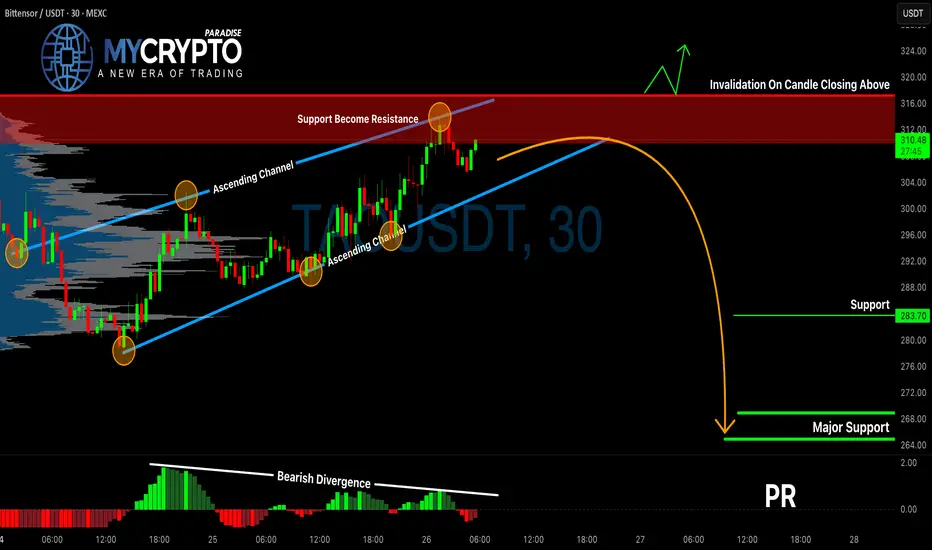
TAOUSDT Is Flashing a Dangerous SignalYello Paradisers, is this the calm before a major move down on TAOUSDT? The current setup is raising multiple red flags, and ignoring them could be a costly mistake.
💎TAOUSDT has formed an ascending channel, but what's critical to note is the bearish divergence on the MACD histogram, aligning perfectly with the previous support-turned-resistance zone. This combination of technical signals often precedes a breakdown, increasing the probability of a bearish move from current levels.
💎If the price pulls back slightly and prints a bearish candlestick pattern near this resistance zone, that would signal a high-probability short opportunity. The confluence of structure and momentum weakness offers a favorable risk-to-reward setup for traders who remain patient and disciplined.
💎However, if TAOUSDT breaks out and closes decisively above the invalidation level, the bearish outlook would no longer be valid. In that case, the best move is to step aside and wait for a stronger, more reliable setup to form before jumping back in.
🎖Strive for consistency, not quick profits. Treat the market as a businessman, not as a gambler. The market rewards patience, discipline, and strategy—never emotion.
MyCryptoParadise
iFeel the success🌴
AUDNZD at a critical support levelRisky play here but the potential upside is immense. With AUD CPI just dropping hotter at 3.8% vs 3.6% forecast and NZD lowering interest rate, again, this time by 25bps, the liquidity sweep that followed on the pair could be a gift for longs. The RSI is overbought on the daily, and has been due for a correction however fundamentals are screaming for a continuation of the upward move. Currently sitting sitting at a key uptrend support of a large pennant and the daily 50SMA simultaneously. If one were to play this pair, tight SL should be a priority. Anything can happen, nothing is certain.

It's BLACK FRIDAY on Altcoins (ENA/USDT)Global multi-billion dollar altcoin market currently on support.
Many altcoins showing life after OVERSOLD for a while.
Grab some ENA and let it ride including TP prices such as 0.3450 - 0.5125 and 0.8100 as FINAL target.

Crypto might still have gas in the tankAn equal-weight basket of popular cryptos is forming a descending wedge (bullish) on the 4 hour chart.
There's also a very mild uptick in momentum.
I wouldn't take excessive risk here, potentially add on dips to cryptos you have strong conviction on, and don't be surprised if we really are at the end of the cycle.

CHF/JPY: Bearish Outlook ExplainedCHFJPY appears to be showing bearish tendencies following a test of a significant intraday resistance level.
The price has broken and closed below the support of a rising wedge pattern, and we are observing considerable bearish pressure this morning.
It is possible that the price may soon reach the 193.36 level.

XAUUSD INTRADAY – Breakout + Retest Reaction SetupFOREXCOM:XAUUSD
Key Scenarios
✅ Bullish Case (Primary Bias)
If price holds the 4060–4070 retest zone and prints bullish confirmation, buyers may target:
🎯 1st Target: 4105–4112
🎯 2nd Target: 4150–4165
This scenario remains valid as long as price stays above 4040.
❌ Bearish Case (Invalidation Trigger)
If price fails to hold above 4040 and breaks below the demand zone, a deeper sell-side expansion may follow toward:
Only a clean break below 4040 shifts sentiment bearish.
Current Levels to Watch
Supply Zone: 4060–4075
Support Zone / Entry Interest: 4045–4040
Key Demand: 4025–4035
Major Resistance: 4165–4175
⚠️ Disclaimer:
This analysis is for educational purposes only. It is not financial advice. Please manage risk and trade based on your own strategy.

$ETH looks MAJORLY BULLISH for 2026CRYPTOCAP:ETH has been stagnant this entire year, performing very poorly related to CRYPTOCAP:BTC
However, CRYPTOCAP:ETH will have its day. It looks majorly bullish fundamentally leading into 2026, and the chart checks out as potentially very bullish setup.
As you can see, CRYPTOCAP:ETH closed above the .618 the past few days from the range dating back to April 2025. It also is channeling down in a falling wedge.
What is interesting is Ethereum's recent strength relative to Bitcoin. It looks stronger than CRYPTOCAP:BTC and I believe the narrative majorly shifts from BTC to ETH next year. The chart is primed for an absolute explosion and the suppression of it this year reminds me of the BTC suppression that happened in 2022 as institutions and whales had their fill (bought a ton).
Keep an eye on Ethereum into 2026, but the chart screams she is ready to rip with a proper push. If we break out of this falling wedge and retest it with volume, get ready to fuel the jets because Ethereum has not had a proper run since 2021.
It is quite likely it will be a keystone to the digitalization of our society and world via the blockchain. No other coin or company can compete. ETH is about to have its day in the sun.

USDCHF - Getting OverBought!📈USDCHF remains overall bullish in the medium term , but price is now approaching a major confluence resistance where caution is needed. The upper bound of the wedge pattern lines up perfectly with the red supply zone, an area that has rejected price multiple times in the past.
📉As USDCHF moves into this intersection, we will be looking for sell setups, expecting the bears to step in and defend this zone. A rejection from here could trigger a corrective move back toward the lower trendline and the green support zone.
Only a clean break and hold above the red zone would invalidate the bearish outlook and allow the bullish momentum to continue.
For now, sellers have the upper hand as we approach this key resistance… will they take control again? 🤔
⚠️ Disclaimer: This is not financial advice. Always do your own research and manage risk properly.
📚 Stick to your trading plan regarding entries, risk, and management.
Good luck! 🍀
All Strategies Are Good; If Managed Properly!
~Richard Nasr

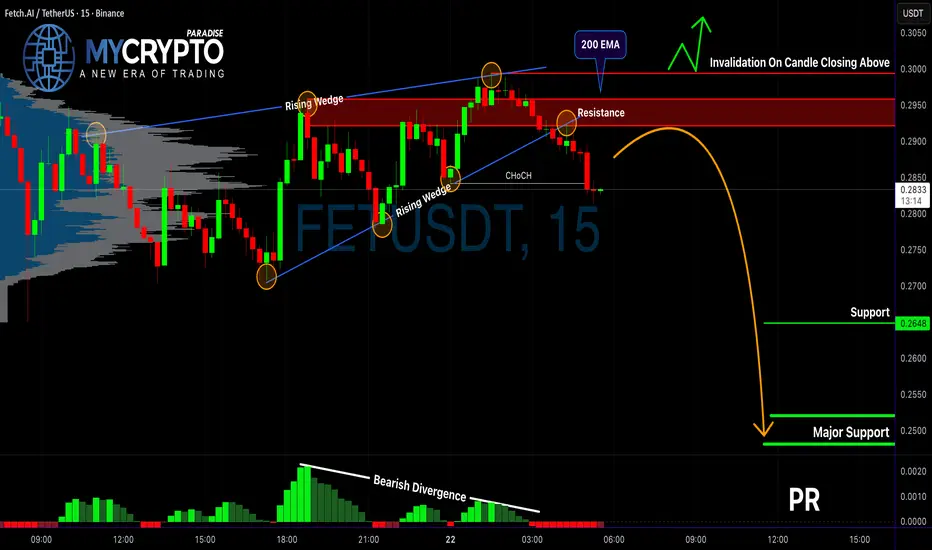
FET Breakdown: Is a Major Dump Just Getting Started?Yello, Paradisers! Have you seen what just happened on FET/USDT? The chart is flashing multiple warning signs, and if you’re not paying close attention, you could get caught on the wrong side of the next big move. Let’s break it down.
💎FETUSDT has officially broken out of a rising wedge pattern—a well-known bearish structure. This breakdown didn’t happen in isolation. It was accompanied by a clear bearish divergence, showing that while the price pushed higher, the underlying momentum was already fading. That’s a red flag for anyone still thinking bullish.
💎More importantly, price action has shown a bearish Change of Character (CHoCH), confirming a potential shift in the trend direction. On top of that, the recent rejection came precisely from the 200 EMA and a known resistance zone, both of which have historically acted as key turning points. When these factors align, they significantly increase the probability of a deeper move to the downside.
💎If the price pulls back from here, the smarter move is to wait for a bearish candlestick pattern to form right at the resistance zone. That would give a cleaner entry with stronger confirmation and a higher reward-to-risk ratio. While aggressive traders may be tempted to enter from current levels—where a 1:1 RR still exists—this is not a sustainable strategy over the long run. Discipline and patience are key if you want to stay consistently profitable.
💎However, if the price breaks out above our invalidation level and closes with conviction, the bearish setup becomes invalid. In that case, it’s best to step aside and wait for more favorable price action to form. There’s no need to rush; missing a trade is always better than forcing one with poor structure.
🎖Strive for consistency, not quick profits. Treat the market as a businessman, not as a gambler.
MyCryptoParadise
iFeel the success🌴
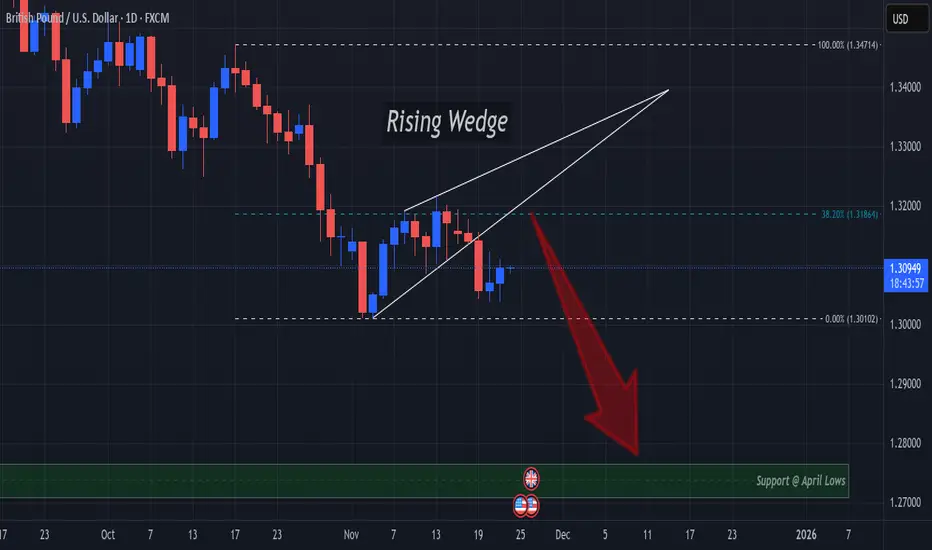
Rising Wedge Breakout Spells Decline Continuation For GUFX:GBPUSD delivered a Breakout of A Rising Wedge to end the week last week!
Next, we should suspect a Retest of this Breakout @ the 38.2% Retracement level around 1.31864.
This level proved to hold price below it through the formation of the pattern and would serve as a great area of opportunity to short the pair and ride Price down!
If the Retest of the Breakout is successful, Price would next find Support at the April Lows around the 1.28 - 1.27 area!
Fundamentally its a heavy week for USD with events for GBP littered throughout so keep a close eye on how the results end up affecting the markets!
Bitcoin Bear Market 2026 | Macro Cycle & Rising Wedge BreakdownBitcoin Macro Cycle Analysis (2013–2029) | Rising Wedge Breakdown • 2026 Bear Market Targets • Historical % Drops & Next Accumulation Zone
Bitcoin historical data strongly follows multi-year macro cycles , where each bull market has been followed by a deep bear market correction:
📉 2nd Cycle (2017–2018)
Top: 19,666 (17 Dec 2017)
Bottom: 3,122 (15 Dec 2018)
Correction: –84.23%
📉 3rd Cycle (2021–2022)
Top: 68,997 (8 Nov 2021)
Bottom: 15,479 (9 Nov 2022)
Correction: –76.64%
📉 4th Cycle (2025–2026 – Ongoing)
Top: 126,272 (6 Oct 2025)
Rising Wedge + Distribution Phase breakdown confirms bearish structure shift
Based on historical cycle behavior and on-chain indicators, Bitcoin has entered the 4th major bear market
📍 Projected Bottom Zone (2026)
Primary Support Zone:
➡️ $40,000 – $42,000 – $45,382
(Aligned with Wedge Breakdown + Macro Support)
Percentage-Based Targets:
–68.16% drop: → ≈ $40,000
–74% historical drop scenario: → ≈ $31,000 (max capitulation zone)
📅 Expected Bottom Window:
September – October 2026
→ Historically the strongest long-term buying opportunity .
📈 5th Cycle Expectations (2026–2029)
Bitcoin has been following a Long-Term Rising Wedge (Bearish Continuation / Reversal Pattern) since 2021.
This pattern is expected to fully complete by April 2029 → leading into a new long-term top and then the 5th bear market .
⭐ Why This Analysis Matters
Combines **cycle history**, **on-chain metrics**, **pattern analysis**, and **macro support zones**
Helps identify high-probability long-term Bitcoin accumulation levels
Useful for swing traders, long-term investors, and cycle-based portfolio strategies
🔔 If You Find This Analysis Helpful
👍 Like • 💬 Comment • ⭐ Save
It motivates me to share more high-quality Bitcoin cycle research!

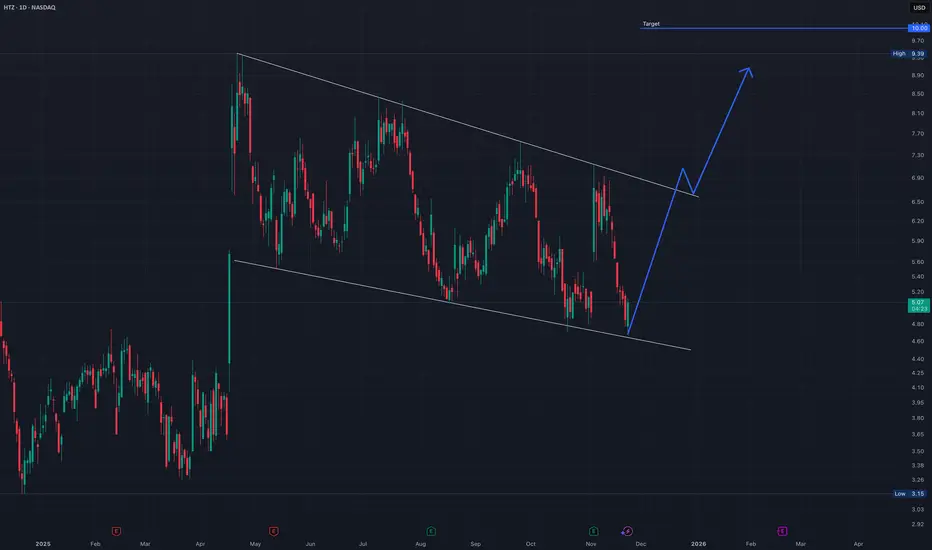
HTZ | Falling Wedge Reversal Setup - Breakout Toward $10Hertz Global Holdings (HTZ) is currently trading at the lower boundary of a well-defined falling wedge pattern, a structure that often signals a potential bullish reversal. The price has once again touched the wedge’s support line, showing early signs of reacting from this level. This repeated defense of support suggests that sellers may be losing momentum as the range continues to narrow.
If HTZ maintains support at this lower trendline and begins to push higher, the next key level to monitor is the upper wedge resistance. A confirmed breakout above that level may trigger a shift in trend, opening room for a measured move toward the $10 target area, which aligns with previous highs and the projected wedge breakout objective.
While the trend is still technically down, the structure of the wedge combined with the current bounce setup provides a constructive environment for a possible reversal. Confirmation and healthy volume on the breakout will be essential to validate the move.
(This idea is for educational purposes only, not financial advice.)
Iluniam: Stablecoins 2.0 — 8–15 % APY with Zero Volatility RiskWhile the broader crypto market is going through one of its sharpest corrections of the entire cycle — Bitcoin down 17 %, Ethereum down 22 %, and most major altcoins bleeding 30–45 % in just two weeks — there exists an asset class that not only refuses to drop, but is currently paying the highest real, predictable yield we have seen in the past 26 months.
We are talking about the new generation of stablecoins and proven classics (USDT, USDC, DAI, USAT, USDY, USDe, USDM) that in November 2025 are delivering 8–15 % annualised returns completely insulated from price volatility.
This is not marketing hype.
This is cold, hard, on-chain verifiable income that is being paid out daily and weekly to millions of wallets right now — while the rest of the market is red.
The reason is simple:
The November correction has driven massive capital flight into safety → lending protocol volumes surged +38 % in the last 14 days alone.
U.S. Treasury yields remain elevated (3-month T-bills ≈ 4.9–5.1 %), and every protocol backed by treasuries or repo agreements is mechanically passing that yield straight to users.
Centralised exchanges and DeFi platforms are in a fierce liquidity war — they are temporarily boosting rates to historic highs to attract stablecoin deposits before year-end.
In short: right now stablecoins are the highest-yielding truly risk-free asset class in the entire crypto and traditional finance space.
Top 7 Stablecoin Yield Opportunities Right Now (Iluniam data, 18 November 2025)
USAT (Ampleforth Treasury) — 14.7–15.3 % APY
Backing: 100 % short-term treasuries + repo
Platforms: Pendle (USAT pool), Morpho Blue
Risk level: minimal (1:1 overcollateralized)
USDY (Ondo Finance) — 13.1–14.4 % APY
Backing: treasuries + BlackRock BUIDL integration
Platforms: Ondo direct, Pendle, Sky (ex-Maker)
Bonus: Coinbase listing confirmed for December
USDe (Ethena) + sUSDe staking — 11.8–13.2 % APY
Strategy: delta-neutral (spot + perpetual short)
Platforms: Ethena, Symbiotic
Risk: medium, but covered by a $400 m insurance fund
USDC on Coinbase Advanced — 11.2 % APY
Simple deposit, no lock-up, instant withdrawal
FDIC insurance up to $250 k on fiat portion
USDT on Bybit Earn — 10.5–11.8 % (flexible + 30-day locked)
Up to 15 % bonus for new deposits until 30 November
USDM (Mountain Protocol) — 10.1–10.9 % APY
Backing: 100 % treasuries, fully regulated (Bermuda)
Platforms: Mountain + Curve
DAI in Sky (ex-Maker) + Spark — 8.4–9.8 % APY
The most decentralised option, DSR + Spark lending
Risk vs Reward Comparison (Iluniam Risk Score 1–10)
StablecoinAPYRisk (1–10)LiquidityBacking / InsuranceUSAT14.7–15.3 %2High100 % treasuries + repoUSDY13.1–14.4 %2HighBlackRock BUIDL + treasuriesUSDe11.8–13.2 %5High$400 m insurance fundUSDC (Coinbase)11.2 %1InstantFDIC + Circle reservesUSDT (Bybit)10.5–11.8 %4HighTether reserves
Iluniam Recommendation for November–December 2025
Conservative capital (70–100 %):
USAT + USDY + USDC → average 12.8–14.1 % APY at near-zero risk
Aggressive slice (20–40 %):
USDe + Pendle PT-USAT (fixed 16–18 % until March 2026)
Why this beats simply holding BTC/ETH right now
Yield is guaranteed and compounds daily/weekly
Zero exposure to downside volatility (you earn while the market bleeds)
Full liquidity — exit anytime and buy assets 10–20 % cheaper when the dip ends
Final Word from Iluniam
November 2025 is not a time to panic over red charts.
It is the best moment in the past two years to park part of your capital in Stablecoins 2.0 and collect 8–15 % real yield while waiting for the next leg up.
We have already allocated 68 % of our clients’ free cash into these exact protocols — and they are earning every single day.
Want the same result without wasting time searching?
The complete “Stablecoins 2.0 — Where and How to Earn 15 % in November” guide is already available in the private Iluniam channel.


Bearish Rising Wedge - BITCOINHello traders,
Bitcoin has broken both the rising wedge support line and the key support zone (98,225 – 101,000).
This breakdown signals a potential bearish continuation.
📉 TARGET: 80,850.00

Rising Expanding Wedge BreakdownI’ve spotted this expanding wedge pattern on the Nasdaq and there is probably more downside imminent for the Nasdaq. I'm sure this isn’t new to most of you. A bearish price target around 23,000 (for now) is highly likely. Long-term I remain bullish (see my other ideas), but right now the extreme fear is handing control to the bears for a while.

NZDUSD: Bearish Trend Continues 🇳🇿🇺🇸
NZDUSD is trading in a bearish trend on a daily.
The market finally completed a correctional movement yesterday,
forming a bearish imbalance candle and setting a new lower low
lower close with a confirmed BoS.
We can expect another wave lower.
Next support will be 0.56.
Look for selling after a completion of a pullback.
❤️Please, support my work with like, thank you!❤️
I am part of Trade Nation's Influencer program and receive a monthly fee for using their TradingView charts in my analysis.

bitcoin Outlook after the Dip. What to expect NOW?After breaking out of the descending wedge, the price has reached a very strong PRZ (Potential Reversal Zone) support area. If the price holds this zone, there is hope for a rebound toward new highs. However, if this support fails, the price could drop below $70,000.
CADJPY - Overbought at Resistance… Correction Ahead?⚔️CADJPY is approaching a major rejection zone around 111.00 , which aligns perfectly with the upper bound of the rising channel. Price is also showing clear overbought behavior, making this area a critical decision point for the next move.
For now, the pair remains overall bullish, trading inside a clean ascending structure. However, the current location leaves CADJPY vulnerable to a corrective move as long as the 111.00 resistance continues to hold.
If the bulls manage to break and hold above 111.00, the momentum could extend toward higher highs. But if the resistance rejects price again, we can expect a move back toward the lower trendline of the channel to reset the structure.📉
The market is now at a key inflection zone… will 111.00 act as a ceiling or fuel the next breakout? 🤔
⚠️ Disclaimer: This is not financial advice. Always do your own research and manage risk properly.
📚 Stick to your trading plan regarding entries, risk, and management.
Good luck! 🍀
All Strategies Are Good; If Managed Properly!
~Richard Nasr.

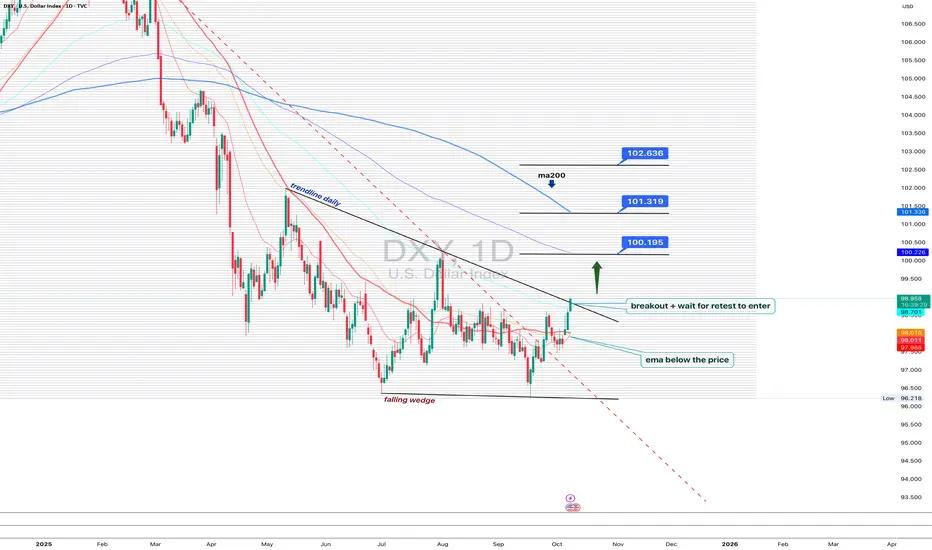
DXY 1D - dollar waking up, but patience is keyOn the daily chart, the US Dollar Index is showing the first signs of recovery: a falling wedge breakout and trendline breach hint that bulls are slowly reclaiming control. Price has moved above the EMA, a short-term bullish signal.
Still, MA200 remains above, reminding us that the broader trend is not yet flipped. The ideal play here - wait for a retest of the breakout trendline to confirm buyers’ strength before jumping in.
If price holds above 99.70, the next upside targets sit around 100.19, 101.31, and 102.63.
But keep in mind - DXY loves to test patience. False breakouts are its favorite sport.
Right now, the dollar looks ready to wake up, but maybe hit the snooze button one last time before the real move begins.
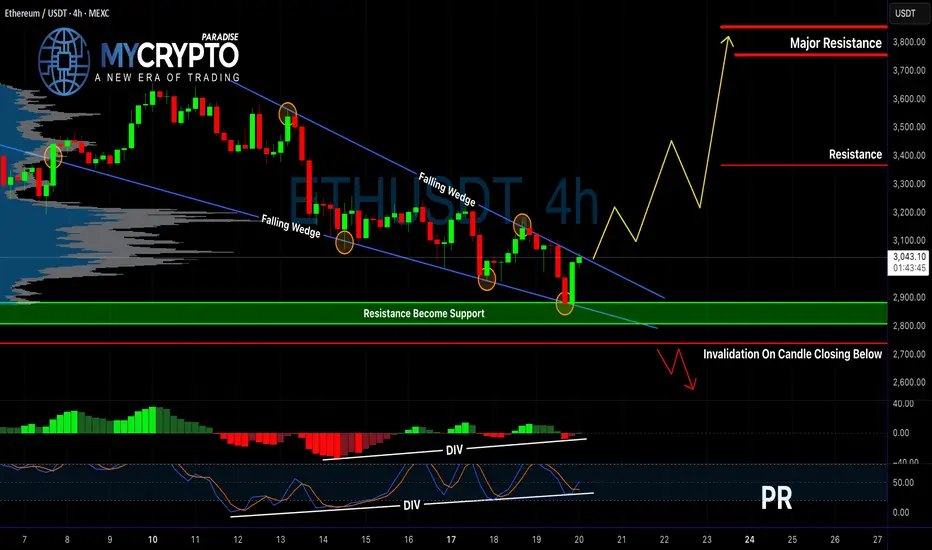
ETH About to Explode or Collapse?Yello Paradisers! Are you prepared for what’s coming next on ETHUSD? Because right now, Ethereum is sitting on the edge of a critical structure that could lead to a major breakout—or trap unsuspecting traders in another fake move. The setup is developing quickly, and what happens next will determine the short-term direction in a big way.
💎ETHUSD is currently forming a textbook falling wedge pattern, a structure often seen at the end of corrective phases and typically followed by strong bullish breakouts. What adds more weight to this scenario is the clear bullish divergence forming on both the MACD histogram and the Stochastic RSI. These indicators suggest that bearish momentum is weakening and bulls may be getting ready to take control.
💎For traders who prefer confirmation, the ideal move is to wait for a decisive breakout above the wedge. That would significantly increase the probability of a sustained bullish move and reduce the risk of being caught in a fakeout. However, for more aggressive traders, there may already be a reason to act. A bullish engulfing candle has formed directly at a key support level—an early signal that buyers are starting to step in with strength.
💎That said, we cannot ignore the invalidation scenario. If the price breaks down and closes candle below the defined invalidation level, the entire bullish outlook will be off the table. In that case, it will be crucial to stay patient and wait for a clearer price action setup to form before considering new positions.
Strive for consistency, not quick profits. Treat the market as a businessman, not as a gambler.
MyCryptoParadise
iFeel the success🌴