USDCHF - Bearish Rising WedgeHello traders,
The USDCHF pair has broken down from a rising wedge pattern, signaling potential bearish momentum 📉
I expect the price to continue lower toward the next target zone.
🎯 Target: 0.79130
Wedge

Bitcoin - Why everyone is probably wrongYou may have noticed published ideas on tradingview.com are now calling for price action to take one direction and that direction is down. Don’t take my word for it, click on BTCUSD pair to the bottom right of this screen and then ‘ideas’ then ‘Recent’. A significant number of analysts are “short” at this time.
The number of short ideas should not be surprising, there is tens of millions of dollars in short interest around the 74-75k area waiting to be liquidated.
Two falling wedge patterns are shown on the above 1-day chart. All too easily these patterns produce false breakouts. How do you verify? Verification is made in a similar way to the recently published “How to void or validate a head and shoulders pattern” (idea linked below). We achieve validation by observing the movements of the oscillators.
1) A cross up of 20 indicates momentum is returning to the market. Look left.
2) Momentum oscillators cycle from above 80 to below 20 the majority of the time between 20 to 30 days. Look left and confirm, don’t take my word for it! At this time 26 days have passed since Stochastic RSI was above 80.
3) Considering points (1) and (2) the falling wedge now has a high probability of confirming the continued uptrend.
4) The wedge target area may be forecast by measuring the flagpole height (black circles). You can observe how accurate the first wedge target was forecast using this process. The forecast for the 2nd wedge is shown, towards the 115k area.
5) The 115k target area was first forecast from the “Is Bitcoin about to rally to 110-120k” idea (linked below) in July 2022 as price action was around $18k using the same method described above.
6) When the target is reached the bull market is over. There will be calls from all quarters informing us how price action is now going to $250k and beyond. Ignore it. The next macro long opportunity will be in 2026.
Is it possible price action continues correcting from the new all time high? Sure.
Is it probable? No
Ww
How to void or validate a head and shoulders pattern
Is Bitcoin about to rally to 110-120k

S&P500 (US500): Important Breakout & Bullish Continuation
US500 likely completely a correctional movement,
breaking a resistance line of a bullish flag pattern on a 4H time frame.
I think that a bullish wave is going to start soon
and the market will reach at least to 6917 level.
❤️Please, support my work with like, thank you!❤️
I am part of Trade Nation's Influencer program and receive a monthly fee for using their TradingView charts in my analysis.

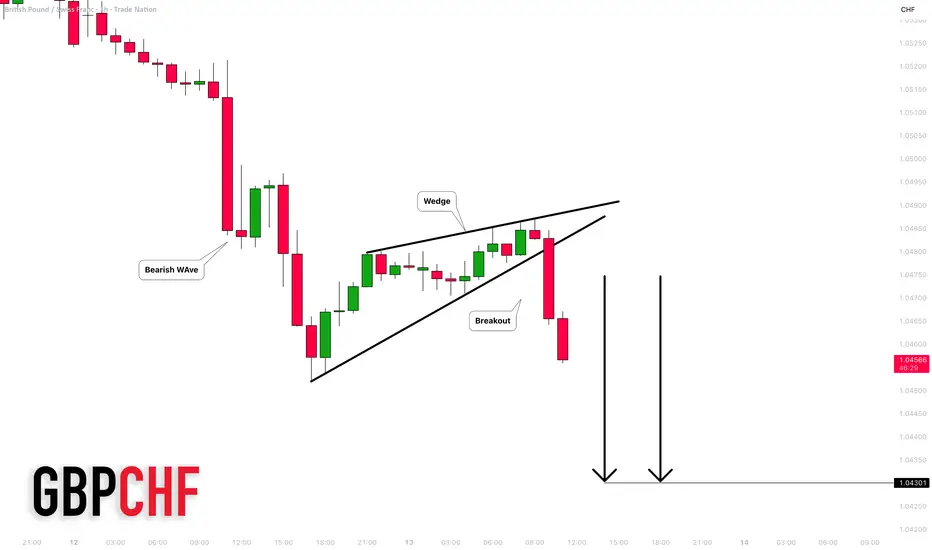
GBPCHF: Bearish Trend Continuation 🇬🇧🇨🇭
GBPCHF is trading in a strong downtrend.
A bearish breakout of a rising wedge pattern on an hourly time frame
indicates a highly probable trend continuation.
I expect a fall at least to 1.043 level.
❤️Please, support my work with like, thank you!❤️
I am part of Trade Nation's Influencer program and receive a monthly fee for using their TradingView charts in my analysis.
EURNZD: Strong Bullish Confirmation 🇪🇺🇳🇿
Quick update for EURNZD.
Retesting the upper boundary of a major demand zone on a daily,
the price bounced and violated a resistance line of a falling channel
on an hourly time frame.
Probabilities are high that we will see a pullback from that.
Goal - 2.059
❤️Please, support my work with like, thank you!❤️
I am part of Trade Nation's Influencer program and receive a monthly fee for using their TradingView charts in my analysis.

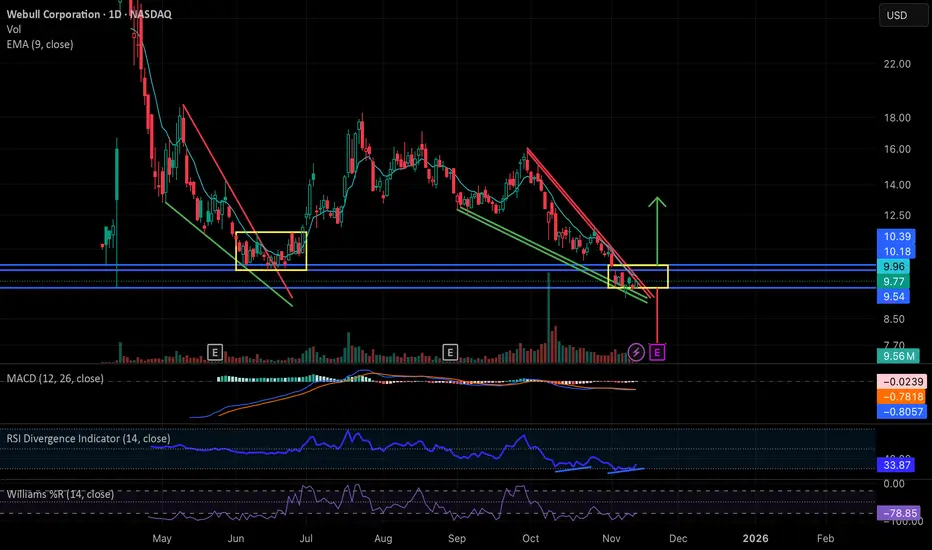
Webull: Falling Wedge Breakout ImminentNASDAQ:BULL has been in a steady decline essentially since the start of the government shutdown, forming a clean falling wedge structure very similar to the setup we saw in May and June. Back then, the wedge resolved with a brief breakout but ultimately moved into a sideways consolidation inside the yellow range before finally lifting in late June/early July.
Price is now sitting at the apex of a new wedge right as the government has officially reopened, almost to the day. With the president signing the bill, this may act as a macro green light for liquidity into year end, and BULL is positioned to potentially benefit from that.
Technically, the stock is deeply beaten down (roughly 40 percent from pre-shutdown levels), the MACD is starting to curl up, and there’s a clear daily RSI divergence. Together, these conditions make a relief move or breakout increasingly plausible.
If we don’t get a meaningful directional move between now and earnings on 11/20, then the most likely scenario is a replay of the May/June pattern: a period of sideways chop inside its current established support and resistance band zone around 9.54-10.18/10.39 while the market waits for the earnings catalyst. That report would then determine the next substantial move up or down.
In short: BULL is at a technical decision point, with momentum indicators improving, macro pressure easing, and earnings close enough that either a near-term wedge break or a consolidation-before-catalyst are both reasonable outcomes from here.
Bitcoin Falling Wedge Signals Breakout or Breakdown ZoneBitcoin is trading inside a falling wedge, a pattern that traditionally leans bullish when the breakout occurs.
At the same time, the price is approaching a historically sensitive region — the 112,000 USD zone, which is acting as the potential Point A (left shoulder zone).
If Bitcoin rejects from 112k–113k, this level may complete the left side of a developing head and shoulder formation, especially if the market loses its neckline later.
Important Supports to Watch
$97,000 → The most crucial support on the daily.
$97,500–$98,000 → Double-bottom demand zone.
$92,000 → The next major support & unfilled gap region.
A clean break below 97k will flip the entire market structure bearish and likely trigger a rapid decline toward 92k, confirming the neckline breakdown of a head and shoulder setup.
Bullish Scenario
If BTC forms a double bottom around 97.5k–98k, or if it sweeps liquidity and reclaims the level:
The falling wedge can break upward.
A push toward 112k becomes highly probable next week.
A breakout above 113k invalidates the bearish reversal and opens the way for continuation to higher levels.
This scenario requires a successful retest of the falling wedge breakout and strong volume.If BTC gets rejected at 112k–113k, and later breaks down below 98k, the chart will complete:
A textbook head and shoulder
A lost wedge structure
Momentum shift from bullish to bearish
This breakdown can trigger a high-velocity dump into the 92k gap zone.What Traders Should Focus On
112k–113k → Critical rejection zone to confirm the left shoulder.
97k–98k → Most important support and possible double-bottom area.
92k → Final downside target if BTC loses the neckline.
Watch for liquidity sweeps and volume strength to validate direction.Final View
Bitcoin is entering a decision phase.
The chart is offering both bullish wedge breakout potential and bearish head and shoulder risk, depending on how price reacts at 112k and 97k.
This is a position where traders should stay alert and wait for clean confirmation from either the breakout or the breakdown before placing major trades.

NZD-USD Bearish Wedge! Sell!
Hello,Traders!
NZDUSD formed a bearish wedge structure and broke its lower boundary, hinting at bearish continuation toward the next liquidity level resting below. Time Frame 4H.
Sell!
Comment and subscribe to help us grow!
Check out other forecasts below too!
Disclosure: I am part of Trade Nation's Influencer program and receive a monthly fee for using their TradingView charts in my analysis.

DKNG Update | $10Video contains a update on DKNG price action
Looking to see a move to $10 in the long term view
First we need to see a pullback which we are going through currently
Before $10 we will look to hit $20 first. Any rejection under liquidity grab will validate the next move.
Watch video for more details.
Ps
TradingView needs to allow shorter descriptions again😕

GBPUSD: Very Bearish Outlook 🇬🇧🇺🇸
Intraday price action on GBPUSD looks very bearish after a recent
test of a significant daily resistance that we discussed earlier.
The occurrence of a bearish imbalance indicates a highly probable
down movement.
I anticipate a fall at least to 1.3064
❤️Please, support my work with like, thank you!❤️
I am part of Trade Nation's Influencer program and receive a monthly fee for using their TradingView charts in my analysis.

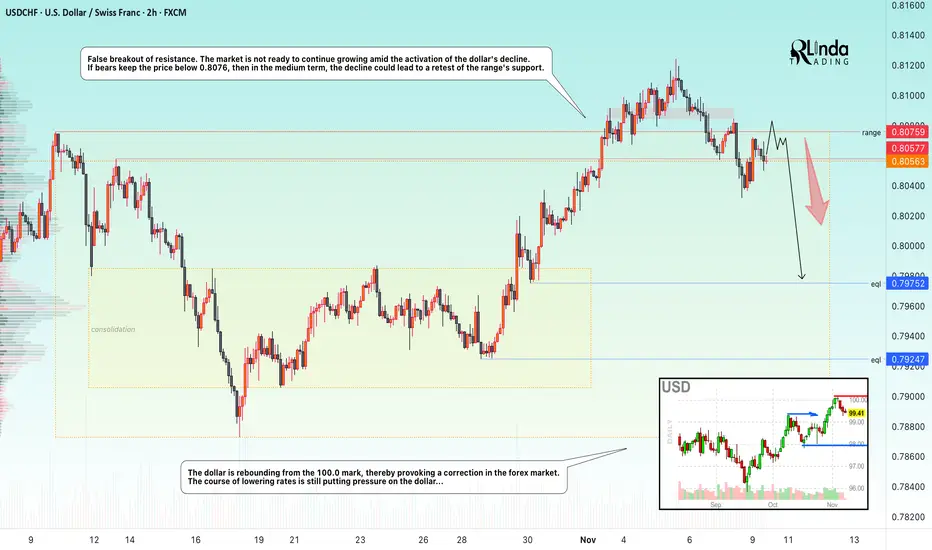
USDCHF → Manipulation? False breakout of resistance FX:USDCHF attempted to take advantage of the trend reversal opportunity after breaking out of a descending wedge, but the weak dollar hindered the rally...
The currency pair is facing resistance at 0.8076. There is no continuation of the momentum towards a breakout, and bearish pressure, which is intensifying as the dollar index declines, is negatively affecting the currency pair. The price has returned to the trading range, with an emphasis on 0.8057 - 0.8076. If the bears keep the price below this zone, this move could trigger further sell-offs.
Resistance levels: 0.8057, 0.8076
Support levels: 0.7957, 0.7925
The false breakout confirms that sellers currently have the upper hand and buyers lack the strength to push the price higher. Accordingly, consolidation below the key level could trigger a further decline towards the zone of interest at 0.7975.
Best regards, R. Linda!
NZDCADTrend was bearish now it is going to bullish also had bullish divergence
Reversal Pattern Rising wedge
No continuation pattern

XRP $17The Target 3 moon mission is preparing for launch.
The #Huntvolatility funnel is well underway.
Targets 1 and 2 have already been achieved and honoured.
In my humble opinion, we are poised to exceed many people's dream level of $10.
It's important to manage your risk as we ascend...
T3 may very well be exceeded.
However, it's crucial to adhere to your own trading strategy and financial objectives.
As we all know, the crypto market is extremely volatile.
Wishing everyone good luck.

14 Year HVF that still offers 7X upside. SILVER Miner. $EXKEndeavour Silver is a mid tier producer with 4 mines in Mexico and Peru.
Focusing on exploration projects across the Americas.
EXK aims to become a leading senior silver producer.
It's Terronera reached commercial production last month and is forecast to process 350k tonnes over the next 6 months with avg grades of 120g/t Silver and 2.5g/T of Gold
EXK has a extensive pipeline of exploration projects.
The company expects free cash flow in Q4 2025 and Q1 2026
Management targets 30M ounces by 2030
EXK is in growth phase by higher production and new mine outputs but has faced earnings pressure due to derivative losses and rising costs. It has a solid asset base, and future earnings outlook anticipate improved cash flows.

VSAT 1W – signal restoredOn the weekly chart, ViaSat (VSAT) finally broke out of a long-term falling wedge — a textbook bullish reversal pattern. After the breakout, price pulled back perfectly into the buy zone, confirming a clean retest on the weekly.
All moving averages (MA/EMA) now sit below the price - a clear sign that buyers are in control.
Technically, the setup looks strong:
✅ wedge breakout confirmed with volume;
✅ weekly retest completed;
✅ bullish momentum building up.
First target stands at 47.11, with higher resistances at 68.63 and 97.34 if the bullish structure holds.
Fundamentally, the company is stabilizing after a tough period - cost control, steady contracts, and renewed investor interest could all support the recovery.
After all, the ticker VSAT stands for communication - and right now, the market’s message seems pretty clear: “connection restored.”

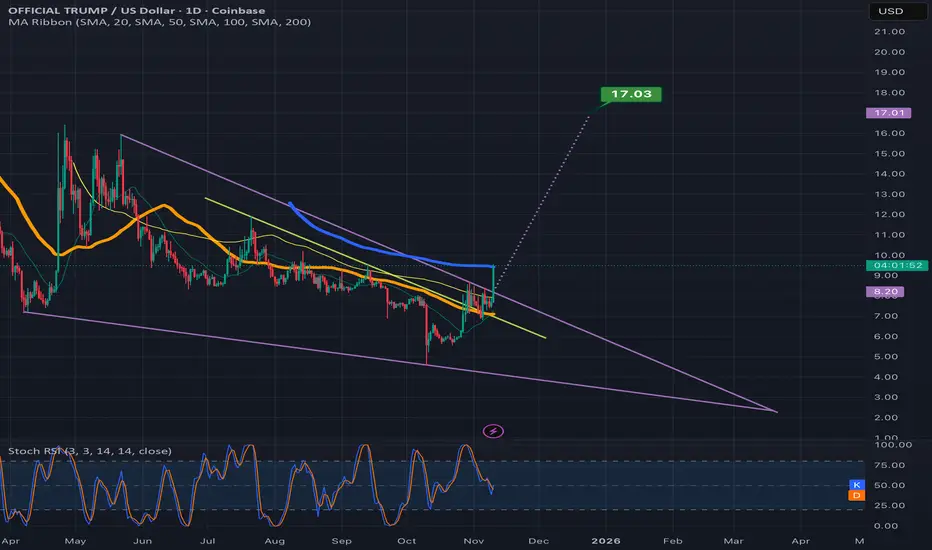
TRUMPUSD attempting to validate the falling wedge breakoutIt will need to flip the blue 200ma to solidified support to validate the breakout in my opinion but if it does it should 2x from its current value. *not financial advice*
LINK is Waking Up—But Is This a Bull Trap or the Real Deal?Yello, Paradisers! Did you catch the breakout on LINKUSDT? It looks good at first glance, but there’s a critical detail that could make or break this move—don’t skip this analysis if you’re thinking about jumping in.
💎LINKUSDT has just broken out of a well-defined descending channel, a structure that often marks the end of a downtrend phase. What adds weight to this breakout is the presence of bullish divergence on both the MACD histogram and the Stochastic RSI, two reliable momentum indicators. This confluence significantly increases the probability of a bullish continuation, but that doesn’t mean it’s time to enter blindly.
💎For a higher-probability trade setup, what we want to see next is a small pullback. Ideally, the price should return to the breakout zone, allowing former resistance to flip into solid support. If this area holds, that’s where the opportunity lies—targeting the next major liquidity zones and resistance levels above.
💎However, caution remains essential here. If price breaks back down and closes a candle below the invalidation level, it would invalidate the bullish setup entirely. In that case, it’s far better to remain on the sidelines and wait for a cleaner structure to form, rather than forcing a position during uncertain conditions.
🎖Strive for consistency, not quick profits. This market rewards patience, discipline, and tactical execution. The next big opportunity is always around the corner—but only for those who stay focused and follow the strategy without emotional interference. Be a pro.
MyCryptoParadise
iFeel the success🌴

Diageo, DGEThis is a chart that i am looking at pretty closely and feel we are in for a strong reversal soon.
Am keeping my eye on 1540 area as a strong support area. Atleast at a minimum for a strong bounce. Also keeping a close eye on a break out of the falling wedge area,
New appointment of Ex Former Tesco boss could be the reversal catalyst

DVN, Devon Energy set for a reboundLiking the look of this chart and feel we are in for a rotation which includes energy.
Nice inverted H&S in play.
Falling Wedge indicating a potential reversal
Needs to break diagonal resistance then i think we are off to the races. Potential Liquidity injection this week.

GBPNZDSpotted a potential continuation move after a corrective pullback. Here’s what backed my entry:
Confluences:
1️⃣ Bullish flag pattern — clear breakout from a descending channel.
2️⃣ Strong prior impulse leg — confirming bullish market structure.
3️⃣ Retest of minor support zone — price respected the 2.3350–2.3300 area.
4️⃣ Favorable risk-to-reward ratio (1:3) — targeting 2.3500 resistance zone.
Patience and confluence-based execution are key 🔑
#forex #priceaction #tradingpsychology #gbpnzd #technicalanalysis #tradingview

BTC AnalysisAfter breaking out its uptrend line, Bitcoin is completing the pullback to its trend line, while with the formation of an increasing angle pattern in the same direction with the main trend, we are witnessing fatigue in the trend. There is a possibility that the price will drop to the range of 41 to 43 thousand dollars.

BTC to pump againif BTC can break above the resistance at 108k and the falling wedge then pump should be fast

EURUSD: Price Correction, Before Bullish Breakout.Hello everyone,
Lets take a view on EURUSD. the pair have been trending on a descending channel of support and resistance, same as lower highs and lows. the price is heading towards the trend resistance, which there might be a slight pullback before breaking above the trendline.
Key points;
A clear breakout confirmation above the trend resistance, would set off upward rise eyeing 1.1727 as next possible target.
However a reversal below the resistance, would continue the downtrend movement.
Happy trading week,
Thanks for reading.
