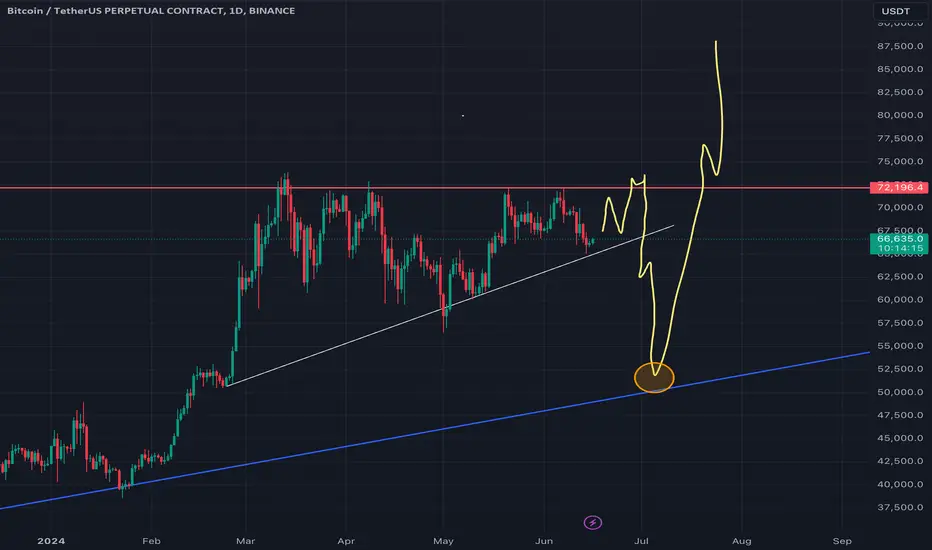
BTC SHORT BTC should touch one of these levels in 2-3 days
The overall trend seems to be downward, especially in the recent price action. The price has been making lower highs and lower lows, indicating a bearish trend.
Crypto market

tarde 2 short dar jahate ravand
bazar volume nadare va shanbe yekshanbe ham hast pas trade kardan koan manteghi nist vali man mizanam chon daram strategy dorost mikonam
kaf va saghf paein tar dare mizane va ravand nozoli darim btc roye yek hemayat hast ke agar bere ziresh mirizim ta 60 hezar va mikham ba risk kam yek postion dashte basham.

Bome LongBOME has a perfect bounce from the support line maintaining from last eum and is showing bullish momentum, currently trading at 0.104. This upward trend indicates a promising entry point at 0.010400.

MKRUSDT IDEA #MKRUSDT
Hey dear traders hope you are enjoying trading and analysis with our team. we are here to discuss about MKRUSDT
MKR is getting ready for Massive Bullish wave ✅
Expecting 50%+ profit in coming days 🚀

ARKMUSDTmy entry on this trade idea is taken from a point of interest BELOW an inducement.. I extended my stoploss area to cover for the whole swing as price can target the liquidity there before going as i anticipate.. just a trade idea, not financial advise

JASMY ANALYSIS🔮As we said earlier, #JASMY performed same. Around 113% movement after we post our analysis.
Now we can see that there is a formation of "Falling Wedge Pattern" in #JASMY. Also there is a perfect breakout 👌 We will see a bullish move of around 20% in few days
#DYOR

CHZUSDT Bullish divergence 4hr chartCHZUSDT Showing a bullish divergence on the 4hr chart. Looking for a reversal to the upside barring any major drop on BTC

#BTCUSDT | 1 HOUR TIMEFRAME UPDATE#BTCUSDT | 1 HOUR TIMEFRAME UPDATE
We can look for confirmation to open a LONG position in the range of $66,500 - $66,230 ✔️
The target for this upward movement is $67,200 - $67,800 - $68,500 - $69,800 - $70,500 - $72,100 🔼
Invalidation below $65,010 ❌

High FDV Means Decline? ---- STRK
More and more tokens are choosing the mode of high FDV and low circulation ratio in the setting of TGE. The tokens that adopt this model have fallen. The most notable example is STRK. Starknet, as L2, started TGE in February.
As one of the representatives of ZK verification, STRK should have had strong market expectations, but the project team has adopted a radical tokenomic model. After TGE, STRK’s FDV reached US$10 billion, almost equal to the FDV of L2 head token OP. OP gained US$10 billion in FDV by virtue of its optimistic mechanism and the OP alliance built by the OP stack. At that time, Starknet's ecosystem was very poor and did not have the same strength as Optimism. So predictably a long decline has begun.
Although the daily level does not provide a signal due to insufficient data, TSB gives a SELL signal whether at 1h or 4h. Just like in the picture, at the 1h level, STRK continues to fall, and after approaching the wavy area, the short strength increases.
In summary, after understanding STRK's token economic model, you can use the TSB indicator to open short positions, which will bring you objective profits.
Introduction to indicators:
Trend Sentinel Barrier (TSB) is a trend indicator, using AI algorithm to calculate the cumulative trading volume of bulls and bears, identify trend direction and opportunities, and calculate short-term average cost in combination with changes of turnover ratio in multi-period trends, so as to grasp the profit from the trend more effectively without being cheated.
KDMM (KD Momentum Matrix) is not only a momentum indicator, but also a short-term indicator. It divides the movement of the candle into long and short term trends, as well as bullish and bearish momentum. It identifies the points where the bullish and bearish momentum increases and weakens, and effectively capture profits.
Disclaimer: Nothing in the script constitutes investment advice. The script objectively expounded the market situation and should not be construed as an offer to sell or an invitation to buy any cryptocurrencies.
Any decisions made based on the information contained in the script are your sole responsibility. Any investments made or to be made shall be with your independent analyses based on your financial situation and objectives.

Crypto + 3 Step Rocket Booster Strategy - Recap VideoThis is the recap video of the rocket booster strategy now this video i break down to you
how important it is to master technical analysis
and why this strategy is called the rocket booster
--
Also, check out the references below to learn more
--
Disclaimer; Trading is risky please learn risk management strategies because you will lose money

MATIC BULLISH SCENARIOseeing the current price of Matic is really good for looking a price that we will buying for , soon it will sky rocket with 600+% price hike

MANTAMANTA is in accumulation zone.If it break this trendline it will move upward.I will do DCA on it.
Targets are 4$ , 5$ .8$ , 13$.

#RLC Seize the Opportunity: Dive into the Trade!Symmetrical Triangle Breakout:
The #RLC/USDT chart illustrates a symmetrical triangle pattern that is on the verge of breaking out. This setup often leads to a significant price movement, offering an excellent entry point for traders.
Strong Support Base:
The chart displays a robust support level at $2.407, ensuring a safety net for this trade. The solid support base minimizes potential losses and provides a secure entry position.
Bullish Continuation Signal:
The price action shows consistent higher lows, indicating sustained buying interest. This bullish continuation signal suggests a higher probability of further upward momentum.
Volume Confirmation:
Notice the increasing trading volume as the price approaches the breakout point. This volume surge confirms the strength of the breakout and indicates strong market participation.
RSI Indicator:
The Relative Strength Index (RSI) is climbing towards the bullish territory, showing growing buying pressure. This suggests there is ample room for the price to appreciate before hitting overbought conditions.
Favorable Risk-Reward Ratio:
This trade offers a target price of $5.432 with a stop-loss at $2.407, presenting a favorable risk-reward ratio. The potential upside significantly outweighs the downside risk, making this trade a compelling opportunity.
In conclusion, the combination of a symmetrical triangle breakout, strong support levels, bullish price action, volume confirmation, and positive RSI momentum makes the RLC/USDT trade an enticing opportunity. Take advantage of this setup to potentially maximize your returns!
___
⚠️All trade ideas are published with a time delay. If you want to follow the trade in real time, please follow the link to our open copy trading account on Binance.
👉Our account with open trading, and all our other resources at this link: linktr. ee/In_Trade_MLN

ustcSupport and press the rocket to cheer me up
Observe the ten percent loss limit
Stay away from Bitcoins
Feel free to buy and sell and post your comments

BTC plan for the upcoming monthsMax pain is coming for BTC traders IMO, equla highs untaped, many started to be bearish early, the ideal scenario based on people emotions to taped the qual highs and liqudate the early shorts and make people bullish again at the highs then smash the price to 50K make people think the bull market is over, liquidate the shorts again and starting the bull market

XVS USDT LONG POTENTIAL 27XHi everyone
this is not a financial, investment, trading, or other types of advice or recommendations
this is my idea
and its my art and way of seeing market today
trade with your plan

ARB/USDT POTENTIAL FALLING WEDGE! MUST BOUNCE FROM HERE!!Hey everyone! If you enjoy this content, please consider giving it a thumbs up and following for more analysis.
ARB showing potential on the daily timeframe! We might see a good bounce from here. Buy some here and add more in the dip.
Taregts:- $1.01/$1.24/$1.58/$1.86/$2.28
SL:- Daily close below $0.84
Let me know your thoughts in the comment section.

Convex Finance CVX price surprises with growthWhile #CRV fell in price instantly -30-40% and liquidated everyone on its way.
The #Convex Finance #CVX DeFi protocol, which allows LSE:CRV liquidity providers to receive a share of trading commissions on the #Curve without staking liquidity there, made +150% "on easy"
This only shows how the market works and how capital flows: someone's loss in the market is someone's gain at the moment who chose the right direction (or created it :)
All we have to do is wait for the spot when our/your alts make a similar curtsy)

The key is whether there is support near 1.3627Hello, traders.
If you "Follow", you can always get new information quickly.
Please click "Boost" as well.
Have a nice day today.
-------------------------------------
The key is whether there is support near 1.3627.
We need to check whether it can rise along the short-term rising channel after passing around June 15-21 (maximum June 14-22).
-
If it fails to rise above 1.3627, we need to check how it moves after passing the trend reversal channel.
Be careful when trading because the trend reversal channel can fluctuate greatly.
-
If it falls below the Fibonacci ratio of 0.5 (1.1109) ~ 0.618 (1.2093), it is expected to turn into a downtrend.
At this time, we need to check whether there is support near 0.9010.
-
Have a good time.
Thank you.
--------------------------------------------------
- Big picture
It is expected that a full-scale uptrend will start when it rises above 29K.
The section expected to be touched in the next bull market is 81K-95K.
#BTCUSD 12M
1st: 44234.54
2nd: 61383.23
3rd: 89126.41
101875.70-106275.10 (overshooting)
4th: 13401.28
151166.97-157451.83 (overshooting)
5th: 178910.15
These are points where resistance is likely to occur in the future.
We need to check if these points can be broken upward.
We need to check the movement when this section is touched because I think a new trend can be created in the overshooting section.
#BTCUSD 1M
If the major uptrend continues until 2025, it is expected to start forming a pull back pattern after rising to around 57014.33.
1st: 43833.05
2nd: 32992.55
-----------------

Bought XRP NOW f I r next wave upBought XRP NOW for next wave up
(Over 4% move.)
Sell @ 0.5086
Cause we ain't greedy.
The WizardOfRealms13

Jasmy 4HR BLOOD Diamond. Does it Print?A 4HR blood Diamond is trying to print for Jasmy. If this diamond can print, I'm looking for movement to the downside, clearing vector zone and hitting the golden pocket fib

BTCUSDT trading strategy!Hello, favorite transactionists BTCUSDT.
Today we continue to see BTCUSDT discounted, true to what I mentioned yesterday. The price is currently moving around $ 66,200.
Accordingly, in short to medium term, the discount momentum is still intact, the Sell strategy continues to be targeted when considering the technical factors on the chart we can easily see:
- The price moves under two ema 34, 89 and stable operation
- The decrease trendline is giving good signals and the resistance has not been broken.
Expected to continue selling after the price adjusted and checked EMA 34 as well as psychological barriers of $ 67,000
