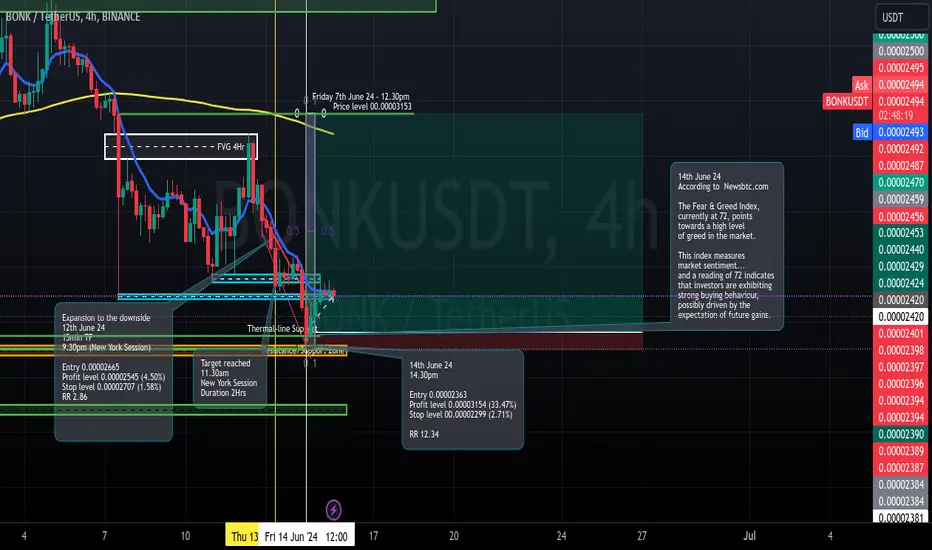
Long trade
14th June 24
14.30pm
Entry 0.00002363
Profit level 0.00003154 (33.47%)
Stop level 00.00002299 (2.71%)
RR 12.34
Crypto market
MANTA/USDT Potential 90%++Accumulate under $1.88 - $1.44
Targets Points
TP 1 : $2.2
TP 2 : $2.58
TP 3 : $2.98
TP 4 : $3.25
TP 5 : $3.5
TP 6 : $3.7
SL : $1.35

SOL ANALYSISIt is about reading the price pattern and the result of the indicators
I will only share with you what the result of the analysis shows.
This could be wrong. MD

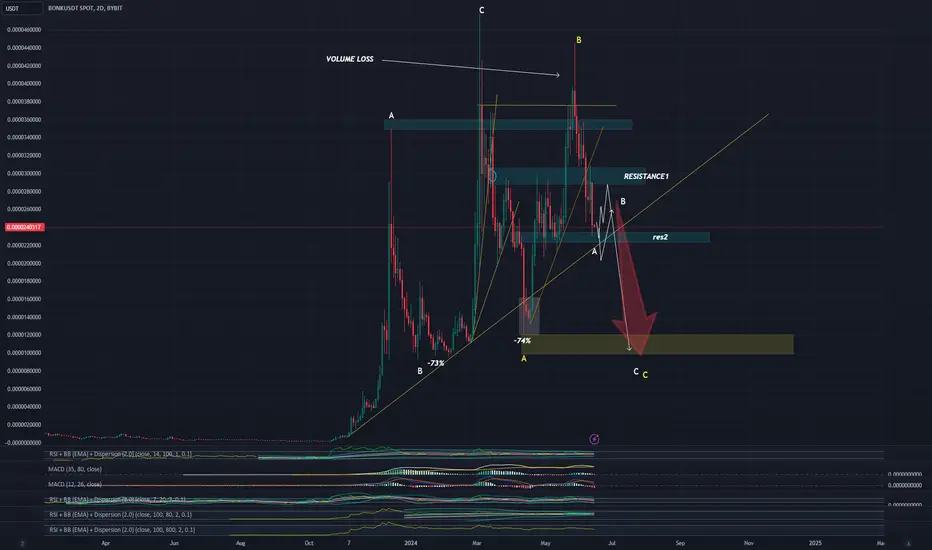
BONK PYRAMIDIt is about reading the price pattern and the result of the indicators
I will only share with you what the result of the analysis shows.
The weirdest coin to apply the abc strategy
This could be wrong. MD
The latest trading advice on Bitcoin, please don't miss itGood Evening and I hope you are well.
bitcoin
comment: Closed my swing short for big profits, I hope you made some. Next I expect the triangle to play out and probably break to the downside. The breakout-retest at 70137 was as perfect as it gets. Bitcoin’s fate also lies with the CPI and Jpow releases tomorrow. If markets rally, so will btc. If we sell-off, btc permabulls will be delighted to be able to add to their positions at much lower prices soon.
current market cycle: trading range
key levels: small range 66600 - 72000 / big range 56000 - 74000
bull case: Bulls printed the first good looking 1h bars since Friday, today at 6.pm. CET. They are holding on for dear life here at 67000 because below is hell for them. I can see the triangle playing out and the market moving some sideways here. If bulls are strong again, they will get back above 69000 but I highly doubt that.
Invalidation is below 66000.
bear case: Bears are now below all bigger 20ema and got a second leg down inside this trading range. A third leg would bring us right to the bull trend line on the daily chart around 65000. Bears are in full control here and unless all other markets rally hard tomorrow, Bitcoin is done imo. Decent chance that we won’t see 70000 for a long long time if catalyst’s tomorrow are bearish.
Invalidation is above 70000.
short term: Neutral here inside the triangle with slightly higher odds for the bulls to trade back to around 68800 before down again.
medium-long term: down to 40000 (could take 3-6 months). Could also drop to 20000 again but let’s make 40000 first and see how many want to buy there. —unchanged
current swing trade: None. Short from 70443, sl 71950 - closed for 3300 points.
trade of the day: Small pull-back bear trend from Tuesdays Globex session. Bar 63 was the biggest bear bar and that late in a trend it’s a clear signal to exit your short position because the chance of this being the climactic end of the trend is high.

NOTUSDTNOTUSDT- divergence.............................................Will take entry on trendline support if i see any strong bullish candle

ETHEREUM road to new ATH!Here we have an analysis for Ethereum in 1H time frame. we can consider two scenarios.
Bullish Scenario:
If ETH breaks above the immediate resistance (PA) around $3,700, it could rally towards higher resistance levels at $3,900, $4,000, and potentially up to $4,400.
This is depicted by the black projected path, suggesting a continued uptrend.
Bearish Scenario:
If ETH fails to break the $3,700 resistance and moves below the immediate support of $3,520, it could see further declines.
The orange projected path indicates a potential drop towards $3,360, $3,280, and a significant support level around $3,125.
This scenario suggests a possible deeper correction before any potential recovery.

#BTCUSDT | 1 HOUR TIMEFRAME UPDATE#BTCUSDT | 1 HOUR TIMEFRAME UPDATE
We can look for confirmation to open a LONG position in the range of $66,500 - $66,230 ✔️
The target for this upward movement is $67,200 - $67,800 - $68,500 - $69,800 - $70,500 - $72,100 🔼
Invalidation below $65,010 ❌


TIAUSDTBINANCE:TIAUSDT
As we see, we are in a downtrend and have formed somewhat complex five-wave structures. After forming the fourth corrective wave, the fifth wave also began with five waves in a WXYXZ. After completing the corrective wave X following wave Y of the fifth impulse wave, the price is now retesting the bearish order block of the corrective wave X. We have confirmation of a head and left shoulder, and now it's forming the right shoulder to test the $9.50
After this the price will continue to decline to complete wave Z.
I believe the price will retest the bullish order block at the $8 level.
Don't rely solely on technical analysis; you should also analyze fundamentals because the cryptocurrency market experiences constant volatility.
Trade safely.
Love you all.

#SEI/USDT#SEI
The price is moving in a bearish channel on a 4-hour frame and is holding it strongly and is about to break it upward
We have a bounce from the green support area at 0.4000
We have a tendency to stabilize above the Moving Average 100
We have a downtrend on the RSI indicator that is about to break higher and supports the rise
Entry price is 0.4177
The first target is 0.4730
The second target is 0.5192
The third goal is 0.5666

ETHUSDT IDEAHello Traders Hope You Are Enjoying Our Analysis. Today We Will Discuss About ETH
(Update)
Formed Ascending Triangle On WEEKLY Chart☑️
In Case Of Successful Breakout Wait For Massive Bullish Wave✍️

ETHFIUSDT IDEAHello Traders Hope You Are Enjoying Our Analysis. Today We Will Discuss About ETHFI
(Update)
The Trendline Formation On 12H Timeframe☑️
Currently Scrolling Inside The Support✅
In Case Of Breakout Expecting Massive Bullish Wave✍️

A disappointing #Altcoin season? Maybe! OTHERS.d/BTC.dMaking gains in #Crypto has gotten harder and harder with each passing cycle for the vast majority of participants.
That is an unquestionable truth that I see and hear from people.
#Bitcoin itself is in it's 4th Hype cycle... which is bearish
2013 Mt Gox ponzi cycle top/collapse
2017 Eth/ICO craze, CME futures. CNBC XRP shill top.
2021 Uniswap/DEFI innovation , Elon doge /Coinbase IPO top.
2024/5 Memecoins craze --- topping signals are already appearing Andrew Tate / Iggy Azalea at NYSE. A Trump Election Win could be the final nail in the coffin whilst ppl celebrate the news and January 2025 Inauguration may seal crypto's fate.
The left translated 4 year cycle is a definite possibility as made popular by #BobLoukas
We know that retail investors are rejecting High valued VC backed projects and rather take high risk gambles on #Memecoins for a chance to be early... this is not bullish behaviour obviously!
As only a tiny percentage of people can win at that game and often it is not YOU!
Once that speculative capital & energy is rinsed many people will be left holding a worthless bag of tokens.
#Leverage trading destroys many people's lives
And a digital store of value whilst has obviously it's merits is unlikely to flip #Gold in marketcap imho
It cannot compete with a 5000 year history of storing wealth for generation to generation.
I can bury Gold coins in my garden and dig them up in 50 years knowing full well that they will have value.
Would you do that with a trezor? Lol.
So what do we do ... try to take advantage of the next 6 months and rotate S coin profits into
#Stablecoins and maybe a small allocation to #PAXG #XAUT (buyer beware on those gold backed #RWA coins obviously)
This should buy you enough time, to let you assess the fallout of any top that may occur this Christmas/new year.
Remember many people and especially the Bitcoin community will be partying and celebrating the 15 year journey of a $100k plus BTC.
You must avoid being sucked into that hype and cash in a good chunk of your crypto portfolio IMO
This is just a scenario I give to you ... and not a prediction ofc.
We are trying to predict the future irrational behaviour of humans, an almost impossible task. But as the wall St cheat sheet demonstrates speculative bubbles, generally do repeat often enough for us to try and capture profits from them.
So we watch and wait, place our bets and see where the chips may fall, one foot in and one foot out is my general kind of viewpoint of how most people should be thinking at this stage of the cycle.

Analysis and advice from professionals!Bitcoin is still bullish and in an uptrend channel but is currently correcting with a possible next target to the lower channel at level 58-60k.

Let's try this again - FET ShortFET has hit a 6.85 just as it did in its last market cycle top. I think that from here there is a chance that it dumps down to the 2.618 area as an initial dump. This is approximately around $1.22.
Once this initial dump takes place, it will likely do a nice bounce back upwards, which typically sets up another dump/short opportunity. This bounce will probably take us back up to around $2.50. So a nice long opportunity within a short opportunity. If this plays out as it did last time, you should be able to short down to around 57 cents. So first short - about 60%, counter trend long - 100%, second short op - 73%. That's IF this plays out the same way as it did last cycle.
If we just continue bullish - my next upward target is $4.52.

INJUST on channel support > LongThis is a weekly LOG chart for INJ. As you can see, we tested the lower trend and found support. Stop is a weekly close outside the channel down around $24. Momentum is supportive, but needs to have follow through. Target is upward of $75

Long trade
Pair LTCUSD
1min TF Entry
14th June 24
Tokyo Session
19.32pm
Entry 77.46
Profit level 83.62
Stop level 77.22
RR 24.67

#INJ: Breaking Out of the Descending Channel -Our Trade RationalWe've decided to enter a trade on #INJ/USDT after observing several compelling technical signals that indicate a potential breakout. Here’s a detailed explanation of our decision:
1. Descending Channel Breakout: After a prolonged downtrend confined within a descending channel, INJ has recently broken above the upper trendline of this channel. This breakout suggests a reversal in the trend and the start of a bullish phase.
2. Volume Confirmation: The breakout is accompanied by an increase in trading volume, which adds validity to the move. Higher volume during a breakout is a strong indicator that the new trend could sustain.
3. Bullish Candlestick Pattern: The chart shows a series of bullish candlesticks forming right after the breakout, reinforcing the bullish sentiment.
4. RSI Signal: The Relative Strength Index (RSI) is trending upwards but is not yet in the overbought territory. This suggests that there is still room for further price appreciation.
5. Risk-Reward Ratio: Our entry point at $28.05 is well-positioned, with a stop loss set at $26.53 to manage downside risk. The target price is $40.04, providing an attractive risk-reward ratio for this trade.
In conclusion, the technical indicators and the positive breakout pattern present a promising opportunity in INJ. With a well-defined risk management strategy, this trade aligns with our overall trading plan. Let's see how this plays out!
___
⚠️All trade ideas are published with a time delay. If you want to follow the trade in real time, please follow the link to our open copy trading account on Binance.
👉Our account with open trading, and all our other resources at this link:
linktr. ee/In_Trade_MLN

Anticipating a MANTAUSDT Crash: Could the Downside Exceed 60%?Hi Realistic Traders, let's delve into the technical analysis of BINANCE:MANTAUSDT !
On the Daily timeframe, MANTAUSDT is presenting a clear double-top pattern , a classic bearish signal indicating a potential reversal from an uptrend to a downtrend. The recent breakout of the neckline, paired with a surge in volume above the volume MA line, amplifies the downward momentum. With the MACD Indicator firmly in the negative zone, the stage is set for continued downside movement, targeting our first target at 1.107. Once achieved, we anticipate a revisit to the neckline or the pullback zone before the bearish bias extends towards our second target at 0.788, the 2.618 Fibonacci ratio.
It is essential to note that the analysis will no longer hold validity once the target/support area is reached.
Disclaimer:
"Please note that this analysis is solely for educational purposes and should not be considered a recommendation to take a long or short position on CADJPY."
Please support the channel by engaging with the content, using the rocket button, and sharing your opinions in the comments below

BTC 4h Chart Key LevelsLooking for support below - confluence area -
95k Bullish Breaker + Orderblock with Imbalance + 618 fib + Value area Low of the current range.
Currently in the range after we moved up significantly but recently rejected from the point of control inside this range.
Low target would be the Yearly Vwap which is on its way up to the 62,488 fib level.
I think price action and the Yvwap will meet near 63k.
If we were to lose that vwap, theres a nice easy fall to the 54k area.
Not Ever Financial Advice.

MKR M HL attempt- going long.MKR like to move independently , this is the backtest of last years large cup formation breakout area at M EMA 123 in D OS.
This would be a historical RSI highly likely Monthly Higher Low fish trade.
GOING LONG

LUNC, Don't question the INTENTION to go UP.. and i mean UP.I'll keep it simple.
KEY NOTES:
WEEKLY DESCENDING TRENDLINE BROKEN.
HUGE MASSIVE NET BUY VOLUME registered this past 48hours.
WEEKLY PRICE SHIFT.
WEEKLY - Unusual volume strength line (top indicator).
2 BUBBLE UP VOLUME - bottom indicator warning sign of long series of ASCEND.
BE READY for an ASCEND of a lifetime.
Spotted at 0.000105
TAYOR.
Safeguard Capital always.
