REIUSDT UPDATE #REIUSDT
UPDATE
Hey dear traders hope you are enjoying trading and analysis with our team. we are here to discuss about REIUSDT
Falling wedge formation in 1D time frame ✅
In the case of successful breakout Expecting 100 %profit🚀
Crypto market

#APT/USDT#APT
The price is moving in a bearish channel on a 1-hour frame and is holding it strongly and is about to break it upward
We have a bounce from the green support area at 7.40
We have a tendency to stabilize above the Moving Average 100
We have a downtrend on the RSI indicator that is about to break higher and supports the rise
Entry price 7.67
First goal 8.14
Second goal 8.61
Third goal 9.11

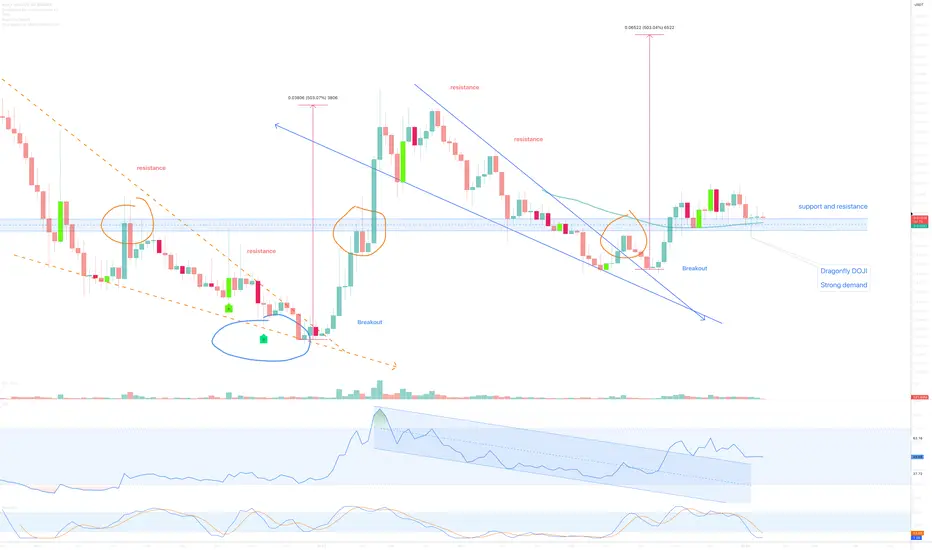
Alchemy Pay (ACH)On the above 5-day chart price action has corrected almost 80% since the 500% move from the previous idea. Now is a good opportunity to go long. Why?
1) Price action and RSI resistance breakouts.
2) Trend reversal, higher highs and higher lows replace lower highs and lower lows.
3) Price action finds strong demand on past resistance. Orange circles. Look left.
4) Dragonfly DOJI candle print. On this timeframe, you don’t ignore.
5) There is something else, will share elsewhere.
Is it possible price action could fall further? Sure.
Is it probable? No.
Ww
Type: trade
Risk: <=6% of portfolio
Timeframe for long: Now
Return: 300%
ORDI looking fror a fast W HL in golden pocket. ORDI started lower lows with less follow through , way above W balance lows and is in 4 h OS. W green marabosu then W red marabosu . looking for a fast W HL in golden pocket.
starting a position.

Bitcoin BTC 4hr divergence bounce to golden pocket resistanceBitcoin BTC 4hr divergence bounce to golden pocket resistance for Monday/Tuesday price action. Break of golden pocket could trigger big reversal.


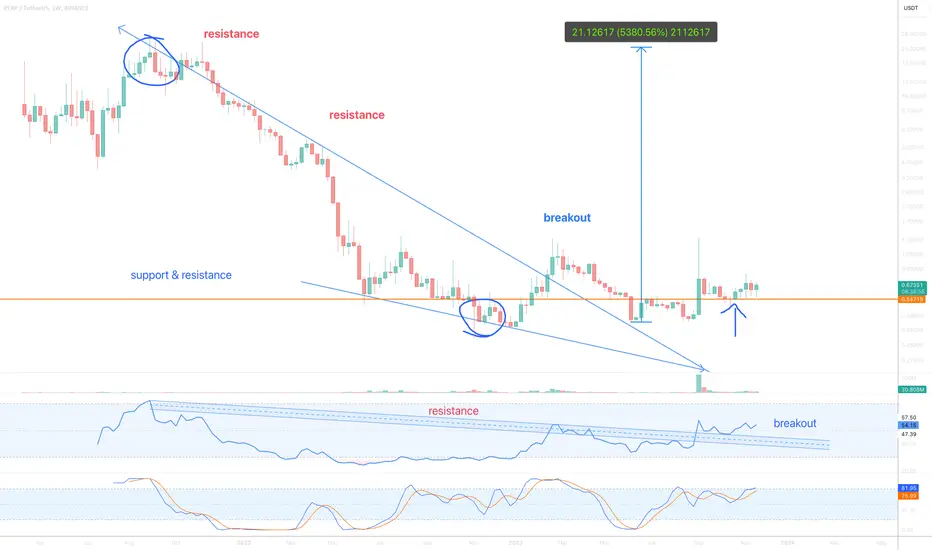
Perpetual Protocol (PERP) to $20On the above weekly chart price action has corrected 97% since September 2021. A number of reasons now exist to consider a long position. They include:
1) Price action and RSI resistance breakouts.
2) Support and resistance. Price action confirms support on past resistance (see arrow). Look left.
3) GRM support has already confirmed.
4) The falling wedge breakout and confirmation forecast a 5000% move from the breakout point. Forecast is measured from low to highest touchpoints within the wedge (blue circles).
Is it possible price action corrects further? Sure.
Is it probable? no.
Ww
Type: trade
Risk: <= 6%
Timeframe for long: Yesterday
Return: 50x
iMx Update: What a good pattern it isWe are seeing a Head and Shoulder bamboo.
Please use it to wash our hair to get fresh.
Don't be scare if price goes down to 1.2-1.4
That is very good chance to buy a ticket on this project.
Ready for web3 gaming?

EOSUSDT is this the dip?Assuming this is the low point for EOS, we can anticipate a price uptrend. Let’s analyze the support and resistance levels from the past.

#PYTH Why Enter This Trade?In the chart for the #PYTH/USDT pair , several key technical signals make this trade attractive:
1. Breaking the Descending Trend Line: As seen on the chart, the price has broken the descending trend line, which is a strong signal for entering the market. This indicates a possible start of a new uptrend.
2. Formation of Support Zone: The support level is marked at 0.3402, providing a reliable base for setting a stop-loss. This minimizes risks and allows for control of potential losses if the price returns to previous levels.
3. Potential Growth to Resistance Level: The take-profit level is set at 0.7610, offering an attractive risk-reward ratio. This means that the potential profit significantly exceeds the risk, making this trade appealing.
4. Increasing Trading Volume: Recent candles show an increase in trading volume, often preceding significant price movements. High volume confirms market interest and may indicate trend strength.
5. RSI Analysis: The RSI indicator is not in the overbought zone, indicating potential for further growth. This gives additional confidence that the asset is not overvalued and has room to move upwards.
Conclusion: Considering the technical analysis and identified signals, entering this trade seems justified. It's important to remember risk management and set a stop-loss at 0.3402 to limit potential losses. Trading always involves risks, so using technical analysis along with risk management strategies will help achieve optimal results.
___
P.S.
Hello, everyone! We decided to start a marathon and increase our capital from $2 000 to $2 000 000
We will be trading on sports in a manual format with stop loss and take profit.
Important ❗️👇
1. We do not sell training, signals, private channels or any other products. We are just recording our journey for the purpose of a public experiment.
2. Any investment in the crypto sphere can be completely lost. When we trade, we realize that we can lose everything, and if you trade, you also need to understand this.
3. We enter trades based on various data that may turn out to be wrong and lead to losses. None of the trades we enter is a guarantee of success.
👋 If you are interested in watching our experiment, we are glad to see you in our channel!
👀💲You can also watch all our trades and copy them. We have created an account for copy trading.
👉 Our sources
https://linktr. ee/In_Trade_MLN

#STRK Why is Ready for a Bullish Surge..Falling Wedge Breakout:
The chart of #STRK/USDT showcases a classic falling wedge pattern, which has recently been broken to the upside. This breakout is a strong bullish signal, indicating that the downtrend is potentially over and a new upward trend could be beginning.
Key Support Levels:
The support level around $1.22, which has been tested multiple times, has held firm. This gives confidence that the downside risk is limited, making it a strategic entry point for this trade.
Bullish Price Action:
The recent price action has shown higher lows and higher highs, a clear indication of a bullish trend. This pattern suggests growing buying interest and a potential for continued upward movement.
Volume Confirmation:
An increase in trading volume during the breakout further validates the bullish move. High volume on the breakout confirms strong market participation and reduces the likelihood of a false breakout.
RSI Momentum:
The RSI is trending upwards and has crossed above the midpoint, indicating increasing bullish momentum. This suggests that the asset still has room to rise before hitting overbought levels, providing an attractive entry point.
Risk-Reward Balance:
With a target price of $2.107 and a stop-loss set at $0.907, this trade offers a clear risk-reward ratio. The potential upside is significantly higher than the downside risk, making this a well-balanced trade opportunity.
In conclusion, the combination of a falling wedge breakout, strong support, bullish price action, volume confirmation, and positive RSI momentum makes this an ideal moment to enter the STRK/USDT trade. Position yourself now to capitalize on this promising setup.
____
⚠️All trade ideas are published with a time delay. If you want to follow the trade in real time, please follow the link to our open copy trading account on Binance.
👉Our account with open trading, and all our other resources at this link:
https://linktr. ee/In_Trade_MLN

SOL preppin again for a new round of PRICE GROWTH!SOL has been tamed town a bit after an aggressive rise to 126 -- and correcting healthily below 100.
This bluechip coin has seen exponential growth from being a single digit priced asset.
Based on recent 4h price data, the coin is preppin another round of price growth from the new higher base at 100.
This level seems to be a strong psychological level, a major order block support where buyers are now converging.
A retest of the previous peak at 126 and a possible strong break is highly possible.
Spotted at 100.
TAYOR.

Chart Pattern Analysis Of Bitcoin
K3 break up and close upon K2 under low supply pressure,
It seems that the following candles will price up to test the resistance.
I don’t think this is the start of another bull run,
It is just a Wave(B) of a larger scale consolidation process.
But during this process,
Some other crypto tokens will do better.

PEPE, will do another UPSIDE attempt..PEPE 4h data is showing another attempt to reverse to the upside. Volume increasing notably at the current price range.
Let's see if it can finally breakout of its descending trendline.
Spotted at 0.0000012500
TAYOR.
Safeguard capital always.


Bat usdt long potential Hi everyone
this is not a financial, investment, trading, or other types of advice or recommendations
this is my idea
and its my art and way of seeing market today
trade with your plan

BTCUSD will drop in 2025!1) I drew Support Line on RSI Indicator and it may be broken in 2025. 2) I drew Support line on Momentum indicator and it may be broken in 2025. 3) I drew Support line on CCI indicator and it may be broken in 2025. 4) DMI indicator has ADX and i applied ADXR which is used to quit from position early because it gives that strong trend is over.


Macro Bitcoin ThesisThis will not be appreciated and who knows if it's right but here's my last macro prediction for the distribution of risk assets.
Curtesy of x/ki_young_ju we have what looks like to be miner selling beginning. ETF inflows are still increasing, though.
x.com
We have what looks like Bitfinex exiting stage left.
Easy to see when exchanges deviate from the Bitcoin average price we get tops.
Bitcoin Dominance is topping as well. This will be the best time to predict where you are selling your altcoins as they are already popping off, and have much more room to grow from here while Bitcoin stalls.
My idea for the flows of liquidity will be US firms will still want exposure to their Bitcoin through the ETFs but the rest of the world hasn't had the regulatory hurdles the US had, so they will be selling their Bitcoin to the US at top tier prices, causing a top, in my opinion.
The price discovery periods for Bitcoin, although higher in price, will average less in magnitude.

BCH, ready for another ROUND to the UPSIDE!BCH, has been consolidating at the 240ish range for a few days now. Price has been moving horizontally with thin volatility suggesting a firm support at the current levels.
It's currently at the 38.6 FIB level -- a first level support for buyers.
On Daily histogram (top indicator), it has recorded its first bottom-wave shift line after almost 7 weeks. Last one was on June 13. This bottom-wave shifting line usually appear as a prerequisite before a surge in prices. New bubble up volume has appeared after almost two weeks suggesting firm support of buyers at the present range.
Daily higher lows has been created -- with first white light candle in sight.
On monthly data, it has recorded it's 2nd net positive volume increase signifying a firm support on the intended goal direction: UPSIDE.
Expect some significant price ascend from here on.
Spotted at 248.0
TAYOR.
Safeguard capital always.

SHIBUSDT Trading Signal: BuyDear Traders,
We have identified a trading opportunity for the currency pair SHIBUSDT. Below are the specifics for executing this trade:
Direction: Buy
Enter Price: 2.077E-05
Take Profit: 2.118E-05
Stop Loss: 2.017E-05
Rationale:
This signal is generated using the EASY Quantum Ai strategy, which utilizes advanced algorithms to analyze market trends and price movements. Here are the key factors influencing this signal:
1. Market Momentum: Our data analysis indicates an upward momentum in SHIBUSDT, driven by recent positive sentiment and increased trading volume.
2. Historical Support Levels: The enter price of 2.077E-05 aligns with a historical support level, which suggests a good entry point for a potential upward movement.
3. Resistance Projections: The take profit level at 2.118E-05 has been identified as a short-term resistance point. Breaking this level could signal a continuation of the bullish trend.
4. Risk Management: The stop loss at 2.017E-05 is strategically placed to minimize potential losses, ensuring a controlled risk environment.
We advise monitoring the trade closely and adjusting as market conditions evolve. Ensure you have your risk management strategies in place when executing the trade.
Stay informed and trade wisely!
Sincerely,
Your Trading Strategy Team

BTC new long!📉 BUY: BTCUSDT
📌 Entry Point: 65700-66400
⛔️ Stop-Loss: 62500 (5.4%)
🎯 Take-Profit #1: 68700 (4.0%)
🎯 Take-Profit #2: 71500 (8.2%)
🎯 Take-Profit #3: 78700 (19.1%)
