AUDJPYCurrently on AUDJPY the market is accumulating inside the range which is betweenn the Buyside liquidity and the Sellside liquidity, we are currently waiting for the market to take-out one of the 2 liquidities then thats when we enter heading for the other liquidity
Forex market

Hold 1.08000 -- Target 1.08500 !!!!Dear Trader,
according to chart ..if price hold 1.07880-1.08000 Area ! ,,,i expect price reverse from this support to 1.08500
Regards,
Alireza!


Reverse from 1.27500 Area Target 1.28500 !!! 100 Pips !!!Dear trader,
if price hold box zone ( support) , i expect price start upward movement to 1.28500 Area !
dont Forget like&Comment please !
Regards
Alireza!

When in doubt zoom outThe volatility of the rand is forcing us to “when in doubt zoom out.” Last week the rand managed to pull the pair to a low of 18.47 but the blue support range held its ground. The two critical rates to watch now is the 200-day MA support at 18.78 and the 61.8% Fibo resistance rate of 18.87. A break above 18.87 will allow the pair to test levels above the blue downward trend line and move into the red resistance range between 19.16 and 19.28. A break below 18.78 will however allow the rand to re-test the support range around the 18.50 mark. The rand is currently at the whims of global investor sentiment around SA’s new government of national unity but as the dust settles SA will be able to attract investors back into the SA bond market which is rand positive. The recent performance of the SA economy and the cooling of global commodity prices are however rand negative. Range bound movement between 19.00 and 18.70 can be expected as the pair looks likely to fall into a corrective pattern. A break below 18.50 will however invalidate the expected 5-wave impulse in the chart.

GBP/JPY- Trend Changing PatternMy focus this morning is on the GBPJPY, we have seen a strong reaction to the breakdown low that happened on 03 May 2024. The reaction gave us a bullish wave structure on the H1 timeframe, the concluding factor is that wave structure 4 failed to make an HH 5 (200.652). Instead of an HH 5, the price made an LH 5 in an uptrend. The price then proceeded to break structure 4, known as a trend-changing pattern.
Knowing this information determined our directional bias for the GBPJPY.
So far, we have seen a retracement to the LH 5 (200.652), which has now become a structural point because it made a LL.
Yesterday the price formation indicated that the Sellers are slowly coming into the market above the 200.652, we saw sharp rejections twice yesterday and a trade below the 200.65 and 200.50 today will be a sell indication for us.
The invalidation point is a break above the 200.95, above here selling is no longer an option for us.
Think in Probability:
As traders, you must be careful to align your behavior and expectations with the following principles:
- Anything can happen
- An EDGE is only an indication of one thing happening over another
- There is a random distribution between wins and losses
- You don't need to know what will happen in order to make money in trading.

EURAUD WILL FALL SELLTP-1-------15Pip
TP-2-------35Pip
TP-3-------Full TP
Manage SL during news time, intraday trade tp and sl mentioned not a financial advice

USD/JPY BEARS ARE STRONG HERE|SHORT
Hello,Friends!
USD-JPY uptrend evident from the last 1W green candle makes short trades more risky, but the current set-up targeting 154.142 area still presents a good opportunity for us to sell the pair because the resistance line is nearby and the BB upper band is close which indicates the overbought state of the USD/JPY pair.
✅LIKE AND COMMENT MY IDEAS✅

EURGBP Bank Money heist Plan in Bullish DirectionMy Dear Robbers / Traders,
This is our master plan to Heist EURGBP Bank based on Thief Trading style Technical Analysis.. kindly please follow the plan I have mentioned 2 target in the chart focus on Long entry. Our target is Red Zone that is High risk Dangerous level market is overbought / Consolidation / Trend Reversal at the level Bearish Robbers / Traders gain the strength. Be safe and be careful and Be rich.
Note: If you've got a lot of money you can get out right away otherwise you can join with a swing trade robbers and continue the heist plan,
Loot and escape on the target 🎯 Swing Traders Plz Book the partial sum of money and wait for next breakout of dynamic level / Order block, Once it is cleared we can continue our heist plan to next new target.
support our robbery plan we can easily make money & take money 💰💵 Join your hands with US. Loot Everything in this market everyday.

EUR/USD Eyeing Possible WhipsawFollowing yesterday’s FOMC-induced advance from daily support between $1.0726 and $1.0739, chart studies on the daily timeframe demonstrate the scope to navigate higher terrain until reaching a resistance zone between $1.0920 and $1.0883.
Given the daily structure and having seen H1 price trading within striking distance of $1.08 support, this could prompt buyers at this level. However, with support positioned below the big figure at $1.0795, a whipsaw below $1.08 into the said support could be seen before buyers attempt to make a show.

HUGE WIN, WHAT'S NEXT? EURUSDA huge win for us with a 100% accuracy, as you can see EURUSD has followed exactly my plan. But what's next now? I expect a downside moves in the London session that could push the price till 1.07750, here I will look for a long setup with a possible reversal starting at the beginning of the NY Session. My first target is above 1.08500.
FOLLOW ME FOR MORE

CAD/JPY SHORT FROM RESISTANCE
Hello,Friends!
CAD/JPY pair is in the uptrend because previous week’s candle is green, while the price is evidently rising on the 4H timeframe. And after the retest of the resistance line above I believe we will see a move down towards the target below at 113.500 because the pair overbought due to its proximity to the upper BB band and a bearish correction is likely.
✅LIKE AND COMMENT MY IDEAS✅

GBP/AUD BEARS ARE STRONG HERE|SHORT
Hello,Friends!
GBP/AUD pair is in the uptrend because previous week’s candle is green, while the price is clearly rising on the 1D timeframe. And after the retest of the resistance line above I believe we will see a move down towards the target below at 1.906 because the pair overbought due to its proximity to the upper BB band and a bearish correction is likely.
✅LIKE AND COMMENT MY IDEAS✅

CHF/JPY SELLERS WILL DOMINATE THE MARKET|SHORT
Hello,Friends!
The BB upper band is nearby so CHF-JPY is in the overbought territory. Thus, despite the uptrend on the 1W timeframe I think that we will see a bearish reaction from the resistance line above and a move down towards the target at around 173.688.
✅LIKE AND COMMENT MY IDEAS✅

sellDo we get a reaction of this zone again as market clears cpi news ?im still bias short on this pair hopefully price moves of that zone into my bias

NZDUSD - Short Trade IdeaNZDUSD recently displaced to the downside but quickly made a recovery and displaced above the swing of the recent drop. There was buyside liquidity in the form of equal highs that were swept, but the candle bodies seem to be respecting the bearish Orderblock.
I am anticipating price now return to a discount, taking out the sellside liquidity below, into a weekly BISI.
- R2F

#forex #GBPCAD #Eliot#GBPCAD
#Sell
#4h
#Eliot #supply_zone
#The end of Elliott's fifth wave with the following confirmations:
Price reaching the supply area.
Divergence in the RSI indicator
Int:1.75765
Sl:1.76888
Tp1:1.73398 #r/r=1/2
Tp2:1.70100 #r/r=1/5

EURCHFEURCHF is showing Bullish divergence Along place a buy as it will break its Last HL WITH Trendline

EURUSD Trading Signal: SELLWe have identified an optimal trading opportunity based on recent market analysis and the EASY Quantum Ai strategy:
Direction: Sell
Enter Price: 1.07643
Take Profit: 1.07149667
Stop Loss: 1.07688667
Rationale for the Prediction:
Our analysis highlights several key factors that support a bearish outlook for the EURUSD pair:
1. Technical Indicators: The EASY Quantum Ai strategy has detected strong selling pressure. Key momentum indicators are suggesting a downturn, with the Relative Strength Index (RSI) falling below 50 and signaling bearish sentiment. Furthermore, the MACD histogram is showing increasing negative momentum.
2. Trend Analysis: The EURUSD has recently broken below a crucial support level, indicating further downward movement. Historical price patterns point to a strong chance of continued selling off within the specified range.
3. Fundamental Factors: Recent economic data releases indicate a relative strengthening of the USD against the EUR. Factors such as economic policies, interest rate differentials, and geopolitical developments have also contributed to a favorable environment for USD strength.
Taking these elements into account, our strategy suggests initiating a sell position at 1.07643, with a take profit target at 1.07149667, while keeping a stop loss at 1.07688667 to manage risk.
Stay tuned for further updates and trade cautiously.

USDCAD Trade Signal - Sell PositionDear Traders,
We have identified a trading opportunity for the USDCAD currency pair using our rigorous EASY Quantum Ai strategy. Here are the trade details:
Direction: Sell
Enter Price: 1.37577
Take Profit: 1.37465
Stop Loss: 1.37748
Justification:
Our analysis is based on a combination of technical indicators and market sentiment data. The EASY Quantum Ai strategy has highlighted several factors that suggest a downward movement for the USDCAD pair:
1. The Relative Strength Index (RSI) is in the overbought territory, indicating a potential reversal.
2. The recent candlestick patterns suggest bearish momentum.
3. Market sentiment data shows increased selling pressure from institutional investors.
4. Fibonacci retracement levels indicate strong resistance near the enter price, hinting at a potential drop.
We recommend monitoring the trade closely and adjusting your risk management strategies accordingly.
Happy Trading!

EURGBP Trading Signal: BuyAttention traders! Based on the latest analysis from our EASY Quantum Ai strategy, we have identified a promising trading opportunity for the EURGBP currency pair.
Direction: Buy
Enter Price: 0.84592
Take Profit: 0.84713333
Stop Loss: 0.84396333
Why this recommendation?
1. Economic Indicators: Recent economic data from the Eurozone has shown signs of improvement, with key indicators such as GDP growth and manufacturing output beating expectations. This suggests stronger economic fundamentals supporting the Euro.
2. Technical Analysis: The EURGBP pair has been showing a strong bullish trend with significant support levels being maintained. The current price action indicates a potential continuation of this upward movement, which aligns with our strategy.
3. Market Sentiment: Sentiment analysis reveals a positive outlook for the Euro against the Pound, partly driven by uncertainties around UK’s economic policies post-Brexit, making the Euro a more attractive option for investors.
Stay vigilant and monitor the market to ensure your trading strategy aligns with the latest market movements.
Happy Trading!

#EURUSD - 13062024Yesterday, EURUSD just broke above the PZ rallied on CPI data all the way up; as mentioned the rubber band effect can result in a violent up move. EURUSD moved beyond the gap closing level of 1.0800 but instead to the next triple resistance zone at 1.0848 before pulling back now.
Unlike the indices which are clearly bullish, EURUSD closed near the mid point which is comparatively weaker. I see the up move and rejection as a possible overshot and the next move could be down. A break below PZ would be a short opportunity with stops above PZ for a move down to 1.0762 and possibly 1.0724.

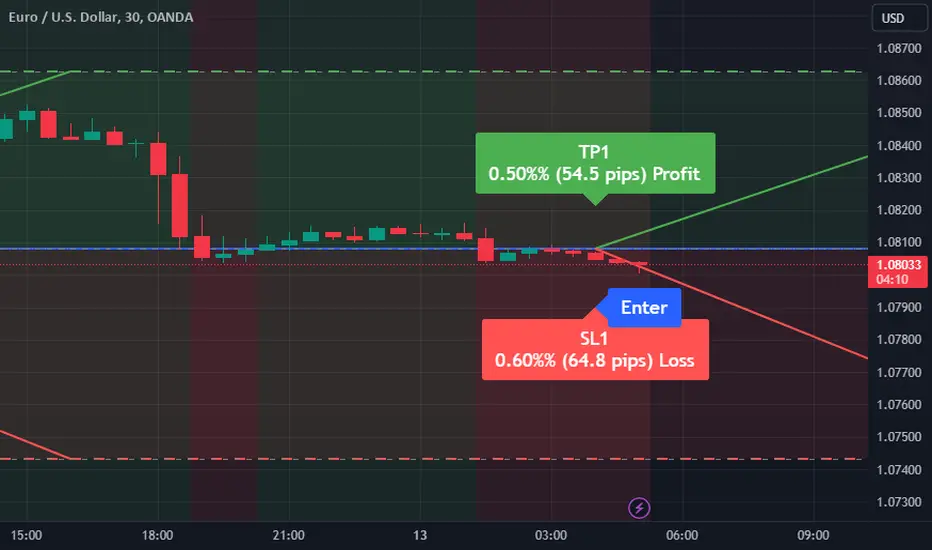
EURUSD Trading Signal: Buy AlertDear Traders,
We have identified a new trading opportunity for the EURUSD currency pair. The strategy used for this prediction is EASY Quantum Ai , which combines multiple technical indicators and market sentiment analysis to provide accurate trading signals.
Trade Details:
Direction: Buy
Enter Price: 1.08081
Take Profit: 1.08626
Stop Loss: 1.07433
Justification:
1. Technical Indicators Alignment: Our multiple time frame analysis shows a strong bullish trend for EURUSD. The Moving Averages (MA) and Relative Strength Index (RSI) are indicating an upward momentum.
2. Economic Data: Recent economic data from the Eurozone indicates a recovery, strengthening the EUR against the USD.
3. Market Sentiment: Current market sentiment and positioning indicate a bullish outlook on the EURUSD pair, as investors are showing renewed confidence in the Eurozone economy.
This signal is generated using the proprietary EASY Quantum Ai strategy, designed to capitalize on market movements with precision. Execute your trades accordingly and manage your risk effectively.
Happy Trading!
Best Regards,