Market indices

Dollar Index (DXY): Breakout & Demand Zone 💵The Dollar Index successfully surpassed and closed above the neckline of an ascending triangle pattern and a significant resistance downward trend line.
The current price is undergoing a retest of this broken structure, and I anticipate a bullish movement to occur from this demand zone. My targets are set at 105.11 and 105.40.

Need Confirmation B-wave is completeI posted an idea for SPX500USD and SPY a couple weeks ago saying I was legging into July puts because we are nearing a major top.
That top is likely in, but here is the confirmation I am looking for to signal a larger degree B-wave has completed:
- Expect small bounce to around 5283
- Then drop to 5215-5240
** If this occurs, and is followed by a bounce to 5292-5293, it will set up for a iii wave down to 5110 by early to mid June 2024 to confirm a larger degree C wave is in progress with end goal 4600-4700 by end of July 2024.

US100US100 just broke the last HL.
Just enter the bearish trend.
Bearish divergence also form .
we sell at CMP.

The price fell despite strong NVDA earnings. What's the cause?Nasdaq Falls 2.0% Amid Investor Uncertainty and Fed Caution
The Nasdaq fell by 2.0% on a subdued Thursday as investors adjusted their portfolios amid shifting market sentiment. The trading session was marked by an uneasy atmosphere following the release of the Federal Reserve's latest meeting minutes, which indicated that central bankers are in no hurry to reduce interest rates .
This cautious stance from the Fed has been a key factor in supporting the recent upward trend in stocks.
Technical Analysis:
The Nasdaq is poised to test the 18,715 level before likely retreating to 18,600. A bearish trend will be confirmed if the price stabilizes below 18,600, potentially driving it down further to 18,435. Conversely, a bullish scenario will emerge if the price breaks above the 18,660 threshold.
pivot line: 18710
Resistance Price: 18790, 18920, 19100
Support price: 18550, 18440, 18250
Its range for Today will be between Support 18250 and Resistance 18790

Professional trend analysis and strategy, don't missHello, traders, thoughts on potential future price movements.
- 2 Potential options.
- Opportunities can only be realized in one of two "potential" price paths.
- Technical analysis only.
- "No" Consider fundamental analysis.
- Consider "NO" relevance.
Happy trade

DXY SETUPExpecting the market to move as noted. Using SMC and price action makes it easy to understand the market

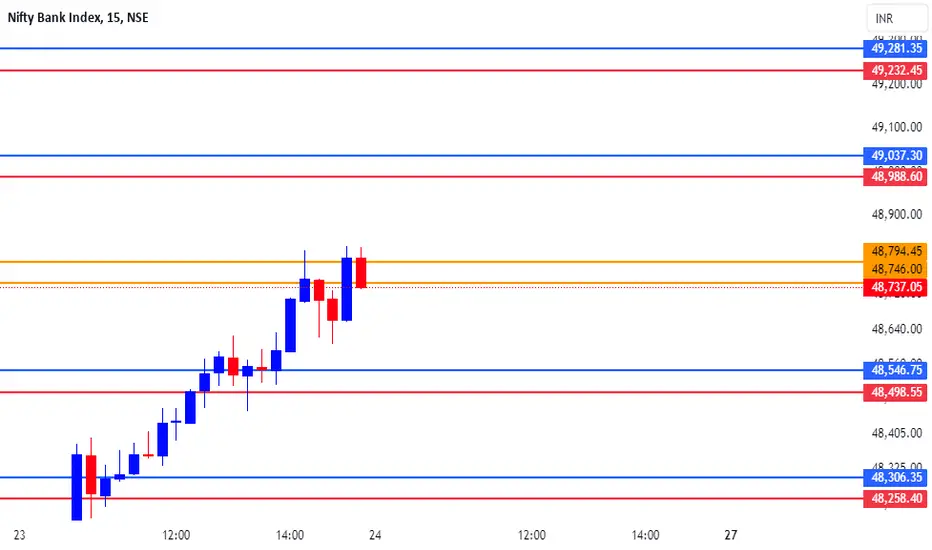
BANK-NIFTY TRADING LEVELS FOR 24-05-2024Explanation:
This is a very useful trading system. This means that you should not take a trade blindly, but rather that there is another confirmation to take the trade you can use this for perfect entry and perfect exit
This trading opportunity is based on volume, previous price, and price range , are included
Entry/Exit point's:
- It has very easy entry and exit points
- In this pair of lines with two colors are given (RED AND BLUE)
- In this the blue line is used to take long entry and the red line is used to take short entry (But it is all based on a more conformation from your trading plan)
Stop Loss/Take Profit:
Stop Loss
- According to this, if you take a long trade, its stop loss will be the red line just below ( A trade can exit either when the price crosses the red line or the 5 minute candlestick crosses the red line. (This can be done according to your preference) )
- A short entry should use the opposite rules to a long entry
Take Profit
-When you take a long entry according to the profit to be booked is on the next red line above. ( Or if there are other reasons, it can be a safe exit )
- Opposite rules for booking profit on long entry are to book profit on short trade. ( The blue line above is the stop loss of short entry )
Timeframe:
According to this, the time frame you should use while taking trades is 5 minutes time frames . (5 minute time frame works well in this)
Risk Disclaimer:
Trading carries significant risk and is not suitable for all traders. You may lose some or all of your capital in a matter of minutes or hours. Market conditions can change rapidly, and prices can move against you quickly. You may not always be able to exit at a favorable price, and you may be required to hold a position overnight, exposing yourself to additional risk. Day trading involves high risk, high leverage, and high stakes, and you should only trade with funds you can afford to lose. Please carefully consider your financial situation, risk tolerance, and trading objectives before engaging in day trading.
Engagement:
Share your insights, ask questions, and learn from others in the community. Whether you're a seasoned pro or just starting out, we're all in this together.
What's your take on the current market conditions? Which trading strategies are working for you? Let's discuss and help each other grow as traders!
Comment below and let's get the conversation started!
Original Content:
This trading setup is the result of my own innovation and expertise, and is not based on any publicly available information or third-party systems. It is a reflection of my dedication to developing a competitive edge in the markets.
NIFTY TRADING LEVELS FOR 24-05-2024Explanation:
This is a very useful trading system. This means that you should not take a trade blindly, but rather that there is another confirmation to take the trade you can use this for perfect entry and perfect exit
This trading opportunity is based on volume, previous price, and price range , are included
Entry/Exit point's:
- It has very easy entry and exit points
- In this pair of lines with two colors are given (RED AND BLUE)
- In this the blue line is used to take long entry and the red line is used to take short entry (But it is all based on a more conformation from your trading plan)
Stop Loss/Take Profit:
Stop Loss
- According to this, if you take a long trade, its stop loss will be the red line just below ( A trade can exit either when the price crosses the red line or the 5 minute candlestick crosses the red line. (This can be done according to your preference) )
- A short entry should use the opposite rules to a long entry
Take Profit
-When you take a long entry according to the profit to be booked is on the next red line above. ( Or if there are other reasons, it can be a safe exit )
- Opposite rules for booking profit on long entry are to book profit on short trade. ( The blue line above is the stop loss of short entry )
Timeframe:
According to this, the time frame you should use while taking trades is 5 minutes time frames . (5 minute time frame works well in this)
Risk Disclaimer:
Trading carries significant risk and is not suitable for all traders. You may lose some or all of your capital in a matter of minutes or hours. Market conditions can change rapidly, and prices can move against you quickly. You may not always be able to exit at a favorable price, and you may be required to hold a position overnight, exposing yourself to additional risk. Day trading involves high risk, high leverage, and high stakes, and you should only trade with funds you can afford to lose. Please carefully consider your financial situation, risk tolerance, and trading objectives before engaging in day trading.
Engagement:
Share your insights, ask questions, and learn from others in the community. Whether you're a seasoned pro or just starting out, we're all in this together.
What's your take on the current market conditions? Which trading strategies are working for you? Let's discuss and help each other grow as traders!
Comment below and let's get the conversation started!
Original Content:
This trading setup is the result of my own innovation and expertise, and is not based on any publicly available information or third-party systems. It is a reflection of my dedication to developing a competitive edge in the markets.
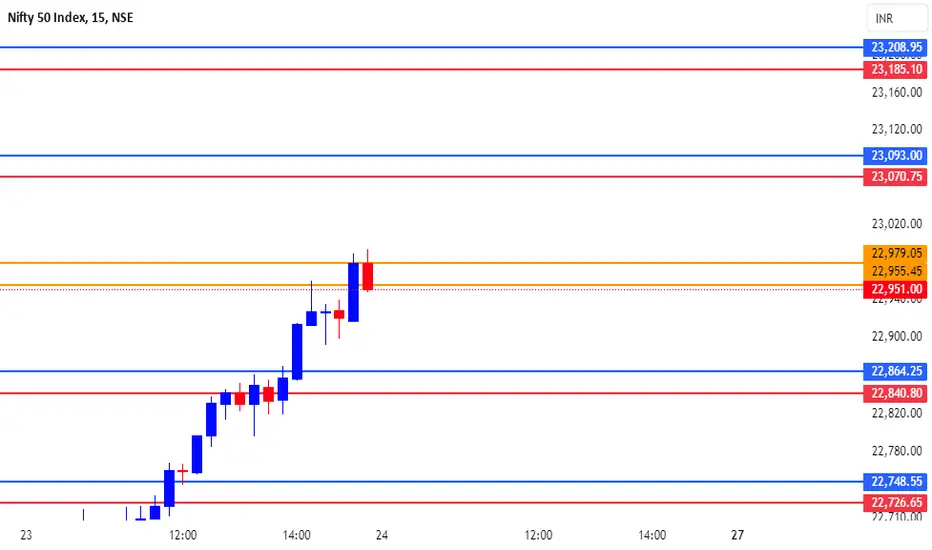
Nifty As per our previous prediction nifty hits new life time high.
Important support 22800 and resistance 23000.
Closing above 23000 will open a new target 23240 and 23500.

NAS pullback, then correction towards 500I´m expecting Nas to climb back above 700. 700-740 looks as an ideal resell area. Yesterday we have entered at 832 and TP all trades at 600, so lets try to repeat it again. I will try to update this idea when-if entry conditions are met. If you follow me, you wont miss anything. Wish you good luck.
P.S. I´m not a signal service, however I´m sharing signals. Don´t have 30K followers (consisted mostly from bots), so it is up to you to check what idea are you trading. Check my previous ideas to know. Instead of waiting for signals, invest(your time, not money) into your learning. It will be more profitable, more interesting for you.

US100 dropas we are expecting fundimentals in about an hour, im seeing a drop in nas100 in anticipation to break the previous low.

Looking for a continuation of todays bearsIf price gives me confirmation on the lower time frame I will look to sell. If this is the weekly pivot then price should trend down for at least today ad some of tomorrow.

NIFTY - Quick Analysis - 23rd MayTwo weeks back when we had a look at the NIFTY, the index was moving down after making a double top like formation, it was approaching a good support zone around 21710-21840. It did take support from this zone, reversed and started moving up. Then we had a Bullish “W” like pattern. Now it has taken out the previous rejection zone at 22795-22550. Today we saw a Bullish widespread bar on increased volume closing at the top. We can see the momentum also flipped to the positive side. Now we can expect the NIFTY to move to the top of the inclined channel or the supply line of the inclined channel. The top should be around 23300 from where we could see a reaction. So next week we could see the NIFTY approaching this level and it could hover around this level till election result. And quite possibly. based on the Election result on the June 4th, it may break about the channel supply line and move into a higher trajectory.

Hellena | SPX500 (4H): Short to 38.2% Fibo lvl 5205.Dear colleagues, I think that the price has either already completed or is about to complete the impulsive movement in wave “1”, so I expect the beginning of correction at least to the area of 38.2% Fibonacci level 5205. It is quite possible that the price will update the high and reach the area of 5375 before starting the correction.
Manage your capital correctly and competently! Only enter trades based on reliable patterns!

Hellena | DJI (4H): Short to the area of 38566.67.Dear colleagues, I believe that the impulse of the senior wave “1” is not yet over.
I assume that the correction is now in priority, so 2 variants of events are possible:
1) formation of lower wave “4” and “5” (39863.75), then correction with the aim to reach the area of 38566.67;
2) The correction will start soon without a new high, but in this case we will have to reconsider the waves.
Manage your capital correctly and competently! Only enter trades based on reliable patterns!

DXY Index is Ready to Pump by 🌄Morning Candlestick Pattern🌄🏃♂️DXY Index is moving near the 🟢 Support zone($104.27-$103.90) 🟢, and 200_SMA(Daily) and 100_SMA(Daily) , and the lower line of the ascending channel .
💡Also, the Morning Candlestick Pattern is clearly visible.
🌊According to the theory of Elliott waves , it seems that the DXY Index has completed the Double Three Correction(WXY) in the support zone .
🔔I expect the DXY Index to rise to at least the Resistance line .
U.S.Dollar Currency Index ( DXYUSD ) Analyze, 4-hour time frame⏰.
Do not forget to put Stop loss for your positions (For every position you want to open).
Please follow your strategy; this is just my Idea, and I will gladly see your ideas in this post.
Please do not forget the ✅' like '✅ button 🙏😊 & Share it with your friends; thanks, and Trade safe.

DOW JONES Should this Bearish Cross worry us?The Dow Jones Industrial Average Index (DJIA) hit our 40000 Target that we set on our May 06 idea (see chart below) and after that experienced a sharp pull-back:
So far this is within the lines of a natural technical correction correction towards the 1D MA50 (blue trend-line), which during uptrends tends to be re-tested as a Support. Notice also that this is where the 0.382 Fibonacci level is, an important technical Support during pull-backs.
As long as it holds, the Channel Up has the much needed Higher Low that can enable it to move to a Higher High. We expect that to be around 41500 (+6.30% rise, similar to the previous Bullish Leg).
On the other hand, since the 1D MACD completed a Bearish Cross yesterday, we need to consider the possibility of a deeper pull-back, as the last 1D MACD Bearish Cross (April 02), delivered a -6.88% decline. As a result, if the 1D MA50 breaks though, we will take that small loss and go on a short-term sell instead, targeting 38350 (0.618 Fibonacci level).
-------------------------------------------------------------------------------
** Please LIKE 👍, FOLLOW ✅, SHARE 🙌 and COMMENT ✍ if you enjoy this idea! Also share your ideas and charts in the comments section below! This is best way to keep it relevant, support us, keep the content here free and allow the idea to reach as many people as possible. **
-------------------------------------------------------------------------------
💸💸💸💸💸💸
👇 👇 👇 👇 👇 👇

NIFTY: Trading Plan for 24-May-2024
After the impressive movement we saw on Thursday, 23 May 2024, where prices hit our targets precisely, we might expect a more relaxed trading session on Friday, 24-May-2024. However, we should be ready for various scenarios. Here’s our plan:
Gap Up Opening
Above 23000: If prices open above 23000, they might face resistance near 23059 and trade sideways.
Above 23060: Prices can rise towards 23142.
Below 23000: Prices might find support at 22917-22897.
Below 22880: Look for support at 22803-22800.
Flat Opening
Support at 22915-22897: If prices open flat, they might first take support here.
Upside: After finding support, prices can move towards 23000-23059.
Below 22880: If this support fails, prices could drop towards 22800.
Gap Down Opening
Below 22880: If prices open below this level and stay there for the first hour, expect a drop towards 22800.
Recovery above 22915: If prices quickly recover above 22915, look for a move towards 23000-23059.
Conclusion: While a sideways session is likely, be prepared for quick movements in either direction based on these key levels.
Disclaimer: Trading involves risk, and past performance is not indicative of future results. Make trading decisions based on your own analysis and risk tolerance.

Bullish bounce off pullback support?NAS100 is falling towards a support level which is a pullback support and could potentially bounce from this level to our take profit.
Entry: 18,427.71
Why we like it:
There is a pullback support level.
Stop loss: 18,149.88
Why we like it:
There is an overlap support level which lines up with the 50% Fibonacci retracement.
Take profit: 18,899.05
Why we like it:
There is a pullback resistance.
Please be advised that the information presented on TradingView is provided to Vantage (‘Vantage Global Limited’, ‘we’) by a third-party provider (‘Everest Fortune Group’). Please be reminded that you are solely responsible for the trading decisions on your account. There is a very high degree of risk involved in trading. Any information and/or content is intended entirely for research, educational and informational purposes only and does not constitute investment or consultation advice or investment strategy. The information is not tailored to the investment needs of any specific person and therefore does not involve a consideration of any of the investment objectives, financial situation or needs of any viewer that may receive it. Kindly also note that past performance is not a reliable indicator of future results. Actual results may differ materially from those anticipated in forward-looking or past performance statements. We assume no liability as to the accuracy or completeness of any of the information and/or content provided herein and the Company cannot be held responsible for any omission, mistake nor for any loss or damage including without limitation to any loss of profit which may arise from reliance on any information supplied by Everest Fortune Group.

CHART BREAKDOWN NASDAQ: Key Levels, Targets and Thoughts!🎯Brief Description🖊️:
The chart provides insights into critical market levels, emphasizing an essential demand zone (low-risk buy zone) spanning from 18330 to 18315. Additionally, medium-risk sell zone between 18870-18920, respectively, are highlighted.
Things I Have Seen👀:
Important Demand Zone🟢: Identified between 18330 and 18315, serving as a low-risk buy.
Medium-Risk Sell Zone🟠: Noted between 18870 and 18920, suggesting another area with moderate risk for potential selling positions.
Bearish Targets📉:
18850: Possible retracement area.
18700: Possible retracement area.
18500: Area with laying low liquidity.
Ultimate Target: 18330- Essential Demand Zone
Bullish Targets📈:
18400: Possible retracement area.
18500: Possible retracement area.
18580: Possible retracement area.
18670: Area with a lot of liquidity.
What's Important Now❗
Currently, the crucial approach is to wait and observe the price action at this level. We need to assess how the market reacts before considering any decisive moves. Stay observant and responsive to real-time developments in the market.

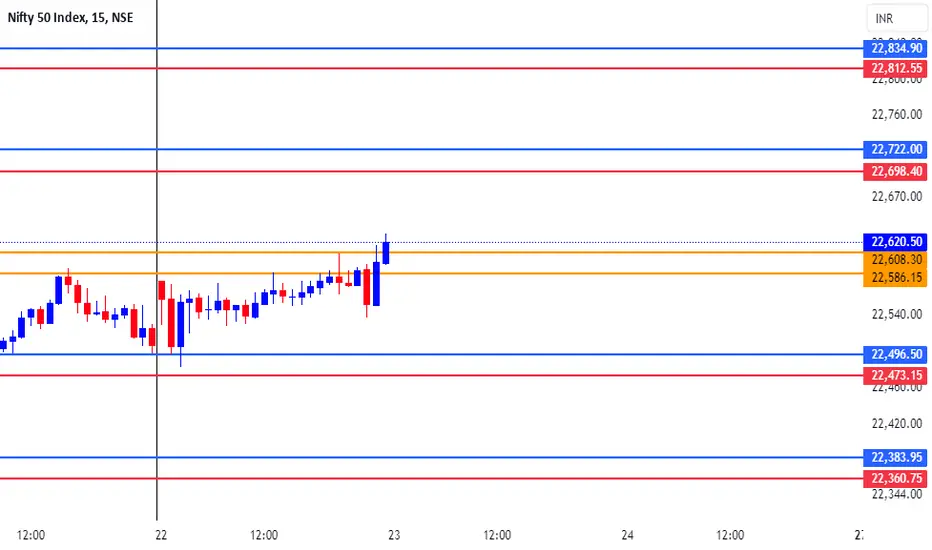
bearish dxy may send eur to the moon if price respects that fib am expecting price to tag 0.62 fib level then i can start looking for sells on dollar pairs and buys on quoted ones

NIFTY TRADING LEVELS FOR 23-05-2024Explanation:
This is a very useful trading system. This means that you should not take a trade blindly, but rather that there is another confirmation to take the trade you can use this for perfect entry and perfect exit
This trading opportunity is based on volume, previous price, and price range , are included
Entry/Exit point's:
- It has very easy entry and exit points
- In this pair of lines with two colors are given (RED AND BLUE)
- In this the blue line is used to take long entry and the red line is used to take short entry (But it is all based on a more conformation from your trading plan)
Stop Loss/Take Profit:
Stop Loss
- According to this, if you take a long trade, its stop loss will be the red line just below ( A trade can exit either when the price crosses the red line or the 5 minute candlestick crosses the red line. (This can be done according to your preference) )
- A short entry should use the opposite rules to a long entry
Take Profit
-When you take a long entry according to the profit to be booked is on the next red line above. ( Or if there are other reasons, it can be a safe exit )
- Opposite rules for booking profit on long entry are to book profit on short trade. ( The blue line above is the stop loss of short entry )
Timeframe:
According to this, the time frame you should use while taking trades is 5 minutes time frames . (5 minute time frame works well in this)
Risk Disclaimer:
Trading carries significant risk and is not suitable for all traders. You may lose some or all of your capital in a matter of minutes or hours. Market conditions can change rapidly, and prices can move against you quickly. You may not always be able to exit at a favorable price, and you may be required to hold a position overnight, exposing yourself to additional risk. Day trading involves high risk, high leverage, and high stakes, and you should only trade with funds you can afford to lose. Please carefully consider your financial situation, risk tolerance, and trading objectives before engaging in day trading.
Engagement:
Share your insights, ask questions, and learn from others in the community. Whether you're a seasoned pro or just starting out, we're all in this together.
What's your take on the current market conditions? Which trading strategies are working for you? Let's discuss and help each other grow as traders!
Comment below and let's get the conversation started!
Original Content:
This trading setup is the result of my own innovation and expertise, and is not based on any publicly available information or third-party systems. It is a reflection of my dedication to developing a competitive edge in the markets.