NAS100 ANTICIPATIONReason for nas100 to drop it is being that now
1.we are in a bearish trend as the market changed structure
2.Market gave bearish confirmation through CHOCH and BOS
3.Market is sitting on an Order block on 30m TFM
4.Reversal conformation on 30m OB for bearish continuation
Market indices

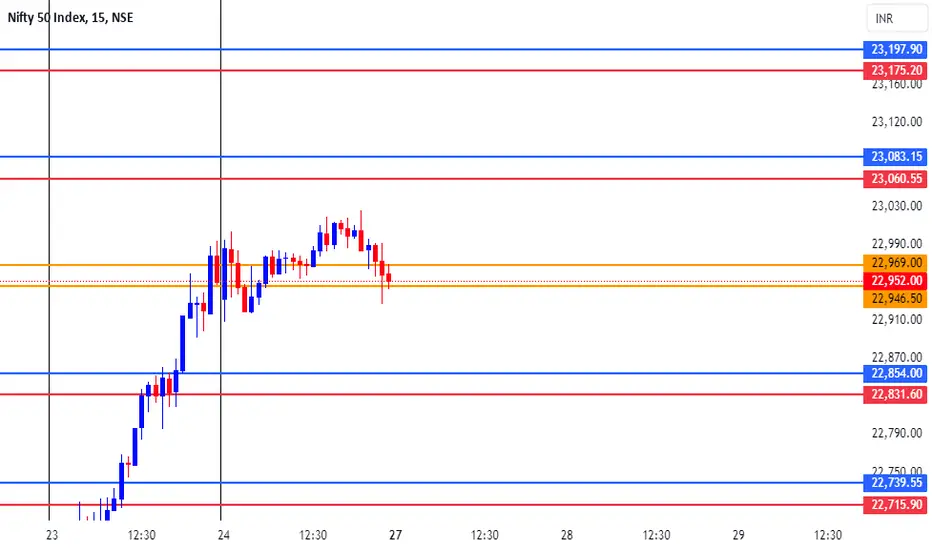
NIFTY TRADING LEVELS FOR 27-05-2024Explanation:
This is a very useful trading system. This means that you should not take a trade blindly, but rather that there is another confirmation to take the trade you can use this for perfect entry and perfect exit
This trading opportunity is based on volume, previous price, and price range , are included
Entry/Exit point's:
- It has very easy entry and exit points
- In this pair of lines with two colors are given (RED AND BLUE)
- In this the blue line is used to take long entry and the red line is used to take short entry (But it is all based on a more conformation from your trading plan)
Stop Loss/Take Profit:
Stop Loss
- According to this, if you take a long trade, its stop loss will be the red line just below ( A trade can exit either when the price crosses the red line or the 5 minute candlestick crosses the red line. (This can be done according to your preference) )
- A short entry should use the opposite rules to a long entry
Take Profit
-When you take a long entry according to the profit to be booked is on the next red line above. ( Or if there are other reasons, it can be a safe exit )
- Opposite rules for booking profit on long entry are to book profit on short trade. ( The blue line above is the stop loss of short entry )
Timeframe:
According to this, the time frame you should use while taking trades is 5 minutes time frames . (5 minute time frame works well in this)
Risk Disclaimer:
Trading carries significant risk and is not suitable for all traders. You may lose some or all of your capital in a matter of minutes or hours. Market conditions can change rapidly, and prices can move against you quickly. You may not always be able to exit at a favorable price, and you may be required to hold a position overnight, exposing yourself to additional risk. Day trading involves high risk, high leverage, and high stakes, and you should only trade with funds you can afford to lose. Please carefully consider your financial situation, risk tolerance, and trading objectives before engaging in day trading.
Engagement:
Share your insights, ask questions, and learn from others in the community. Whether you're a seasoned pro or just starting out, we're all in this together.
What's your take on the current market conditions? Which trading strategies are working for you? Let's discuss and help each other grow as traders!
Comment below and let's get the conversation started!
Original Content:
This trading setup is the result of my own innovation and expertise, and is not based on any publicly available information or third-party systems. It is a reflection of my dedication to developing a competitive edge in the markets.
BANK-NIFTY TRADING LEVELS FOR 27-05-2024Explanation:
This is a very useful trading system. This means that you should not take a trade blindly, but rather that there is another confirmation to take the trade you can use this for perfect entry and perfect exit
This trading opportunity is based on volume, previous price, and price range , are included
Entry/Exit point's:
- It has very easy entry and exit points
- In this pair of lines with two colors are given (RED AND BLUE)
- In this the blue line is used to take long entry and the red line is used to take short entry (But it is all based on a more conformation from your trading plan)
Stop Loss/Take Profit:
Stop Loss
- According to this, if you take a long trade, its stop loss will be the red line just below ( A trade can exit either when the price crosses the red line or the 5 minute candlestick crosses the red line. (This can be done according to your preference) )
- A short entry should use the opposite rules to a long entry
Take Profit
-When you take a long entry according to the profit to be booked is on the next red line above. ( Or if there are other reasons, it can be a safe exit )
- Opposite rules for booking profit on long entry are to book profit on short trade. ( The blue line above is the stop loss of short entry )
Timeframe:
According to this, the time frame you should use while taking trades is 5 minutes time frames . (5 minute time frame works well in this)
Risk Disclaimer:
Trading carries significant risk and is not suitable for all traders. You may lose some or all of your capital in a matter of minutes or hours. Market conditions can change rapidly, and prices can move against you quickly. You may not always be able to exit at a favorable price, and you may be required to hold a position overnight, exposing yourself to additional risk. Day trading involves high risk, high leverage, and high stakes, and you should only trade with funds you can afford to lose. Please carefully consider your financial situation, risk tolerance, and trading objectives before engaging in day trading.
Engagement:
Share your insights, ask questions, and learn from others in the community. Whether you're a seasoned pro or just starting out, we're all in this together.
What's your take on the current market conditions? Which trading strategies are working for you? Let's discuss and help each other grow as traders!
Comment below and let's get the conversation started!
Original Content:
This trading setup is the result of my own innovation and expertise, and is not based on any publicly available information or third-party systems. It is a reflection of my dedication to developing a competitive edge in the markets.

DOLLAR INDEX - BEARISH SCENARIO 📉Hello Traders !
On Wednesday 22 May, The Dollar Index reached a resistance level (105.123 - 104.915) and failed to break it!
Let's expect the bearish scenario:
If the price breaks and closes below the higher low
We will see a bearish move📉
-------------
TARGET: 104.210🎯

NAS100 Bullish wave On the macro - nas 100 is currently in a bullish elliot wave
observing previous years/months its looking like the peak of the 3rd leg will be around july 2024 then retrace down until october 2024 when it will create the 4th leg to take it higher for the rest of the year into next year
Paytience pays

BANK NIFTY INTRADAY LEVELS FOR 28 MAY 2024BUY ABOVE - 49010
SL - 48800
TARGETS - 49250,49480,49610
SELL BELOW - 48800
SL - 49010
TARGETS - 48620,48460,48250
NO TRADE ZONE - 48800 to 49010
Previous Day High - 49010
Previous Day Low - 48620
Based on price action major support & resistance's are here, the red lines acts as resistances, the green lines acts as supports. If the price breaks the support/resistance, it will move to the next support/resistance line. White lines indicates previous day high & low, high acts as a resistance & low acts as a support for next day.
Trendlines are also significant to price action. If the price is above/below the trendlines, can expect an UP/DOWN with aggressive move.
Please NOTE: this levels are for intraday trading only.
Disclaimer - All information on this page is for educational purposes only,
we are not SEBI Registered, Please consult a SEBI registered financial advisor for your financial matters before investing And taking any decision. We are not responsible for any profit/loss you made.
Request your support and engagement by liking and commenting & follow to provide encouragement
HAPPY TRADING 👍

CHART BREAKDOWN US30: Key Levels, Targets and Thoughts!🎯Brief Description🖊️:
The chart provides insights into critical market levels, emphasizing an essential supply zone (medium-risk sell zone) spanning from 40050 to 40090, respectively, are highlighted.
Things I Have Seen👀:
Medium-Risk Sell Zone🟠: Noted between 40050 and 40090, suggesting another area with moderate risk for potential selling positions.
Bearish Targets📉:
40000: Possible retracement area.
39900: Possible retracement area.
39800: Area with laying low liquidity.
Ultimate Target: 39600- Essential Demand Zone
What's Important Now❗
Currently, the crucial approach is to wait and observe the price action at this level. We need to assess how the market reacts before considering any decisive moves. Stay observant and responsive to real-time developments in the market.

US500 Potential UpsidesHey Traders, in today's trading session we are monitoring US500 for a buying opportunity around 5260 zone, US500 is trading in an uptrend and currently is in a correction phase in which it is approaching the trend at 5260 support and resistance area.
Trade safe, Joe.

Nifty Daily | Trading Range | Key levelsNifty Daily | Trading Range | Key levels
21841/22464/23059
22464 is center point.. for 21841/23059

CHART BREAKDOWN NASDAQ: Key Levels, Targets and Thoughts!🎯Brief Description🖊️:
The chart provides insights into critical market levels, emphasizing an essential demand zone (low-risk buy zone) spanning from 18330 to 18315. Additionally, medium-risk sell zone between 18870-18920, respectively, are highlighted.
Things I Have Seen👀:
Important Demand Zone🟢: Identified between 18330 and 18315, serving as a low-risk buy.
Medium-Risk Sell Zone🟠: Noted between 18870 and 18920, suggesting another area with moderate risk for potential selling positions.
Bearish Targets📉:
18850: Possible retracement area.
18700: Possible retracement area.
18500: Area with laying low liquidity.
Ultimate Target: 18330- Essential Demand Zone
Bullish Targets📈:
18400: Possible retracement area.
18500: Possible retracement area.
18580: Possible retracement area.
18670: Area with a lot of liquidity.
What's Important Now❗
Currently, the crucial approach is to wait and observe the price action at this level. We need to assess how the market reacts before considering any decisive moves. Stay observant and responsive to real-time developments in the market.

Falling towards 50% Fibonacci support?Dow Jones (US30) is falling towards the pivot which has been identified as a pullback support and could bounce to the 1st resistance which acts as an overlap resistance.
Pivot: 38,957.67
1st Support: 38,574.85
1st Resistance: 39,413.17
Risk Warning:
Trading Forex and CFDs carries a high level of risk to your capital and you should only trade with money you can afford to lose. Trading Forex and CFDs may not be suitable for all investors, so please ensure that you fully understand the risks involved and seek independent advice if necessary.
Disclaimer:
The above opinions given constitute general market commentary, and do not constitute the opinion or advice of IC Markets or any form of personal or investment advice.
Any opinions, news, research, analyses, prices, other information, or links to third-party sites contained on this website are provided on an "as-is" basis, are intended only to be informative, is not an advice nor a recommendation, nor research, or a record of our trading prices, or an offer of, or solicitation for a transaction in any financial instrument and thus should not be treated as such. The information provided does not involve any specific investment objectives, financial situation and needs of any specific person who may receive it. Please be aware, that past performance is not a reliable indicator of future performance and/or results. Past Performance or Forward-looking scenarios based upon the reasonable beliefs of the third-party provider are not a guarantee of future performance. Actual results may differ materially from those anticipated in forward-looking or past performance statements. IC Markets makes no representation or warranty and assumes no liability as to the accuracy or completeness of the information provided, nor any loss arising from any investment based on a recommendation, forecast or any information supplied by any third-party.

Nifty - Expiry Ending 30th May 2025Nifty closed above the channel mid line last week. Hence, unless it falls below this middle line, I won't go short. I will wait for a retracement and go long till the channel top. Again, to remind that I won't take any trade if Nifty doesn't work as per my analysis. Thank you!
-------------------------------------------------------
INSIGHTS:
-------------------------------------------------------
As usual, I will keep sharing my insights which are based on my personal experience in trading.
1. Please stop watching foreign markets, it won't help but will corrupt your viewpoint and ultimately you will either lose an opportunity or make a loss.
2. Market will not keep taking SL again and again, it has to decide a trend after some time. But if it takes 2-3 SL, just stop and wait for another opportunity.
3. In case you have 2-3 SL hits, immediately stop looking at market, leave your computer, watch some movies or go some place with family or do any other leisure activities, but just get the market out of your head, believe me it helps a lot.
4. If there is a SL, DO NOT THINK TWICE, JUST EXIT, IT IS JUST 20-30 POINTS, you will be getting 100 - 300 points in another trade if you simply take SL this time without thinking twice. But if you show ego to market or think that let me watch for some time, you will definitely regret it. Sometimes you may be right, but that will be just pure luck and gambling.
5. Trade with long term view point, even if you are initiating an intraday, have a weekly viewpoint, so that you will have conviction to either carry forward or just exit if you are not convinced.

US30 (Technical and Geopolitical Weekly Analysis)Technical and Geopolitical Analysis:
The previous weekly chart indicated a strong upward movement, but the market is now poised to react to geopolitical pressures, particularly the tensions between China and Taiwan, expected to intensify this week and continue into next month.
Technical Analysis:
Bullish Scenario: If the price stabilizes above 38,700, it is likely to move between 38,700 and 40,050. Any sustained stability above 40,005 will signal a continuation of the bullish trend, potentially reaching 40,970. A retest at 40,005 could occur before the bullish trend resumes.
Bearish Scenario: The bearish trend will be confirmed if the price closes below 38,700 on at least the daily chart, targeting 37,990. The next significant support level is 36,460, which is strong support for this year.
Key Levels:
Pivot Line: 38,700
Resistance Prices: 39,500, 40,005, 40,970
Support Prices: 38,300, 37,990, 36,460
The expected trading range will be between the support at 37,990 and the resistance at 40,050.

Nasdaq Not Over Yet !Hi mates sharing a long view on Nasdaq as price break resistance (18350) and sustaining very well above and by the today's candle price breached the high of breakout candle too which is a good sign for resistance breakout so from here onwards i am looking some more upside movement in coming sessions friends. Traget meausured from the swing high to swing low made before this breakout and by the rising resistance line too and it seems logical too me.
Breakout retest- So as we can see that a proper breakout retest not happened so far after breakout which could provide the best entry as we can minimize our risk in any of trade by these type of retest entries as price earlier retested too it's breakout mentioned on provided chart, Rest i will update idea accordingly whenever needed and good to share anything about this publication.
This idea is meant for only educational purpose this not any kind of trading or investment advice.
Best Regards- Amit

Heading into 61.8% Fibonacci resistance?DE40 is rising towards the pivot and could potentially reverse to the 1st support.
Pivot: 18,773.31
1st Support: 18,539.97
1st Resistance: 18,929.08
Risk Warning:
Trading Forex and CFDs carries a high level of risk to your capital and you should only trade with money you can afford to lose. Trading Forex and CFDs may not be suitable for all investors, so please ensure that you fully understand the risks involved and seek independent advice if necessary.
Disclaimer:
The above opinions given constitute general market commentary, and do not constitute the opinion or advice of IC Markets or any form of personal or investment advice.
Any opinions, news, research, analyses, prices, other information, or links to third-party sites contained on this website are provided on an "as-is" basis, are intended only to be informative, is not an advice nor a recommendation, nor research, or a record of our trading prices, or an offer of, or solicitation for a transaction in any financial instrument and thus should not be treated as such. The information provided does not involve any specific investment objectives, financial situation and needs of any specific person who may receive it. Please be aware, that past performance is not a reliable indicator of future performance and/or results. Past Performance or Forward-looking scenarios based upon the reasonable beliefs of the third-party provider are not a guarantee of future performance. Actual results may differ materially from those anticipated in forward-looking or past performance statements. IC Markets makes no representation or warranty and assumes no liability as to the accuracy or completeness of the information provided, nor any loss arising from any investment based on a recommendation, forecast or any information supplied by any third-party.

US30 Bias fairly bearish for a short term till we drop back down to 38600 area . follow the arrows for directional market flow . look for sells inside the supply area and hold till we get to 38600 area

Good analysis, good idea, hope it helps youHello, trader.
The bearish trend is currently very strong for DOW JONES - MINI DJ30 FULL0624. As long as the price remains below the resistance at 39,463 USD, you could try to take advantage of the bearish rally. The first bearish objective is located at 38,537 USD. The bearish momentum would be revived by a break in this support. Sellers would then use the next support located at 37,991 USD as an objective. Crossing it would then enable sellers to target 36,795 USD. Be careful, given the powerful bearish rally underway, excesses could lead to a short-term rebound. If this is the case, remember that trading against the trend may be riskier. It would seem more appropriate to wait for a signal indicating reversal of the trend.
MY OPINION
BEARISH UNDER 39,463 USD
MY TARGETS
USD 38,537 (-1.56%)
37,991 USD (-2.95%)
Happy trade

Hellena | DJI (4H): Short to the area of 38566.67.Dear colleagues, I believe that the impulse of the senior wave “1” is not yet over.
I assume that the correction is now in priority, so 2 variants of events are possible:
1) formation of lower wave “4” and “5” (39863.75), then correction with the aim to reach the area of 38566.67;
2) The correction will start soon without a new high, but in this case we will have to reconsider the waves.
Manage your capital correctly and competently! Only enter trades based on reliable patterns!

NASDAQ. Weekly trading levels 27 - 31.05.2024During the week you can trade from these price levels. Finding the entry point into a transaction and its support is up to you, depending on your trading style and the development of the situation. Zones show preferred price ranges WHERE to look for an entry point into a trade.
If you expect any medium-term price movements, then most likely they will start from one of the zones.
Levels are valid for a week, the date is in the title. Next week I will adjust the levels based on new data and publish a new post.
! Please note that brokers have a difference in quotes, take this into account when trading.
The history of level development can be seen in my previous posts. They cannot be edited or deleted. Everything is fair. :)
----------------------------------------------
I don’t play guess the direction (that’s why there are no directional arrows), but zones (levels) are used for trading. We wait for the zone to approach, watch the reaction, and enter the trade.
Levels are drawn based on volumes and data from the CME. They are used as areas of interest for trading. Traded as classic support/resistance levels. We see the reaction to the rebound, we trade the rebound. We see a breakout and continue to trade on a rollback to the level. The worst option is if we revolve around the zone in a flat.
Do not reverse the market at every level; if there is a trend movement, consider it as an opportunity to continue the movement. Until the price has drawn a reversal pattern.
Don't forget to like Rocket and Subscribe!!! Feedback is very important to me!

Hellena | SPX500 (4H): Short to 38.2% Fibo lvl 5205.Dear colleagues, I think that the price has either already completed or is about to complete the impulsive movement in wave “1”, so I expect the beginning of correction at least to the area of 38.2% Fibonacci level 5205. It is quite possible that the price will update the high and reach the area of 5375 before starting the correction.
Manage your capital correctly and competently! Only enter trades based on reliable patterns!


US30 - Watch Buy Zone!US30 is creating a really interesting pattern.
We could be in an impulse/diagonal - Both of which follow similar rules. Wave 2 was a clear flat correction = 335, which broke out upwards of 23%!
We are seeing a similar correction to wave 2 now. Typically wave 4 retraces atleast to the 38.2 fibonacci level. This is where we'll have our buy zone.
We want to see 5 wave move down for subwave C (of wave 4). If all goes according to plan, we can draw an entry trendline using points 2 and 4 of subwave C to catch the 5th move higher.
Should be an easy trade!
Will update this setup if this gets enough engagement.
Goodluck and as always, trade safe!
