Daily Analysis - 06/06/2024 - The Modern Day TraderSpotlight Pair: USDZAR - Short
- Daily IRL (Fair Value Gap) currently holding with a failure to invert yesterday and a large wick to the upside today indicate bearish pressure.
- 1H Market Maker Model with 2 clear corrections before the current pending market structure shift.
- M15 inverted fair value gaps which are already indicated an imminent sell off.
Be mindful of a mitigation of the 4H fair value gap and then price trading higher around tomorrow's (07/06/24) true open as a strong indication of price heading lower.
Sam
The Modern Day Trader
Market indices

US30 PredictionBeginning with our weekly timeframe, we have seen that US30 has twice struck a zone of strong resistance. US30 hit an all-time high of 39,984.1 on April 1, 2024. On Monday, May 20, 2024, that level was again hit, forming a double top and, in accordance with our trendline, a resistance level.
The market subsequently dropped right away to the zone 38,023.1, which was a solid area of support. We are now in a bullish rise that I believe will retrace to about 39,007.1. At that point, I will open a sell position and aim to capture my profits at the levels listed below.
TP1: 38,799.2
TP2: 38,348.6
TP3: 38,017.5
TP4: 37,673.3
TP5: 37,282.4
Moreover, if the forex gods are insane
TP6: 36,026.4
I appreciate you viewing my analysis.
Any and all criticism is appreciated.

SP500 WILL KEEP RISINGSP500 Is approaching main trend line and looks weak on smaller time frame. I think we will see a long squeeze that will make the price to drop, probably around 5340-5330. At this level i Will look for a long entry that may come later with the NFP. I think we will see new highs next week, after a flash crash

NIFTY- Intraday Levels - 5th June 2024
*Levels recorded at 12:20 PM
*Consider +/- 11 points buffer in below levels.
*Probably levels will be valid for 6th June as well not 100% sure
If NIFTY sustain above 22455 then 22513 to 22526 above this bullish then 22811 to 22824 above this more bullish
If NIFTY sustain below 22228 to 22191 then below this bearish then 21994 to 21966 then 21769 to 21741below this more bearish
Please do your due diligence before trading or investment.
**Disclaimer -
I am not a SEBI registered analyst or advisor. I does not represent or endorse the accuracy or reliability of any information, conversation, or content. Stock trading is inherently risky and the users agree to assume complete and full responsibility for the outcomes of all trading decisions that they make, including but not limited to loss of capital. None of these communications should be construed as an offer to buy or sell securities, nor advice to do so. The users understands and acknowledges that there is a very high risk involved in trading securities. By using this information, the user agrees that use of this information is entirely at their own risk.
Thank you.

Short DXYWith the payrolls data in the US calendar, I forecast a softer figure to be printed, which will further weaken USD.
The labor market numbers from the last few days confirm that we are on a trajectory of easing.


Trend line resistance and supportsTrend line resistance and supports provided are working very well as shown in the chart. It will give confidence in investing as need to know how much it will fall or vice versa.

Nifty Support 200 EMAhas taken support 21247 as 200 EMA
RSI near 40
but weekly below 60
but monthly above 60
Let see there is hope

check the trend According to the behavior of the index in the current support range, possible scenarios have been identified.
If the price crosses the support range, it will be possible to continue the downward trend until the specified support levels

possibility of uptrend If the index can stabilize above the resistance range, it will be possible to continue the upward trend up to the specified resistance levels.
Otherwise, the initiation of the corrective process will be likely

Us100_shI believe the price has reached an overbought stage, and we might see a strong decline towards the specified areas. Currently, the price is in a distribution zone. We could witness a rapid surge to break the selling positions, followed by a continuation of the decline. Therefore, my stop-loss is set to be triggered by the closure of a 15-minute candle above the specified area shown in the image to stop the loss.

NASDAQSo we hit ATH again! Good work to all those who bought all the way up.
Now, it's time us bears take over.
Price moved up very aggressively and is due for a correction or relief.
We formed a nice double top which is indicating that the bulls are done and ready to step down.
Selling at the current level is not a bad move. I have opened a short with a tight SL.
Let's see what impact the news and NFP will have moving towards the end of the week.
Good luck, have fun!

NAS100 H4 | Bullish momentum to extend further?NAS100 could fall towards a pullback support and potentially bounce off this level to climb higher.
Buy entry is at 18,955.13 which is a pullback support.
Stop loss is at 18,670.00 which is a level that lies underneath an overlap support and the 38.2% Fibonacci retracement level.
Take profit is between 19,125.04 and 19,228.63 which is a zone that is identified by the 61.8% Fibonacci projection and the 127.2% Fibonacci extension levels.
High Risk Investment Warning
Trading Forex/CFDs on margin carries a high level of risk and may not be suitable for all investors. Leverage can work against you.
Stratos Markets Limited (www.fxcm.com):
CFDs are complex instruments and come with a high risk of losing money rapidly due to leverage. 68% of retail investor accounts lose money when trading CFDs with this provider. You should consider whether you understand how CFDs work and whether you can afford to take the high risk of losing your money.
Stratos Europe Ltd, previously FXCM EU Ltd (www.fxcm.com):
CFDs are complex instruments and come with a high risk of losing money rapidly due to leverage. 70% of retail investor accounts lose money when trading CFDs with this provider. You should consider whether you understand how CFDs work and whether you can afford to take the high risk of losing your money.
Stratos Trading Pty. Limited (www.fxcm.com):
Trading FX/CFDs carries significant risks. FXCM AU (AFSL 309763), please read the Financial Services Guide, Product Disclosure Statement, Target Market Determination and Terms of Business at www.fxcm.com
Stratos Global LLC (www.fxcm.com):
Losses can exceed deposits.
Please be advised that the information presented on TradingView is provided to FXCM (‘Company’, ‘we’) by a third-party provider (‘TFA Global Pte Ltd’). Please be reminded that you are solely responsible for the trading decisions on your account. There is a very high degree of risk involved in trading. Any information and/or content is intended entirely for research, educational and informational purposes only and does not constitute investment or consultation advice or investment strategy. The information is not tailored to the investment needs of any specific person and therefore does not involve a consideration of any of the investment objectives, financial situation or needs of any viewer that may receive it. Kindly also note that past performance is not a reliable indicator of future results. Actual results may differ materially from those anticipated in forward-looking or past performance statements. We assume no liability as to the accuracy or completeness of any of the information and/or content provided herein and the Company cannot be held responsible for any omission, mistake nor for any loss or damage including without limitation to any loss of profit which may arise from reliance on any information supplied by TFA Global Pte Ltd.
The speaker(s) is neither an employee, agent nor representative of FXCM and is therefore acting independently. The opinions given are their own, constitute general market commentary, and do not constitute the opinion or advice of FXCM or any form of personal or investment advice. FXCM neither endorses nor guarantees offerings of third-party speakers, nor is FXCM responsible for the content, veracity or opinions of third-party speakers, presenters or participants.

Dow Jones analysis TP hitUs30 sell analysis got TP hit instant with 150 pips
1:1 RR got TP
It's in the news time happened yesterday
Us30 buy side analysis also got 180 pips before In this chart

BANKEX S/R for 7/6/24Support and Resistance Levels: In technical analysis, support and resistance levels are significant price levels where buying or selling interest tends to be strong. They are identified based on previous price levels where the price has shown a tendency to reverse or find support.
Support levels are represented by the green line and green shade, indicating areas where buying interest may emerge to prevent further price decline.
Resistance levels are represented by the red line and red shade, indicating areas where selling pressure may arise to prevent further price increases. Traders often consider these levels as potential buying or selling opportunities.
Breakouts: Breakouts occur when the price convincingly moves above a resistance level (red shade) or below a support level (green shade). A bullish breakout above resistance suggests the potential for further price increases, while a bearish breakout below support suggests the potential for further price declines. Traders pay attention to these breakout signals as they may indicate the start of a new trend or significant price movement.
Disclosure: I am not SEBI registered. The information provided here is for learning purposes only and should not be interpreted as financial advice. It is important to consult with a qualified financial advisor before making any investment decisions. Tweets neither advice nor endorsement.

SENSEX S/R for 7/6/24Support and Resistance Levels: In technical analysis, support and resistance levels are significant price levels where buying or selling interest tends to be strong. They are identified based on previous price levels where the price has shown a tendency to reverse or find support.
Support levels are represented by the green line and green shade, indicating areas where buying interest may emerge to prevent further price decline.
Resistance levels are represented by the red line and red shade, indicating areas where selling pressure may arise to prevent further price increases. Traders often consider these levels as potential buying or selling opportunities.
Breakouts: Breakouts occur when the price convincingly moves above a resistance level (red shade) or below a support level (green shade). A bullish breakout above resistance suggests the potential for further price increases, while a bearish breakout below support suggests the potential for further price declines. Traders pay attention to these breakout signals as they may indicate the start of a new trend or significant price movement.
Disclosure: I am not SEBI registered. The information provided here is for learning purposes only and should not be interpreted as financial advice. It is important to consult with a qualified financial advisor before making any investment decisions. Tweets neither advice nor endorsement.

FIN NIFTY S/R for 7/6/24Support and Resistance Levels: In technical analysis, support and resistance levels are significant price levels where buying or selling interest tends to be strong. They are identified based on previous price levels where the price has shown a tendency to reverse or find support.
Support levels are represented by the green line and green shade, indicating areas where buying interest may emerge to prevent further price decline.
Resistance levels are represented by the red line and red shade, indicating areas where selling pressure may arise to prevent further price increases. Traders often consider these levels as potential buying or selling opportunities.
Breakouts: Breakouts occur when the price convincingly moves above a resistance level (red shade) or below a support level (green shade). A bullish breakout above resistance suggests the potential for further price increases, while a bearish breakout below support suggests the potential for further price declines. Traders pay attention to these breakout signals as they may indicate the start of a new trend or significant price movement.
Disclosure: I am not SEBI registered. The information provided here is for learning purposes only and should not be interpreted as financial advice. It is important to consult with a qualified financial advisor before making any investment decisions. Tweets neither advice nor endorsement.

BANK NIFTY S/R for 7/6/24Support and Resistance Levels: In technical analysis, support and resistance levels are significant price levels where buying or selling interest tends to be strong. They are identified based on previous price levels where the price has shown a tendency to reverse or find support.
Support levels are represented by the green line and green shade, indicating areas where buying interest may emerge to prevent further price decline.
Resistance levels are represented by the red line and red shade, indicating areas where selling pressure may arise to prevent further price increases. Traders often consider these levels as potential buying or selling opportunities.
Breakouts: Breakouts occur when the price convincingly moves above a resistance level (red shade) or below a support level (green shade). A bullish breakout above resistance suggests the potential for further price increases, while a bearish breakout below support suggests the potential for further price declines. Traders pay attention to these breakout signals as they may indicate the start of a new trend or significant price movement.
Disclosure: I am not SEBI registered. The information provided here is for learning purposes only and should not be interpreted as financial advice. It is important to consult with a qualified financial advisor before making any investment decisions. Tweets neither advice nor endorsement.

NIFTY S/R for 7/6/24Support and Resistance Levels: In technical analysis, support and resistance levels are significant price levels where buying or selling interest tends to be strong. They are identified based on previous price levels where the price has shown a tendency to reverse or find support.
Support levels are represented by the green line and green shade, indicating areas where buying interest may emerge to prevent further price decline.
Resistance levels are represented by the red line and red shade, indicating areas where selling pressure may arise to prevent further price increases. Traders often consider these levels as potential buying or selling opportunities.
Breakouts: Breakouts occur when the price convincingly moves above a resistance level (red shade) or below a support level (green shade). A bullish breakout above resistance suggests the potential for further price increases, while a bearish breakout below support suggests the potential for further price declines. Traders pay attention to these breakout signals as they may indicate the start of a new trend or significant price movement.
Disclosure: I am not SEBI registered. The information provided here is for learning purposes only and should not be interpreted as financial advice. It is important to consult with a qualified financial advisor before making any investment decisions. Tweets neither advice nor endorsement.

NASDAQ100 INDEX - 4h Technical analysisThe current short-term bullish acceleration on NASDAQ100 INDEX should quickly allow the basic trend to return to bullish. To avoid contradicting the short term, traders may prefer long positions (at the time of purchase) as long as the price remains well above 18,433.66 USD. Short-term buyers will use the resistance located at 18,677.55 USD as an objective. A bullish break in this resistance would boost the bullish momentum. The next bullish objective would then be set at 18,818.44 USD. Crossing this resistance would then open the door for buyers to target 19,062.33 USD. Caution, if there is a return to under 18,433.66 USD, it should not be forgotten that the basic trend is not yet clearly defined. Beware of against the trend sellers, many of whom will certainly benefit from this movement.

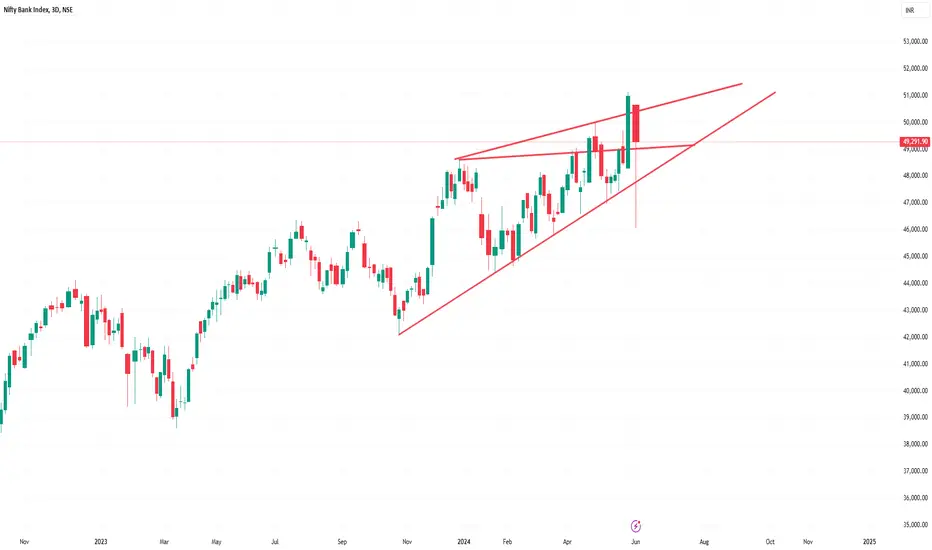
NIFTYBANK: Raining Expectations.We had the Dividend story, now the interest part comes later as part of the policy.
Interest rate cuts from the West dominated by Swiss, Canada, Danish and Europe. Russia is later in the day, and our own today.
The expectation and interest is various, 1. incoming inflation (now that the elections are over the various prices rises are expected and arguably factored too. 2. The Monsoon will be watched 3. Any pencilling of fiscal deficit and the numbers will have to wait for the actual budget to be passed.
In sum, it is narrative than the action or push a thought ready to act depending on the developments. It is happening in West, and one has to keep what East is doing. No cut and paste.
From the TA perspective, the larger damage is averted. Hence some confidence coming back.
The picture has large bullish Maribouzu. The low or open of this candle is 48300 and that is the line in sand for the bulls or bears as the case may be.
Yesterday high is the top and 48300 is the bottom is easy to pencil and work towards.
In between 48600-48900 as supports. Watch any political noise that can appear, rest assured, market would like to have a peaceful week for now than a piercing the range.
NIFTY: The Action, Cut!Turning out to be a week of action, one can read it as weak, if you have not expected this much drama from the market.
It all happens and happening in front of us. Camera, Action and Cut.
When it comes to cut, it started with Swiss, added the Candy (Candian Cut), followed by a Danish and topped with Euro Cut. Season of cuts? extrapolation to US?
Remember, in Currency markets it is relative real rates and growth that drives them; hence dollar remains range as part of the larger corrective pattern before the next leg higher. These cuts if any helped the precious metals to move higher or start their next leg higher.
Our own policy rates later in the day though nothing is expected, markets would like to see the presser.
Globally Canada data continues to deteriorate, while Euro on expected downhill, US having its own mixed data that does not suggest any rush to cuts.
Recall BOC comments, easy monetary conditions, allow restrictive fiscal policy measures, watch for more such focus shifting from monetary to fiscal as part of the adjustment.
From the TA Perspective, picked three parts of the larger move of the wedge, first one, move past the 0.786% (the rise and fall largely respected with this channel. Second too, hit 0.786 (plus near 1%). The current one is ferocious, the excess on the top, takes the excess on the bottom too.
We have hit yesterday the 0.786% hence that is the cap for this move. While this holds (one can push little over the 23050 area), and expect a slow griding down, first towards the 22630 and then towards 22380-22230 area.
Reasonable Risk Reward for the shorts here with the above stops and expectation. In-tra week harami pattern, and the PIP graph which is weekly is bearish meeting candle (even if we close near 23000), coming after dark cloud pattern. (ignoring the large wick of the meeting candle)
Supports 22765-22720-22680
Supply 22880-22930-22980

Bullish Momentum Persists Despite NAS100 Selling PressureHello Everyone,
Once more, we've achieved our target for NAS100! Despite witnessing substantial selling pressure, the prevailing outlook remains bullish, indicating an enduring positive sentiment.
TradeWithTheTrend3344
