NAS100 ANTICIPATIONReason for nas100 to drop it is being that now
1.we are in a bearish trend as the market changed structure
2.Market gave bearish confirmation through CHOCH and BOS
3.Market is sitting on an Order block on 30m TFM
4.Reversal conformation on 30m OB for bearish continuation
Market indices

US500 Potential UpsidesHey Traders, in today's trading session we are monitoring US500 for a buying opportunity around 5260 zone, US500 is trading in an uptrend and currently is in a correction phase in which it is approaching the trend at 5260 support and resistance area.
Trade safe, Joe.

DOLLAR INDEX - BEARISH SCENARIO 📉Hello Traders !
On Wednesday 22 May, The Dollar Index reached a resistance level (105.123 - 104.915) and failed to break it!
Let's expect the bearish scenario:
If the price breaks and closes below the higher low
We will see a bearish move📉
-------------
TARGET: 104.210🎯

NAS100: Inside DayHi everyone and welcome to my channel, please don’t forget to support all my work subscribing and liking my post, and for any question leave me a comment, I will be more than happy to help you!
“Trade setups, not movements”
1. DAY OF THE WEEK (Failed Breakout, False Break, Range Expansion)
Monday DAY 1 Opening Range ✅ Day 3 cycle
Tuesday DAY 2 Initial Balance
Wednesday DAY 3 (reset DAY 1) Mid Point Week
Thursday DAY 2
Friday DAY 3 Closing Range
2. SIGNAL DAY
First Red Day
First Green Day ✅ (possible variation of FGD considering Thursday as a dump day)
3 Days Long Breakout
3 Days Short Breakout
Inside Day ✅
3. WEEKLY TEMPLATE
Pump&Dump ✅
Dump&Pump
Frontside ✅
Backside
4. THESIS:
Long: primary, taking in consideration the Thursday dump, there are high chances to too this market going to stop the trader short from HOW.
Short: secondly the previous LOW hasn't been completely stopped yet, the market can trap volume to retest that level, however, I'm pretty neutral with the bias, giving a little bit of more priority to the FGD (because is the most recent price action)
Please note that the purpose of my analysis is to help me and you hunting the best trade setup for the day, none of my technical aspects are a way to forecast any directional market movement.
Gianni

NIFTY TRADING LEVELS FOR 28-05-2024Explanation:
This is a very useful trading system. This means that you should not take a trade blindly, but rather that there is another confirmation to take the trade you can use this for perfect entry and perfect exit
This trading opportunity is based on volume, previous price, and price range , are included
Entry/Exit point's:
- It has very easy entry and exit points
- In this pair of lines with two colors are given (RED AND BLUE)
- In this the blue line is used to take long entry and the red line is used to take short entry (But it is all based on a more conformation from your trading plan)
Stop Loss/Take Profit:
Stop Loss
- According to this, if you take a long trade, its stop loss will be the red line just below ( A trade can exit either when the price crosses the red line or the 5 minute candlestick crosses the red line. (This can be done according to your preference) )
- A short entry should use the opposite rules to a long entry
Take Profit
-When you take a long entry according to the profit to be booked is on the next red line above. ( Or if there are other reasons, it can be a safe exit )
- Opposite rules for booking profit on long entry are to book profit on short trade. ( The blue line above is the stop loss of short entry )
Timeframe:
According to this, the time frame you should use while taking trades is 5 minutes time frames . (5 minute time frame works well in this)
Risk Disclaimer:
Trading carries significant risk and is not suitable for all traders. You may lose some or all of your capital in a matter of minutes or hours. Market conditions can change rapidly, and prices can move against you quickly. You may not always be able to exit at a favorable price, and you may be required to hold a position overnight, exposing yourself to additional risk. Day trading involves high risk, high leverage, and high stakes, and you should only trade with funds you can afford to lose. Please carefully consider your financial situation, risk tolerance, and trading objectives before engaging in day trading.
Engagement:
Share your insights, ask questions, and learn from others in the community. Whether you're a seasoned pro or just starting out, we're all in this together.
What's your take on the current market conditions? Which trading strategies are working for you? Let's discuss and help each other grow as traders!
Comment below and let's get the conversation started!
Original Content:
This trading setup is the result of my own innovation and expertise, and is not based on any publicly available information or third-party systems. It is a reflection of my dedication to developing a competitive edge in the markets.
BANK-NIFTY TRADING LEVELS FOR 28-05-2024Explanation:
This is a very useful trading system. This means that you should not take a trade blindly, but rather that there is another confirmation to take the trade you can use this for perfect entry and perfect exit
This trading opportunity is based on volume, previous price, and price range , are included
Entry/Exit point's:
- It has very easy entry and exit points
- In this pair of lines with two colors are given (RED AND BLUE)
- In this the blue line is used to take long entry and the red line is used to take short entry (But it is all based on a more conformation from your trading plan)
Stop Loss/Take Profit:
Stop Loss
- According to this, if you take a long trade, its stop loss will be the red line just below ( A trade can exit either when the price crosses the red line or the 5 minute candlestick crosses the red line. (This can be done according to your preference) )
- A short entry should use the opposite rules to a long entry
Take Profit
-When you take a long entry according to the profit to be booked is on the next red line above. ( Or if there are other reasons, it can be a safe exit )
- Opposite rules for booking profit on long entry are to book profit on short trade. ( The blue line above is the stop loss of short entry )
Timeframe:
According to this, the time frame you should use while taking trades is 5 minutes time frames . (5 minute time frame works well in this)
Risk Disclaimer:
Trading carries significant risk and is not suitable for all traders. You may lose some or all of your capital in a matter of minutes or hours. Market conditions can change rapidly, and prices can move against you quickly. You may not always be able to exit at a favorable price, and you may be required to hold a position overnight, exposing yourself to additional risk. Day trading involves high risk, high leverage, and high stakes, and you should only trade with funds you can afford to lose. Please carefully consider your financial situation, risk tolerance, and trading objectives before engaging in day trading.
Engagement:
Share your insights, ask questions, and learn from others in the community. Whether you're a seasoned pro or just starting out, we're all in this together.
What's your take on the current market conditions? Which trading strategies are working for you? Let's discuss and help each other grow as traders!
Comment below and let's get the conversation started!
Original Content:
This trading setup is the result of my own innovation and expertise, and is not based on any publicly available information or third-party systems. It is a reflection of my dedication to developing a competitive edge in the markets.

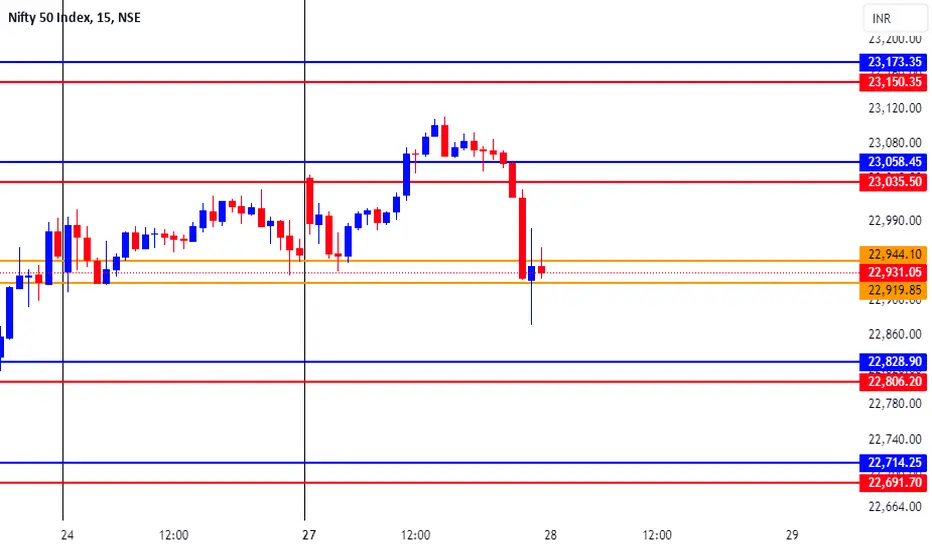
NIFTY Trading Plan and Levels for 28-May-2024
On Monday, NIFTY showed a recovery from its initial dip, sustaining above 23059 for some time. However, it experienced a drop before reaching our target of 23142 and managed to hold the lower band of the profit booking zone at 22915 in the last hour. For Tuesday, we anticipate a continuation of the correction structure followed by a recovery. Let's discuss various opening scenarios and the associated levels:
Gap Up Opening
Scenario: If NIFTY opens above 23000 and sustains above 23075 for the first trading hour.
Expectations: Prices can trend towards 23139 – 23175.
Risk: If prices fail to sustain and start trading below 22980, a follow-on correction is likely.
Downside Targets: 22890 – 22800 and 22794.
Flat Opening
Scenario: If NIFTY opens flat and faces rejection near 23000.
Expectations: A follow-up drop towards the correction target of 22890 – 22800 – 22794.
Buying Opportunity: Only if prices sustain above 23075 without breaking the previous session's low.
Gap Down Opening
Scenario: If NIFTY opens below 22890 and faces rejection near 22890 – 22900.
Expectations: Initial downside targets are 22800 – 22794, followed by a potential bounce.
Risk: If prices fail to sustain at 22790, further downside to 22688 is possible.
Conclusion: The expected trading pattern suggests an initial follow-up drop to complete the correction structure, followed by a recovery. Traders should monitor the key levels for confirmation and manage risk accordingly.
Disclaimer: This analysis is based on technical patterns and market behavior. Market conditions can change rapidly, and traders should use this information in conjunction with other analyses and risk management practices.

DAX-STRENGTH LEADERDax: Weekly clean 1-2 RTM , Our Bullish confirmation pattern, expecting extended Run
Previous daily high broken and expecting volume at US open
Note:Bullish

NIFTY: Confident Crowding!Bulls break the highs, post new weekly closing high.
The back-to-back strong bull candles have not appeared since NOV 2023, that is near six months. Arguably the best foot when the bears least expected the same.
Previous resistance now strong support around the 22800 area.
With Exit poll looks real poll and the confidence that the market is showing as exit poll confidence, markets are looking to stretch than succumb.
What it means later one has to wait and see, suffice to note the canvass is optimistic above 22800. The upwards sloping channel still remains the territory and within this the action to remain.
What it takes out in the process, when the actual results unfold, the ability of market to substantially move higher is blunted. Thus, any disappointments will be sharp to say the least.
With US markets on holiday not much of clues, some stray data coming from the Europe. The last but one phase of election markets likely to ignore.
Month End expiry, possibly hike in margins by the weekend to handle the volatility are some of the points to keep having manageable positions.
Supports 22890-22840-22795
Supply 22995-23040-23108

CHART BREAKDOWN US30: Key Levels, Targets and Thoughts!🎯Brief Description🖊️:
The chart provides insights into critical market levels, emphasizing an essential supply zone (medium-risk sell zone) spanning from 40050 to 40090, respectively, are highlighted.
Things I Have Seen👀:
Medium-Risk Sell Zone🟠: Noted between 40050 and 40090, suggesting another area with moderate risk for potential selling positions.
Bearish Targets📉:
40000: Possible retracement area.
39900: Possible retracement area.
39800: Area with laying low liquidity.
Ultimate Target: 39600- Essential Demand Zone
What's Important Now❗
Currently, the crucial approach is to wait and observe the price action at this level. We need to assess how the market reacts before considering any decisive moves. Stay observant and responsive to real-time developments in the market.

Falling towards 50% Fibonacci support?Dow Jones (US30) is falling towards the pivot which has been identified as a pullback support and could bounce to the 1st resistance which acts as an overlap resistance.
Pivot: 38,957.67
1st Support: 38,574.85
1st Resistance: 39,413.17
Risk Warning:
Trading Forex and CFDs carries a high level of risk to your capital and you should only trade with money you can afford to lose. Trading Forex and CFDs may not be suitable for all investors, so please ensure that you fully understand the risks involved and seek independent advice if necessary.
Disclaimer:
The above opinions given constitute general market commentary, and do not constitute the opinion or advice of IC Markets or any form of personal or investment advice.
Any opinions, news, research, analyses, prices, other information, or links to third-party sites contained on this website are provided on an "as-is" basis, are intended only to be informative, is not an advice nor a recommendation, nor research, or a record of our trading prices, or an offer of, or solicitation for a transaction in any financial instrument and thus should not be treated as such. The information provided does not involve any specific investment objectives, financial situation and needs of any specific person who may receive it. Please be aware, that past performance is not a reliable indicator of future performance and/or results. Past Performance or Forward-looking scenarios based upon the reasonable beliefs of the third-party provider are not a guarantee of future performance. Actual results may differ materially from those anticipated in forward-looking or past performance statements. IC Markets makes no representation or warranty and assumes no liability as to the accuracy or completeness of the information provided, nor any loss arising from any investment based on a recommendation, forecast or any information supplied by any third-party.

BANK NIFTY INTRADAY LEVELS FOR 28 MAY 2024BUY ABOVE - 49010
SL - 48800
TARGETS - 49250,49480,49610
SELL BELOW - 48800
SL - 49010
TARGETS - 48620,48460,48250
NO TRADE ZONE - 48800 to 49010
Previous Day High - 49010
Previous Day Low - 48620
Based on price action major support & resistance's are here, the red lines acts as resistances, the green lines acts as supports. If the price breaks the support/resistance, it will move to the next support/resistance line. White lines indicates previous day high & low, high acts as a resistance & low acts as a support for next day.
Trendlines are also significant to price action. If the price is above/below the trendlines, can expect an UP/DOWN with aggressive move.
Please NOTE: this levels are for intraday trading only.
Disclaimer - All information on this page is for educational purposes only,
we are not SEBI Registered, Please consult a SEBI registered financial advisor for your financial matters before investing And taking any decision. We are not responsible for any profit/loss you made.
Request your support and engagement by liking and commenting & follow to provide encouragement
HAPPY TRADING 👍

S&P500 Buy opportunity on 4H.The S&P500 index is recovering from the last Higher Low at the bottom of the Channel Up, which even broke below the 4H MA50 (blue trend-line) last Thursday for the first time since May 02. The 4H MACD is forming the first Bullish Cross since that very same date, which was also a recovery sequence after a bottom on the Channel Up pattern.
Having also breached into the Ichimoku Cloud and rebounded, we expect a similar short-term rally towards the top (Higher Highs trend-line) of the Channel Up. That rally's first stop was on the 1.618 Fibonacci extension. As a result, our current Target is 5400 (marginally below the 1.618 Fib).
-------------------------------------------------------------------------------
** Please LIKE 👍, FOLLOW ✅, SHARE 🙌 and COMMENT ✍ if you enjoy this idea! Also share your ideas and charts in the comments section below! This is best way to keep it relevant, support us, keep the content here free and allow the idea to reach as many people as possible. **
-------------------------------------------------------------------------------
💸💸💸💸💸💸
👇 👇 👇 👇 👇 👇


CHART BREAKDOWN NASDAQ: Key Levels, Targets and Thoughts!🎯Brief Description🖊️:
The chart provides insights into critical market levels, emphasizing an essential demand zone (low-risk buy zone) spanning from 18330 to 18315. Additionally, medium-risk sell zone between 18870-18920, respectively, are highlighted.
Things I Have Seen👀:
Important Demand Zone🟢: Identified between 18330 and 18315, serving as a low-risk buy.
Medium-Risk Sell Zone🟠: Noted between 18870 and 18920, suggesting another area with moderate risk for potential selling positions.
Bearish Targets📉:
18850: Possible retracement area.
18700: Possible retracement area.
18500: Area with laying low liquidity.
Ultimate Target: 18330- Essential Demand Zone
Bullish Targets📈:
18400: Possible retracement area.
18500: Possible retracement area.
18580: Possible retracement area.
18670: Area with a lot of liquidity.
What's Important Now❗
Currently, the crucial approach is to wait and observe the price action at this level. We need to assess how the market reacts before considering any decisive moves. Stay observant and responsive to real-time developments in the market.

Heading into 61.8% Fibonacci resistance?DE40 is rising towards the pivot and could potentially reverse to the 1st support.
Pivot: 18,773.31
1st Support: 18,539.97
1st Resistance: 18,929.08
Risk Warning:
Trading Forex and CFDs carries a high level of risk to your capital and you should only trade with money you can afford to lose. Trading Forex and CFDs may not be suitable for all investors, so please ensure that you fully understand the risks involved and seek independent advice if necessary.
Disclaimer:
The above opinions given constitute general market commentary, and do not constitute the opinion or advice of IC Markets or any form of personal or investment advice.
Any opinions, news, research, analyses, prices, other information, or links to third-party sites contained on this website are provided on an "as-is" basis, are intended only to be informative, is not an advice nor a recommendation, nor research, or a record of our trading prices, or an offer of, or solicitation for a transaction in any financial instrument and thus should not be treated as such. The information provided does not involve any specific investment objectives, financial situation and needs of any specific person who may receive it. Please be aware, that past performance is not a reliable indicator of future performance and/or results. Past Performance or Forward-looking scenarios based upon the reasonable beliefs of the third-party provider are not a guarantee of future performance. Actual results may differ materially from those anticipated in forward-looking or past performance statements. IC Markets makes no representation or warranty and assumes no liability as to the accuracy or completeness of the information provided, nor any loss arising from any investment based on a recommendation, forecast or any information supplied by any third-party.

BANK NIFTY INTRADAY LEVELS FOR 28 MAY 2024BUY ABOVE - 49480
SL - 49290
TARGETS - 49670,49850,50000
SELL BELOW - 49290
SL - 49480
TARGETS - 49050,48800,48620
NO TRADE ZONE - 49050 to 49670
Previous Day High - 49670
Previous Day Low - 49050
Based on price action major support & resistance's are here, the red lines acts as resistances, the green lines acts as supports. If the price breaks the support/resistance, it will move to the next support/resistance line. White lines indicates previous day high & low, high acts as a resistance & low acts as a support for next day.
Trendlines are also significant to price action. If the price is above/below the trendlines, can expect an UP/DOWN with aggressive move.
Please NOTE: this levels are for intraday trading only.
Disclaimer - All information on this page is for educational purposes only,
we are not SEBI Registered, Please consult a SEBI registered financial advisor for your financial matters before investing And taking any decision. We are not responsible for any profit/loss you made.
Request your support and engagement by liking and commenting & follow to provide encouragement
HAPPY TRADING 👍

NIFTY INTRADAY LEVELS FOR 28 MAY 2024BUY ABOVE - 22960
SL - 22910
TARGETS - 23020,23100,23180
SELL BELOW - 22910
SL - 22960
TARGETS - 22850,22780,22780
NO TRADE ZONE - 22910 to 22960
Previous Day High - 23100
Previous Day Low - 22910
Based on price action major support & resistance's are here, the red lines acts as resistances, the green lines acts as supports. If the price breaks the support/resistance, it will move to the next support/resistance line. White lines indicates previous day high & low, high acts as a resistance & low acts as a support for next day.
Trendlines are also significant to price action. If the price is above/below the trendlines, can expect an UP/DOWN with aggressive move.
Please NOTE: this levels are for intraday trading only.
Disclaimer - All information on this page is for educational purposes only,
we are not SEBI Registered, Please consult a SEBI registered financial advisor for your financial matters before investing And taking any decision. We are not responsible for any profit/loss you made.
Request your support and engagement by liking and commenting & follow to provide encouragement
HAPPY TRADING 👍

BANK-NIFTY TRADING LEVELS FOR 27-05-2024Explanation:
This is a very useful trading system. This means that you should not take a trade blindly, but rather that there is another confirmation to take the trade you can use this for perfect entry and perfect exit
This trading opportunity is based on volume, previous price, and price range , are included
Entry/Exit point's:
- It has very easy entry and exit points
- In this pair of lines with two colors are given (RED AND BLUE)
- In this the blue line is used to take long entry and the red line is used to take short entry (But it is all based on a more conformation from your trading plan)
Stop Loss/Take Profit:
Stop Loss
- According to this, if you take a long trade, its stop loss will be the red line just below ( A trade can exit either when the price crosses the red line or the 5 minute candlestick crosses the red line. (This can be done according to your preference) )
- A short entry should use the opposite rules to a long entry
Take Profit
-When you take a long entry according to the profit to be booked is on the next red line above. ( Or if there are other reasons, it can be a safe exit )
- Opposite rules for booking profit on long entry are to book profit on short trade. ( The blue line above is the stop loss of short entry )
Timeframe:
According to this, the time frame you should use while taking trades is 5 minutes time frames . (5 minute time frame works well in this)
Risk Disclaimer:
Trading carries significant risk and is not suitable for all traders. You may lose some or all of your capital in a matter of minutes or hours. Market conditions can change rapidly, and prices can move against you quickly. You may not always be able to exit at a favorable price, and you may be required to hold a position overnight, exposing yourself to additional risk. Day trading involves high risk, high leverage, and high stakes, and you should only trade with funds you can afford to lose. Please carefully consider your financial situation, risk tolerance, and trading objectives before engaging in day trading.
Engagement:
Share your insights, ask questions, and learn from others in the community. Whether you're a seasoned pro or just starting out, we're all in this together.
What's your take on the current market conditions? Which trading strategies are working for you? Let's discuss and help each other grow as traders!
Comment below and let's get the conversation started!
Original Content:
This trading setup is the result of my own innovation and expertise, and is not based on any publicly available information or third-party systems. It is a reflection of my dedication to developing a competitive edge in the markets.

US30 SWING3 Days: RTM, it has been lagging however expecting a catch up this week.Look for entries above previous 4 Hour, Good risk to reward

NASDAQ. Weekly trading levels 27 - 31.05.2024During the week you can trade from these price levels. Finding the entry point into a transaction and its support is up to you, depending on your trading style and the development of the situation. Zones show preferred price ranges WHERE to look for an entry point into a trade.
If you expect any medium-term price movements, then most likely they will start from one of the zones.
Levels are valid for a week, the date is in the title. Next week I will adjust the levels based on new data and publish a new post.
! Please note that brokers have a difference in quotes, take this into account when trading.
The history of level development can be seen in my previous posts. They cannot be edited or deleted. Everything is fair. :)
----------------------------------------------
I don’t play guess the direction (that’s why there are no directional arrows), but zones (levels) are used for trading. We wait for the zone to approach, watch the reaction, and enter the trade.
Levels are drawn based on volumes and data from the CME. They are used as areas of interest for trading. Traded as classic support/resistance levels. We see the reaction to the rebound, we trade the rebound. We see a breakout and continue to trade on a rollback to the level. The worst option is if we revolve around the zone in a flat.
Do not reverse the market at every level; if there is a trend movement, consider it as an opportunity to continue the movement. Until the price has drawn a reversal pattern.
Don't forget to like Rocket and Subscribe!!! Feedback is very important to me!

S&P500 INDEX: More Growth is Coming
S&P500 index recently updated the all-time high.
After a violation, the previous ATH turned into support.
The market retested that and positively reacted.
I believe that a bullish trend will continue.
The market may keep growing to 5380.
❤️Please, support my work with like, thank you!❤️

Nifty Daily | Trading Range | Key levelsNifty Daily | Trading Range | Key levels
21841/22464/23059
22464 is center point.. for 21841/23059
